Chart by TradingView
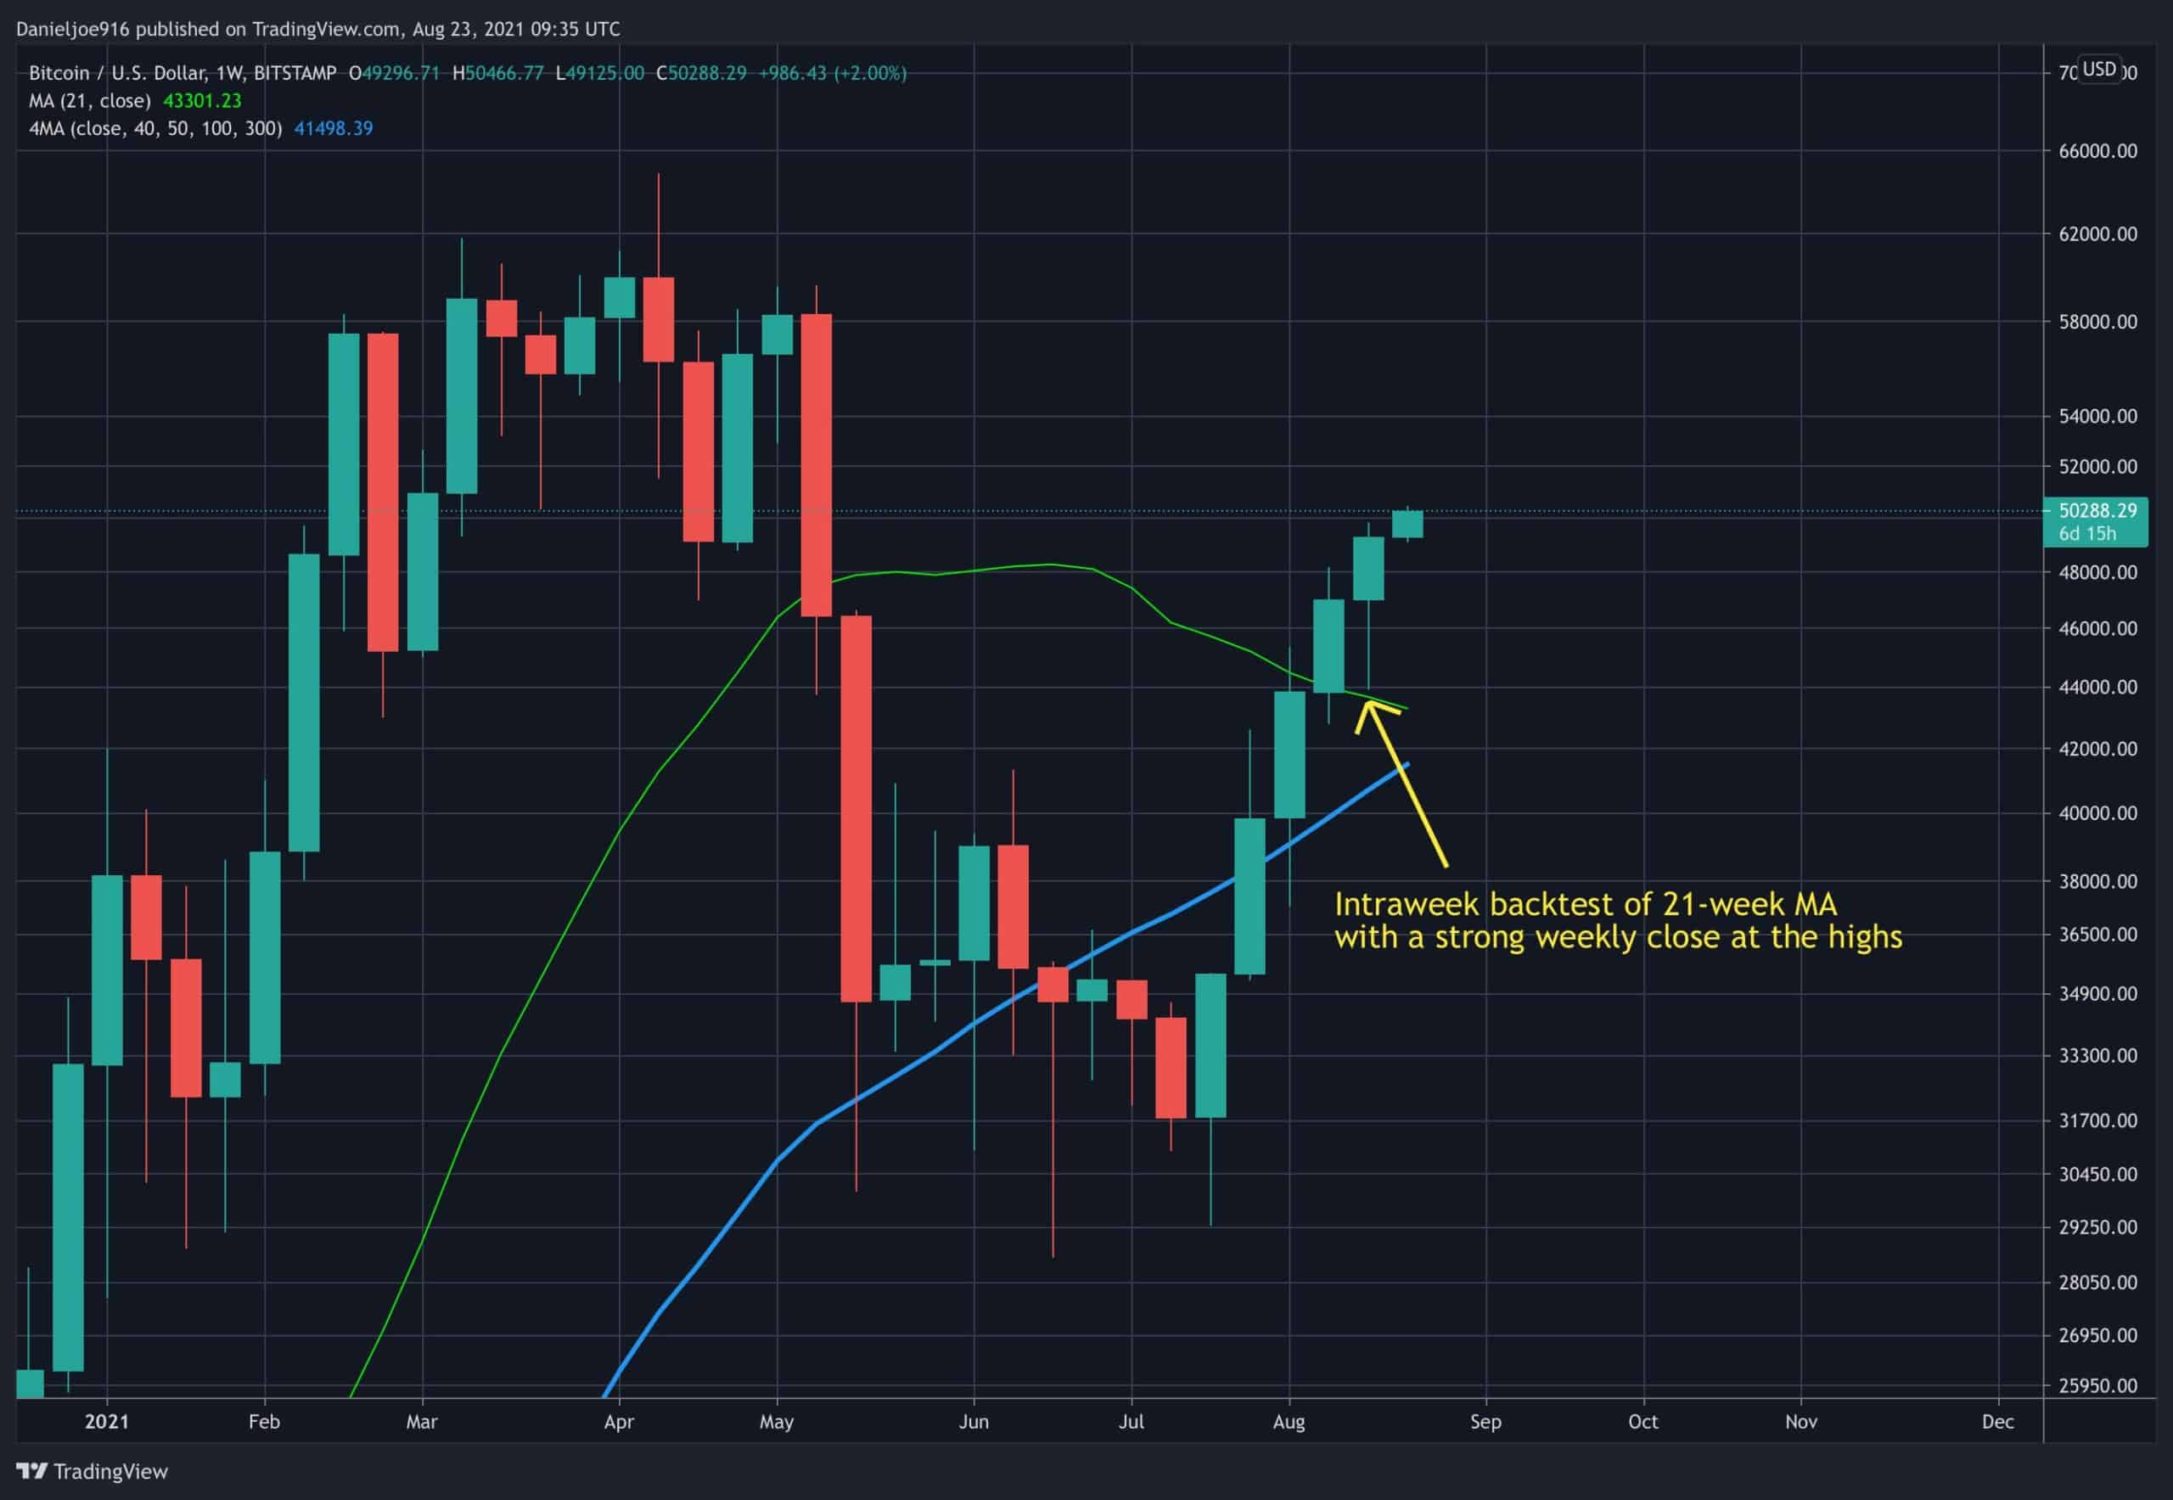
Bitcoin price staged an impressive rally above resistance at $48.1k and closed the past week’s candle at the highs at $49.2k to make the second consecutive weekly close above the critical 21-week and 200-day moving average lines.
BTC’s strong weekly close further validates the largest technical buy signal, which flashed on August 15th, 2021, as we reported here the day it flashed.
Overall, it’s still moderately early in confirming bull market continuation as bitcoin price has yet to challenge a major resistance zone between $55-58k. In terms of mid to high time frame structure, the technicals have significantly improved, giving the bulls the advantage.
Just five weeks ago, BTC was trading at $29.3k, with most market sentiment showing extreme fear and bearishness.
Although the charts and market sentiment offered little hope, the on-chain metrics were bullish – strongly suggesting that bitcoin was being heavily accumulated while the weak hands and smaller miners were selling, getting the market closer to capitulation. Since then, BTC has soared 72%, reaching an intra-day high of $50.4k, as of now.
BTC’s price action the past week has been very impressive. With risk-off in global equities and a rising dollar, Bitcoin managed to push higher, outperforming the broader markets, which indicates strength.
During the past week, the price found support on the 21-day moving average (~$43.9k) after dipping below the 200-day moving average (~$45k) on an intra-week basis. After finding support at $43.9k, BTC staged a powerful rally higher, reclaiming the 200-day moving average and closing above the local high at $48.1k.
Bitcoin then printed a weekly close at the highs, closing at $49.2k, which added a boost to mid to long-term momentum. The powerful move higher has managed to flash another bullish pulse, push 3-day momentum above neutral, and help the weekly moving average convergence divergence continue last week’s bullish cross higher.
The last time BTC momentum turned this bullish was in May 2020, after the March 2020 liquidity crisis, which led to a significant rally to new highs by April 2021.
Over the weekend, BTC consolidated and back-tested previous support at $48.1k and continued to push higher. At the time of writing, the bitcoin price has just started to test resistance at $50k and printed the first 4-hour close above the critical level.
Crypto Twitter cheered as another round of BTC shorts were liquidated, sending BTC to an intraday high of $50.4K. So far, the Asia trading session is showing strength, potentially providing a tailwind of more momentum higher as the US session begins in the next few hours.
The 4-hour chart is looking better as the downtrend line on the relative strength index has been broken, suggesting near-term strength. It is very important for BTC to continue pushing higher near term to help push the relative strength to form a higher high.
On-chain metrics continue to show bullish signals, especially during the near-term pullbacks and consolidation. Spot exchange reserves remained flat and started to trend lower, even despite a minor pullback. Spot exchange netflows showed no major spikes of inflows while averaging a net outflow, suggesting continuing bitcoin accumulation. Bitcoin miner reserves remained at the highs confirming miners in aggregate continue to accumulate instead of selling.
Futures’ open interest has been rising, reaching $6.08 billion, with funding rates still neutral. This suggests the bears remain skeptical of this rally, which can be considered a net positive for the market.
Historically, large rallies with increasing futures open interest and positive funding rates for extended periods of time indicate the market position net-long with too much leverage.
This increases the risk of a larger pullback which would liquidate long positions, likely triggering a cascade of sell orders. The fact that funding rates remain suppressed, even with a 72% rally, suggests the market is positioned for further upside as net long positions have yet to become overextended.
As mentioned above, in addition to flipping $50k from resistance to support, the critical zone bitcoin needs to reclaim is $55-58k. This particular resistance zone has strong technical resistance, and a large block of UTXO realized price distribution, where we can expect supply to enter the market.
With bitcoin looking to complete Phase D in Wyckoff Accumulation, with an eventual entry into Phase E, it will be critical to see increasing volume as the $55k to $58k is tested. Between May to August, BTC has accurately followed each phase in Wyckoff Accumulation, satisfying Effort/Result and Supply/Demand principles, ultimately leading to deep supply exhaustion.
With strengthening fundamentals, bullish price action, Bitcoin reclaiming the 21-week and 200-day moving average for the second weekly close, momentum flashing more mid to long term buy signals, and overall bullish on-chain metrics, the conditions continue to favor the bulls.
The next few weeks will be critical for the validation of bull market continuation. The bitcoin price needs to hold the mid to upper 40k range as near-term support in case of global markets sell-off and, most importantly, remain above the 21-week and 200-day moving average.