There was some good news since our previous weekend price analysis, as Bitcoin returned to retesting the higher descending angle of the bearish triangle.
However, yesterday we saw another fake-out when Bitcoin quickly turned down back under the confluence price area.
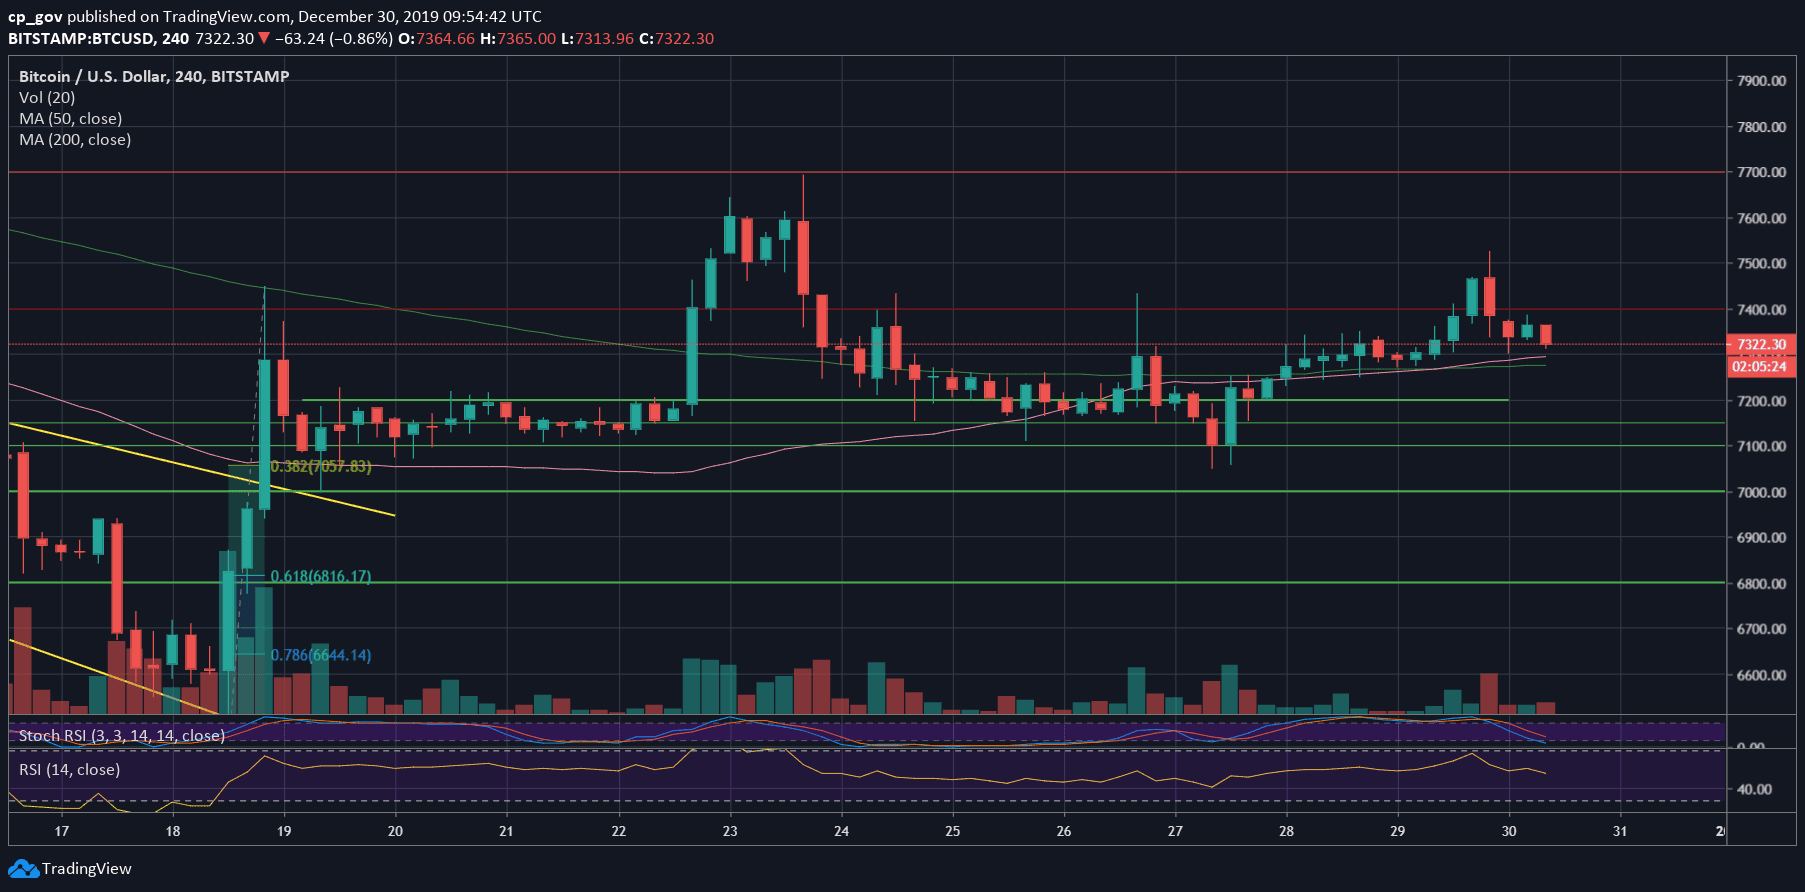
A new weekend starts today, not a regular one since many traders are still on their vacation. The ones that are trading are not many, as the trading volume levels are close to the month’s low.
The new week brings the usual Monday CME Futures price gap; however, this time the gap is positive and is relatively minor – down below at $7313. As been said, most of those gaps are quickly getting filled. We won’t be surprised to see Bitcoin wicking down to $7300.
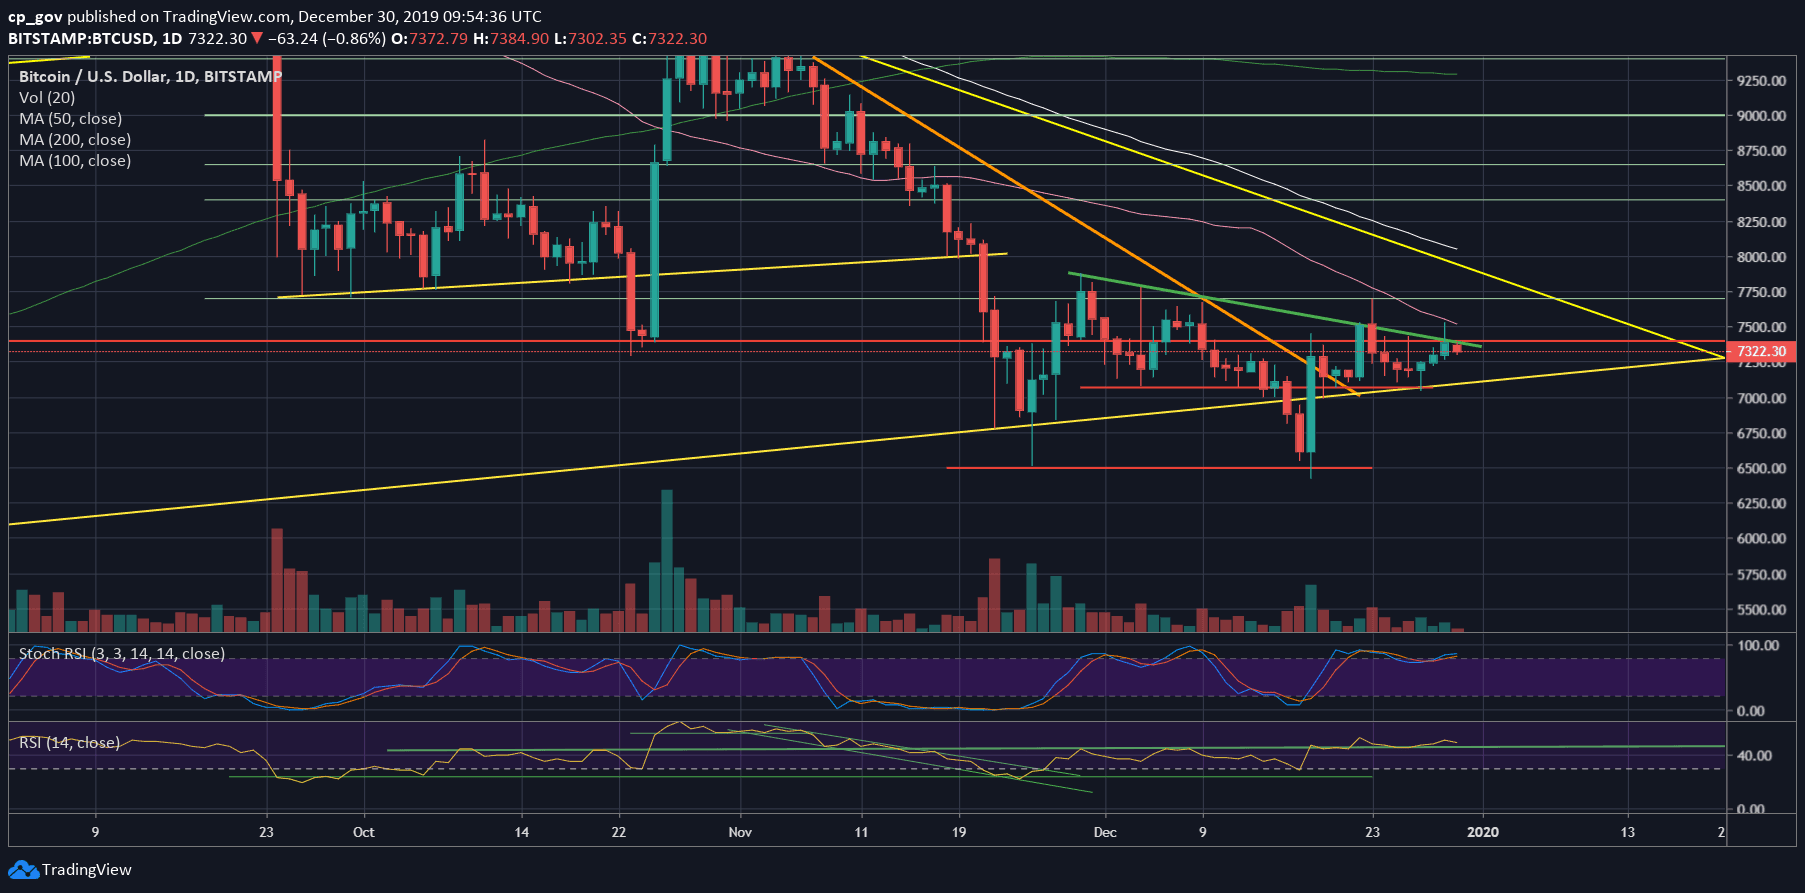
The following daily chart tells the whole story. Bitcoin is building another bearish triangle, since the end of November.
Yesterday, it created another wick to the bullish side, touching the significant 50-days moving average line (marked by pink, roughly around $7530), and rapidly down below to close the daily candle inside the bearish triangle area.
As mentioned here on our recent price analysis, we did receive a short-term reversal following Friday’s Hammer shaped candle. The three days since then were all green, as the price of Bitcoin surged from $7050 to $7524 (yesterday’s high).
For the short-term, the bulls would like to turn December candle to green. This is not an impossible mission, and it only need to close above $7560. As we already know, Bitcoin can surge even 40% in just a day.
Total Market Cap: $197.2 billion
Bitcoin Market Cap: $134.5 billion
BTC Dominance Index: 68.2%
*Data by CoinGecko
– Support/Resistance: Bitcoin is now facing again the confluence price area of $7300 – $7400. This includes the significant descending trend-line, as discussed above, which is the first major level of resistance.
Further above lies the 50-days moving average line (pink), currently around $7520 (the high of yesterday). Higher above lies the $7700 – $7800 resistance area.
From below, the first level of support is $7300, along with the CME’s gap and the 4-hour MA-200 and MA-50.
Further below lies $7200, together with the mid-term ascending trend-line. Down below lies $7000 – $7050 support.
– The RSI Indicator: The bullish divergence is clearly seen on the RSI; this might indicate on bulls accumulating at those prices.
– Trading volume: Discussed above.