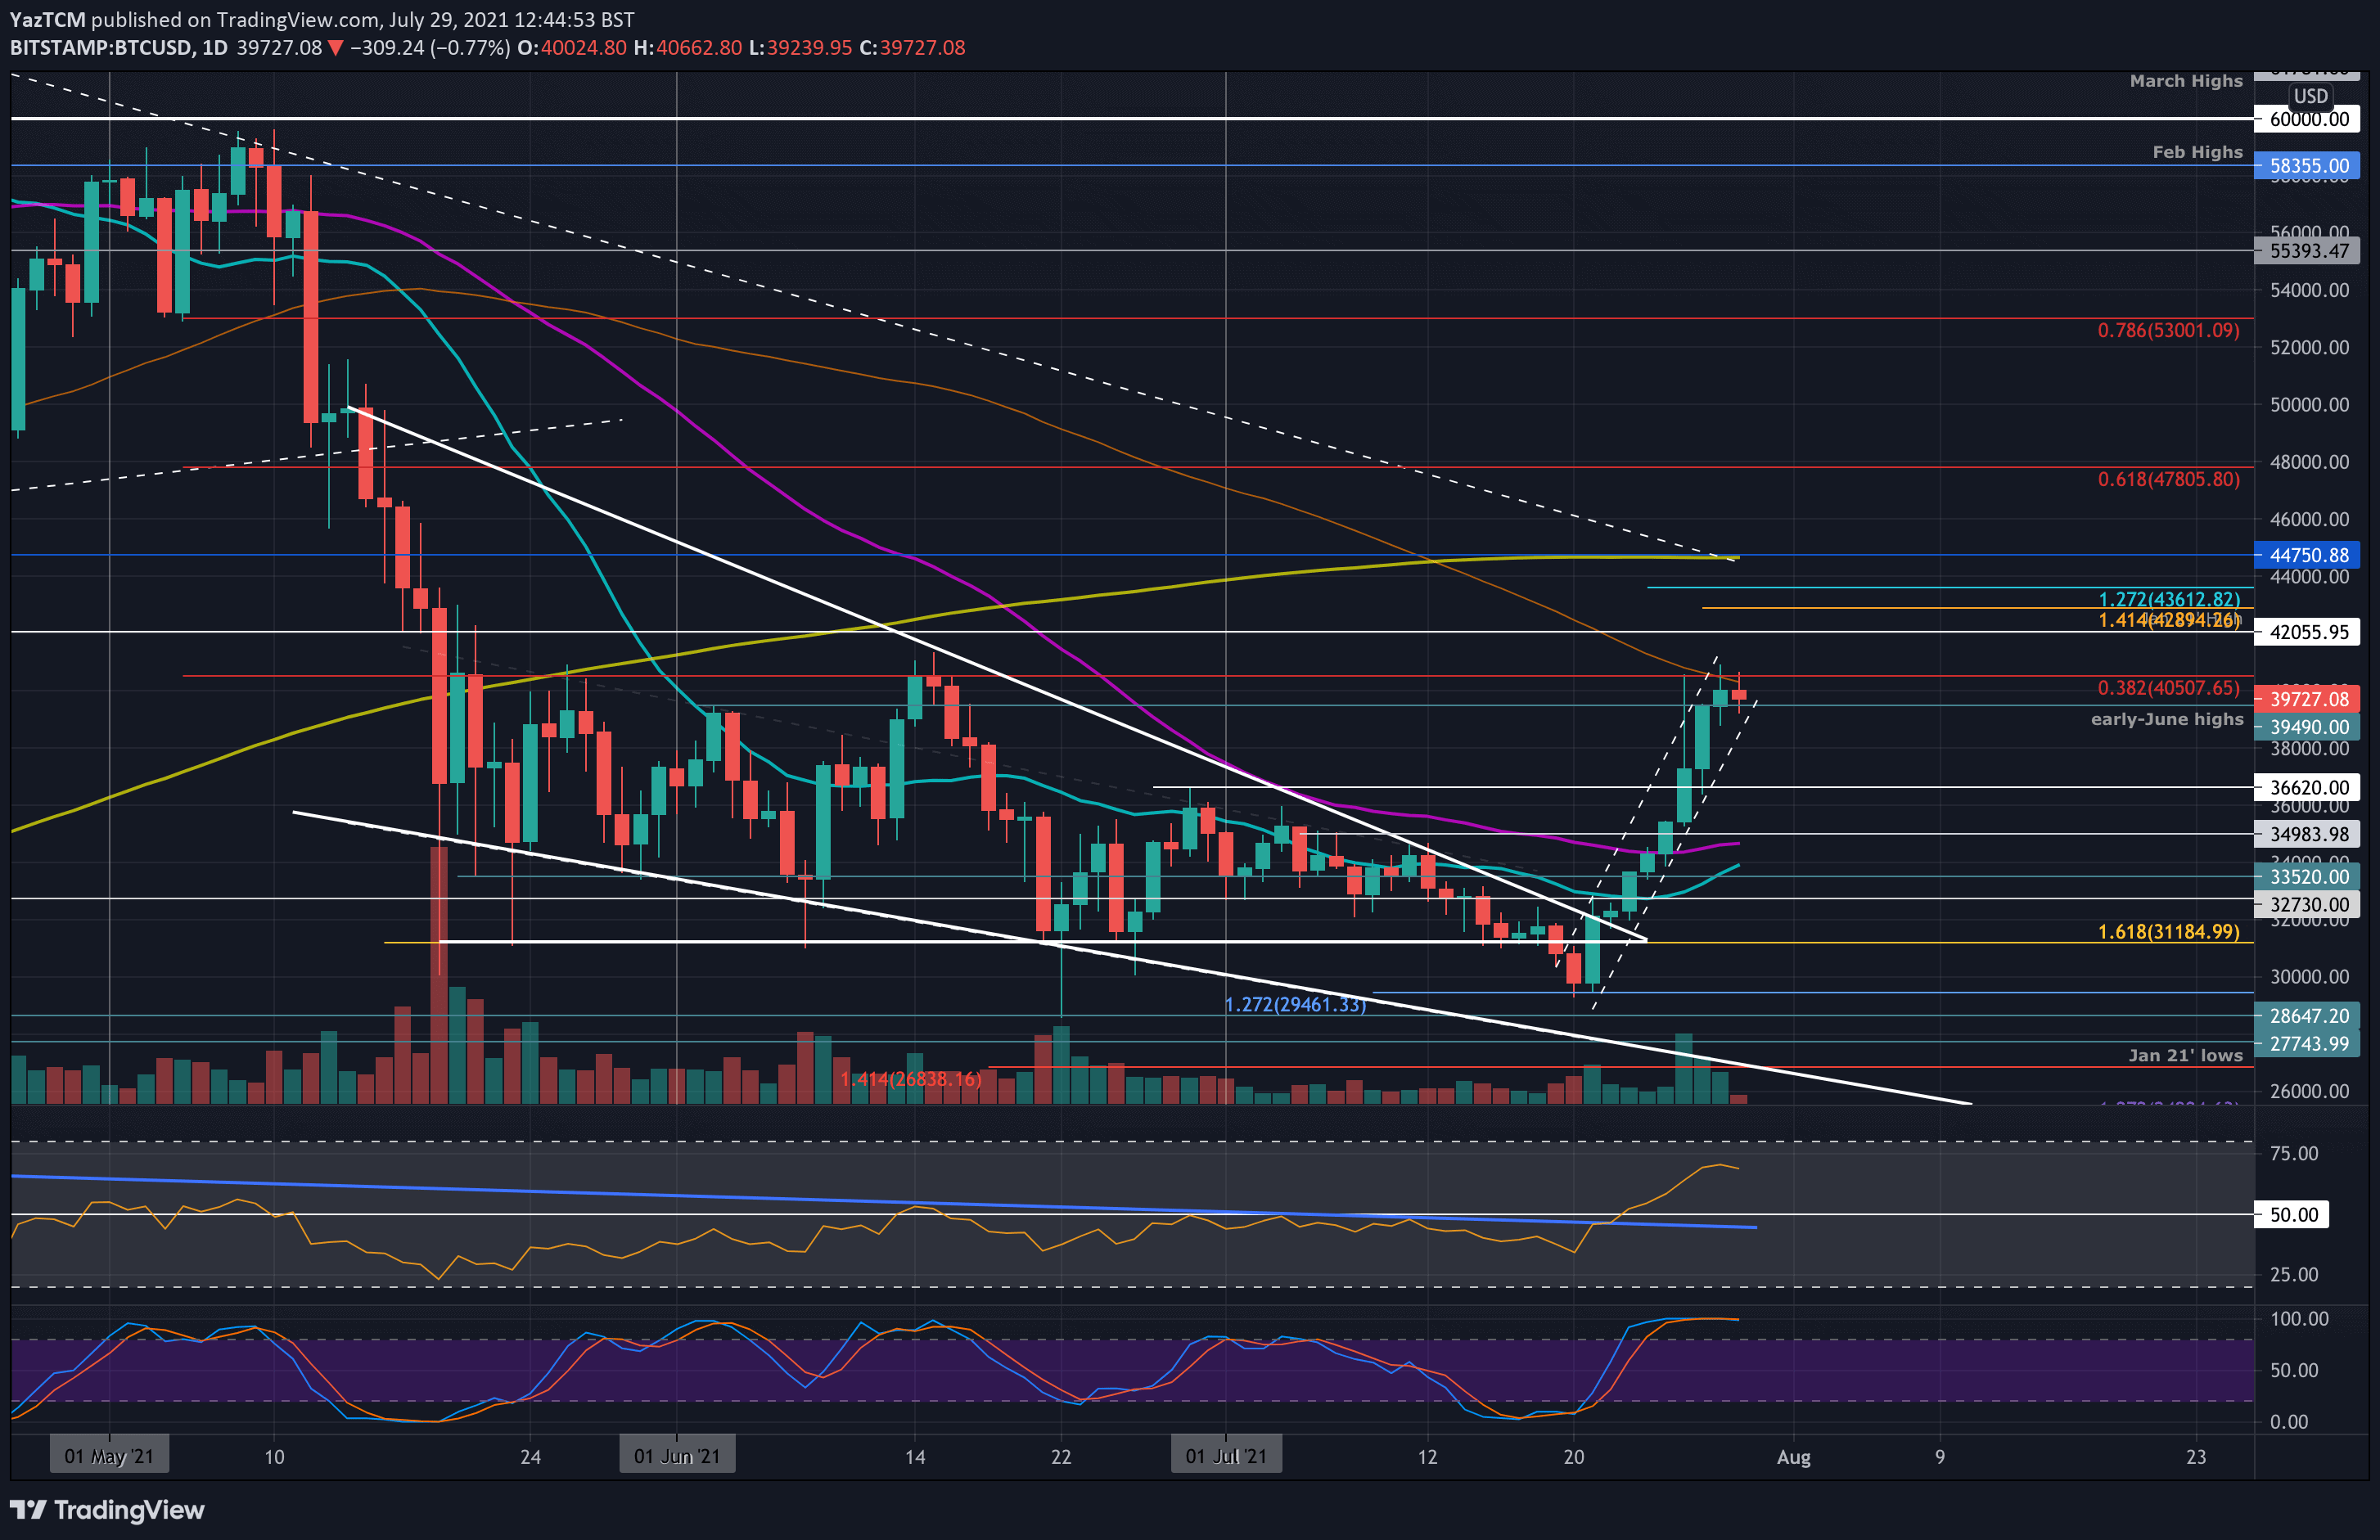
BTC/USD Daily Chart. Source: TradingView.
Bitcoin is up by an impressive 22% this week as it currently battles with the $40K resistance area. As mentioned before, for the past two months, bitcoin’s price was trading between $30K and 42K. This week saw its highest point since June 15 ($41.3K according to BItstamp).
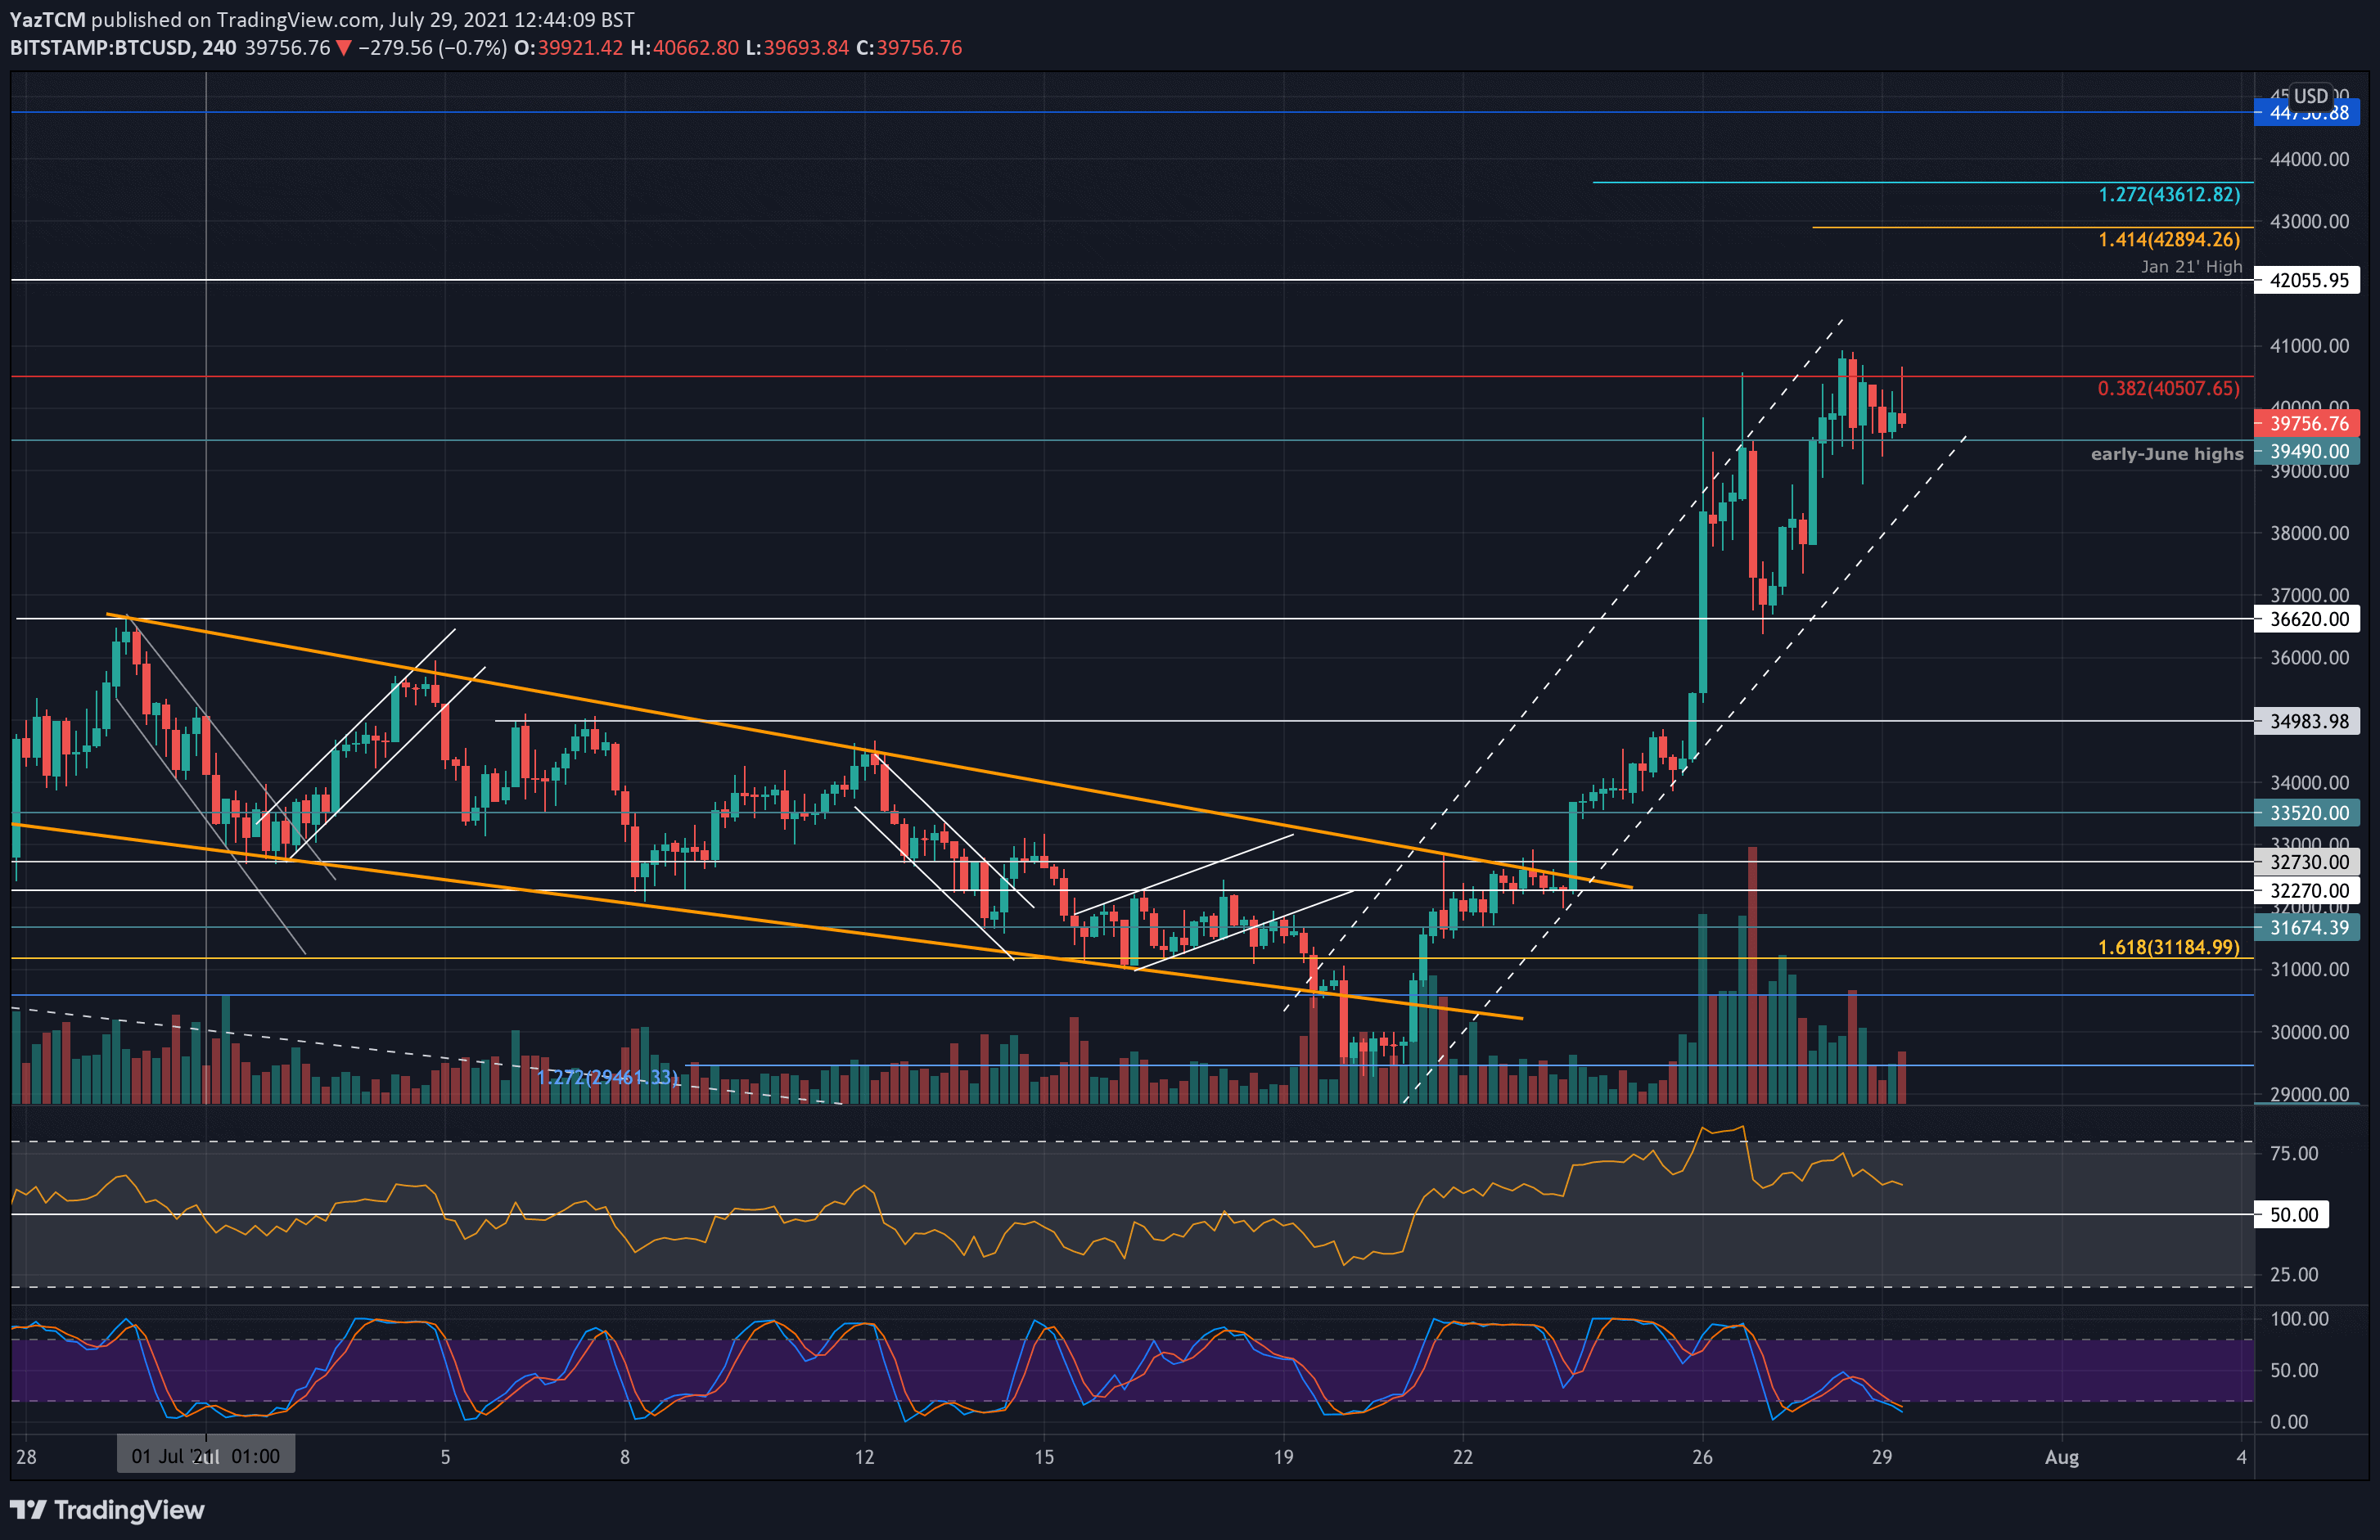
The past week has been promising for BTC, after breaking a descending wedge pattern and finally getting to overcome both the 20 and the 50 days moving average lines. This break of the 50-day MA was the first time the cryptocurrency has been trading above it since early May. As can be seen in the short-term chart below, the price surge is largely confined inside a nicely shaped ascending price channel.
Despite the promising momentum for the bulls, BTC is now testing major resistance of $40-42K, which is the top boundary of the above-mentioned range. Since the crash on May 19th, bitcoin was unable to close a weekly candle above $39K. The area also includes the 100-day moving average line at $40.3K as of writing these lines.
Besides, after consecutive eight green daily candles, it looks like Bitcoin might need to cool off a bit, as there’s bearish divergence appearing on the short-time frame, which is the 4-hour chart.
Nevertheless, if BTC manages to break through the $40-42K resistance area with a daily and/or weekly close above – the way to BTC $50K might be very quick.
Key Support Levels: $39,500, $37,000, $36,620, $36,000, $35,000, $34,460.
Key Resistance Levels: $40,000 – $40,500, $41.3K, $42,000, $43,610, $44,750, $47,800.
Moving forward, the first resistance lies between $40-40.5K, which contains the 100-day MA and a bearish .382 Fib. Above this, resistance lies at $41,300 (June’s high), $42,000 (Jan 2021 highs), $43,610 (1.272 Fib Extension), $44,750 (200-day MA & descending trend line), and $47,800 (bearish .618 Fib).
On the other side, the first support lies at $39,500 (early-June highs). This is followed by support at $37,000, $36,620, $35,000 and $34,460 (50-day MA).
As mentioned, there is a bearish divergence developing on the 4-hour chart. However, on the daily, the momentum is clearly in favor of the bulls.