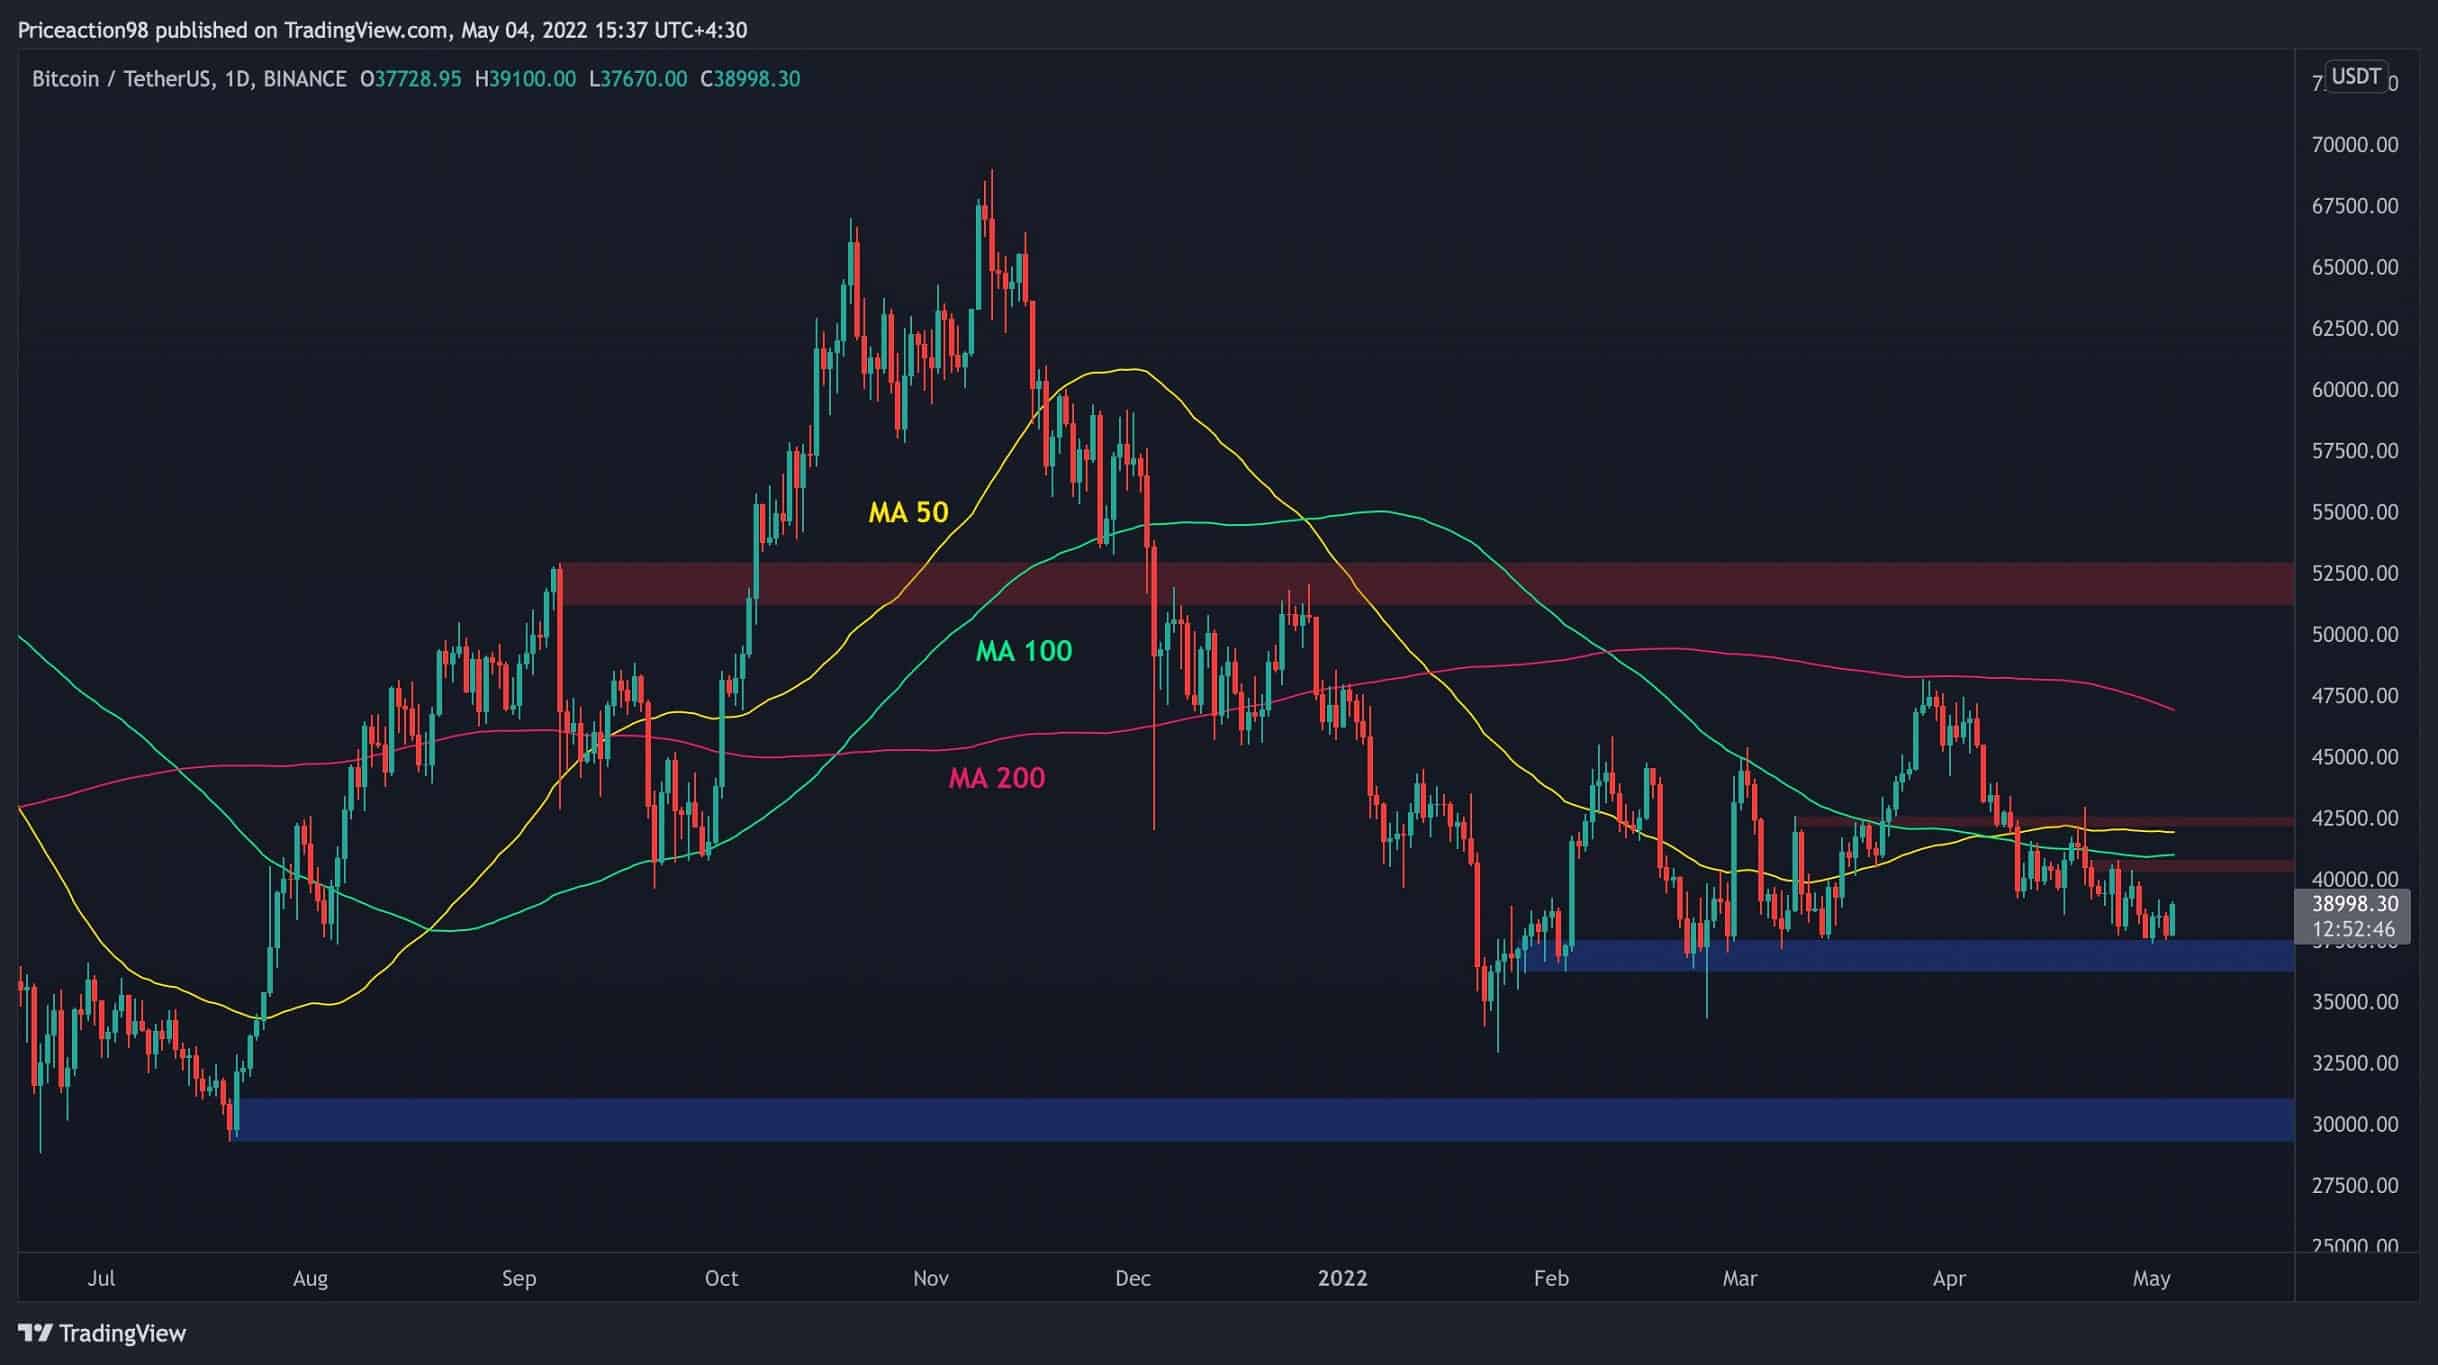
Bitcoin has been on a slow decline for the past couple of weeks. The price has been rejected from the 100-day and 50-day moving averages a couple of times and dropped to the $37K level.
By: Edris
Bitcoin is currently rebounding from the mentioned level and could rally towards the $40K zone and retest the 100-day moving average.
If the price breaks these dynamic and static resistance levels, the 50-day moving average and the $43K level would be the next significant obstacles before the considerable 200-day moving average, which would be the key indicator for determining a bullish or bearish trend in the mid-term.
On the other hand, if the $37K is broken to the downside, the price could crash to the $30K demand zone in the short term.
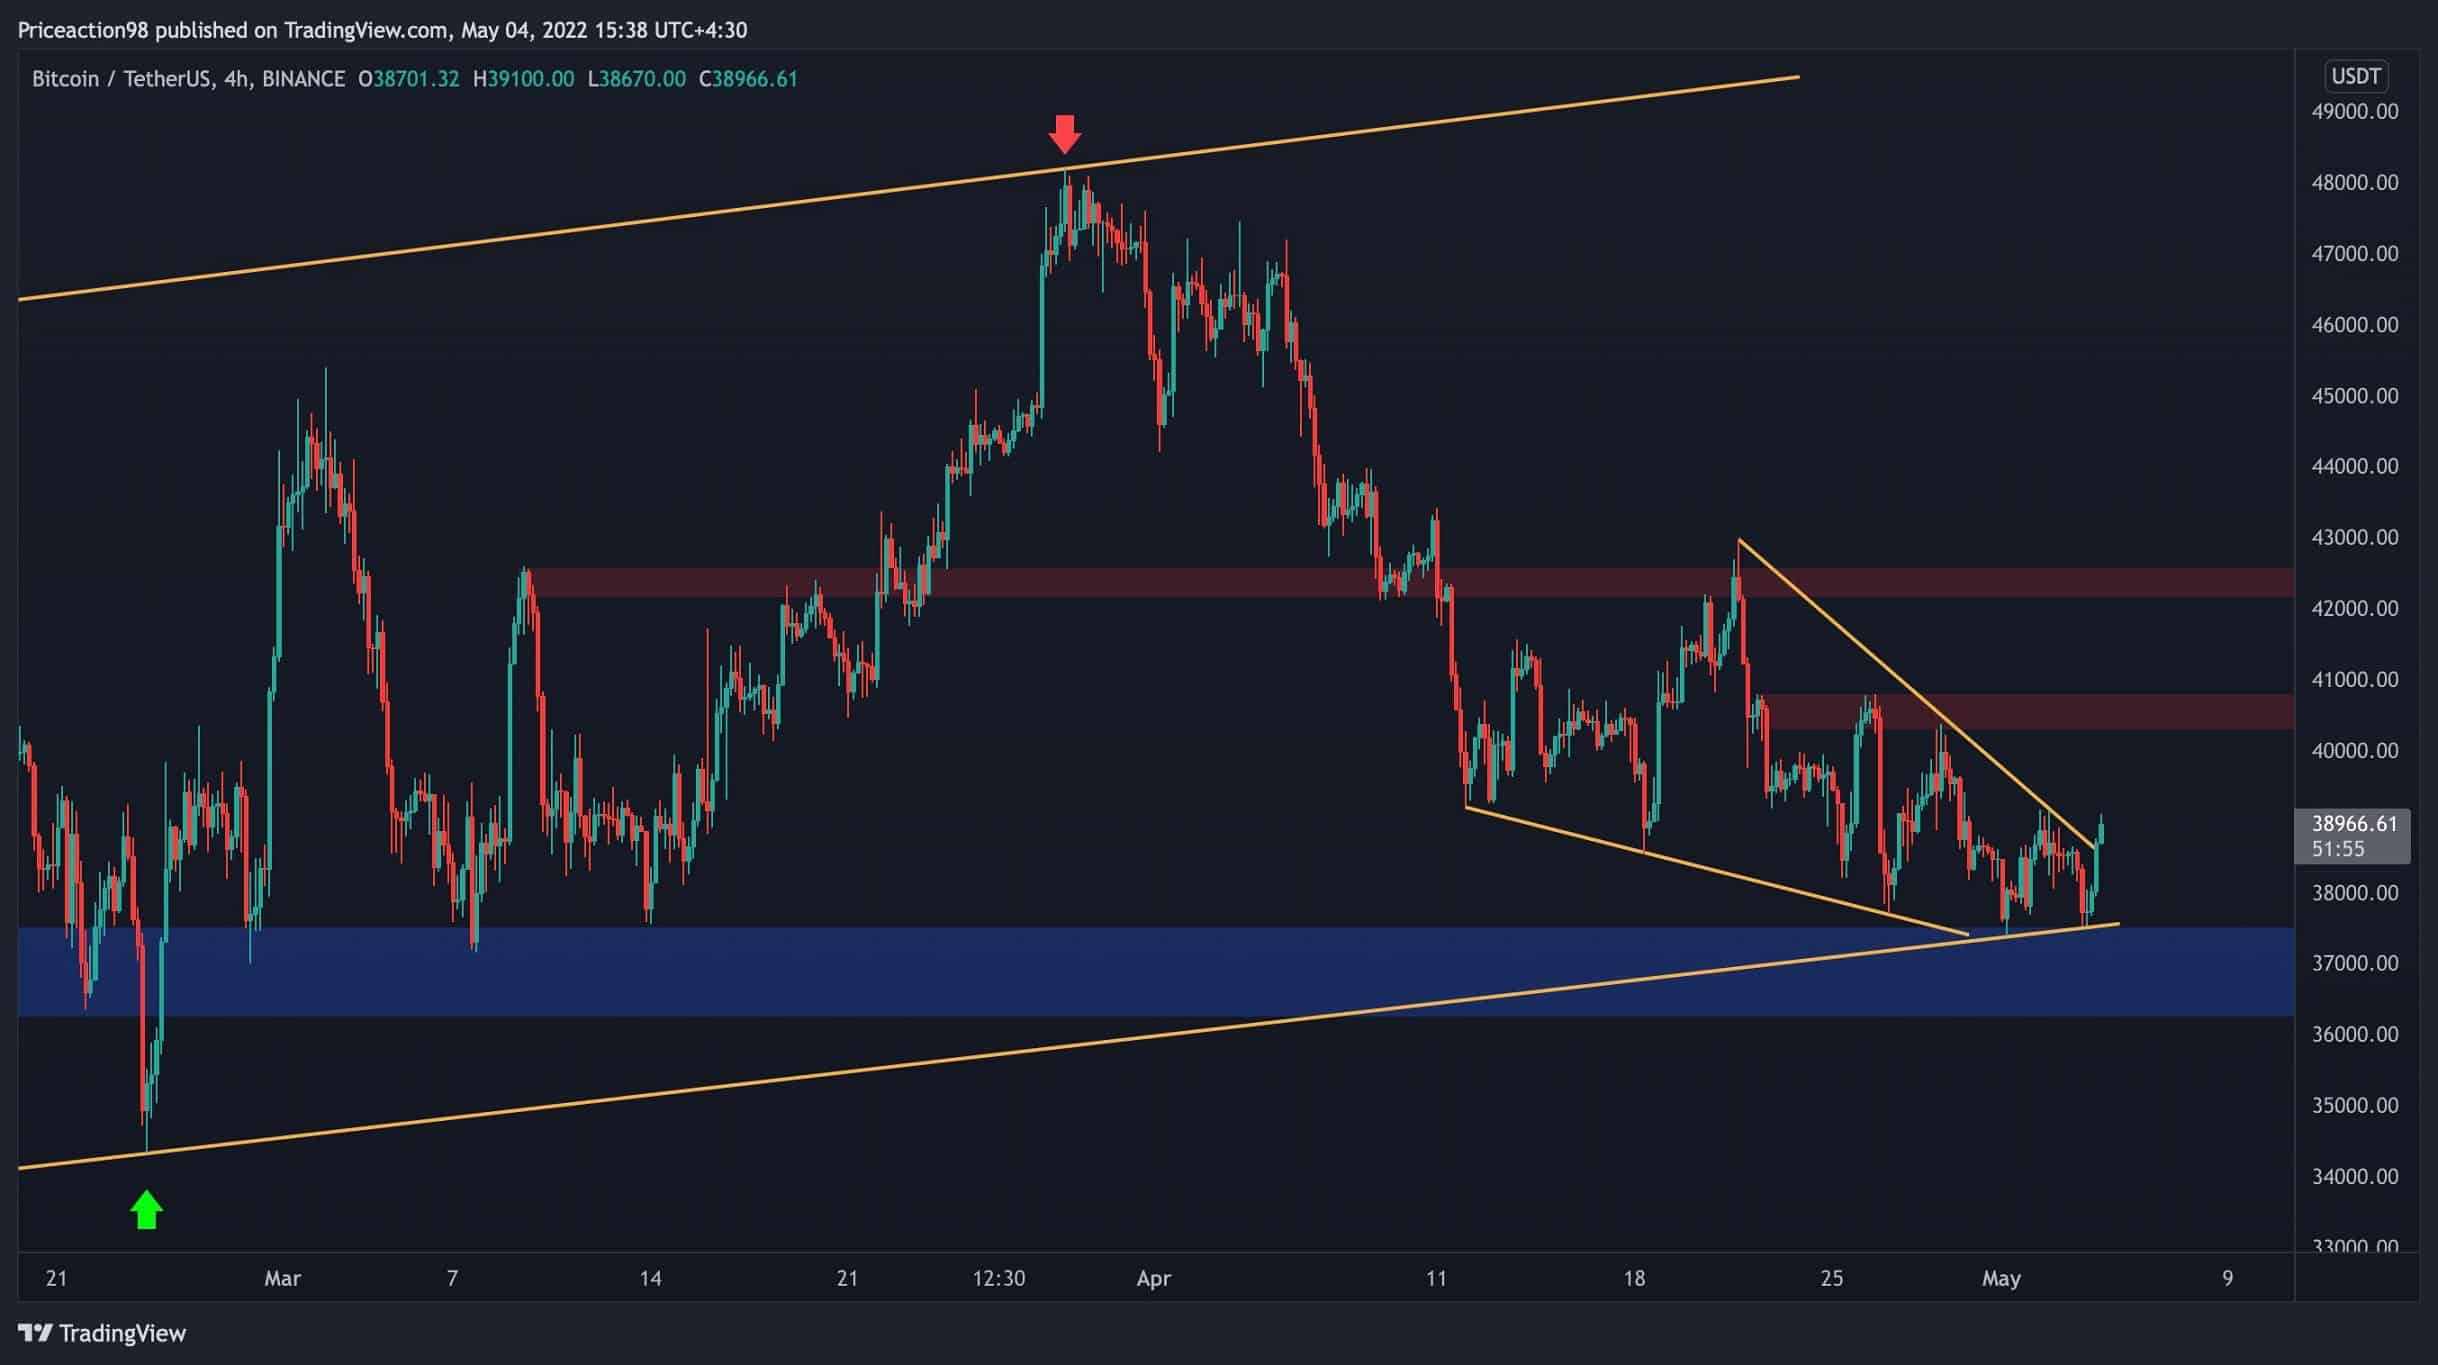
On the 4-hour timeframe, the price has been forming a falling wedge over the past couple of weeks after getting rejected from the $43K area.
However, a bullish breakout seems to be happening now, as the price is pushing above the higher trendline of the falling wedge. This pattern is considered a bullish reversal pattern, and a valid breakout and retest could lead to a rally towards the $40K and $43K resistance levels.
Conversely, if the price drops back into the pattern, this breakout would be considered a fake one, selling pressure could return, and a breakdown of the large bearish flag would become more probable. In this case, the price could plunge below the previous $33K low and retest the $30-$31K demand zone, a level that could potentially hold the price and initiate a bullish trend for the mid-term.
Onchain By Shayan
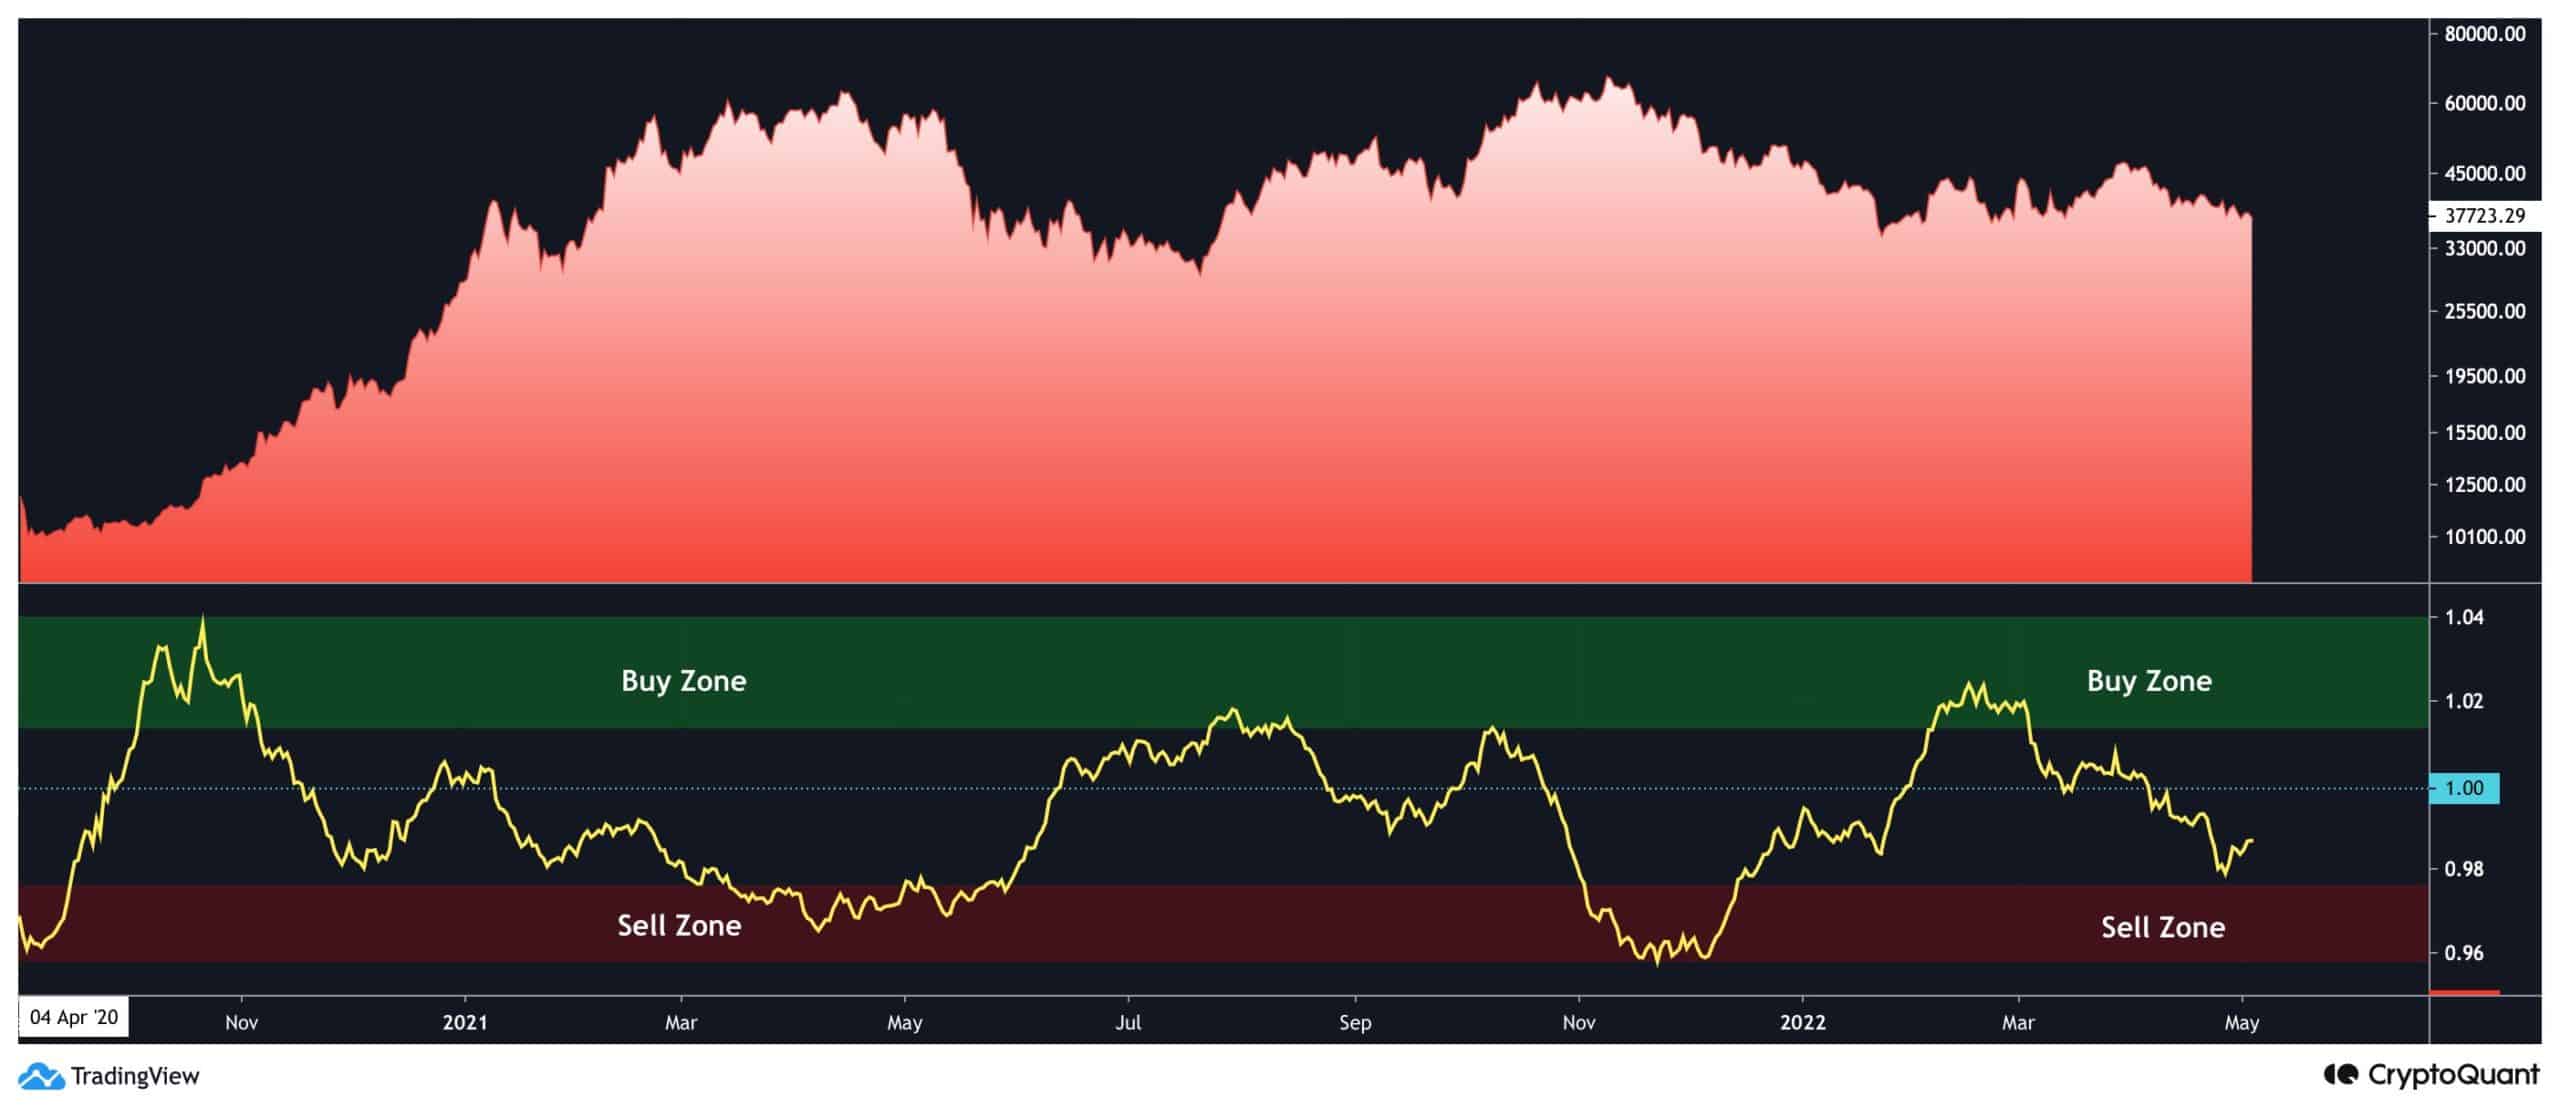
The 30-day moving average of the Taker Buy/Sell Ratio measure and Bitcoin’s price are shown in this chart. Values over 1 suggest that more buyers are prepared to pay a higher price for BTC, indicating that buying pressure is more robust than selling pressure. There is a substantial likelihood of a price increase, indicating bullish sentiment. On the other hand, values below one suggest that more sellers are eager to sell coins for a lower price, meaning that sell pressure is more robust.
When the moving average crosses into the red zone, it usually implies intense selling pressure and is a bearish indication. It indicates high buying pressure and is a bullish sign when it reaches the green area. After getting the red zone, the MA is now recovering. This suggests that buyers return to the market, which might signal another bullish rise.