In our recent analysis from Tuesday, we had mentioned the fact that the attempts to break the $10,000 mark are getting weaker over time. In soccer, when you don’t score despite many chances, the other team will score and win.
During the recent hours, Bitcoin was slowly losing momentum, and as of writing these lines, the price crossed down the $9000 mark, towards the $8900 support.
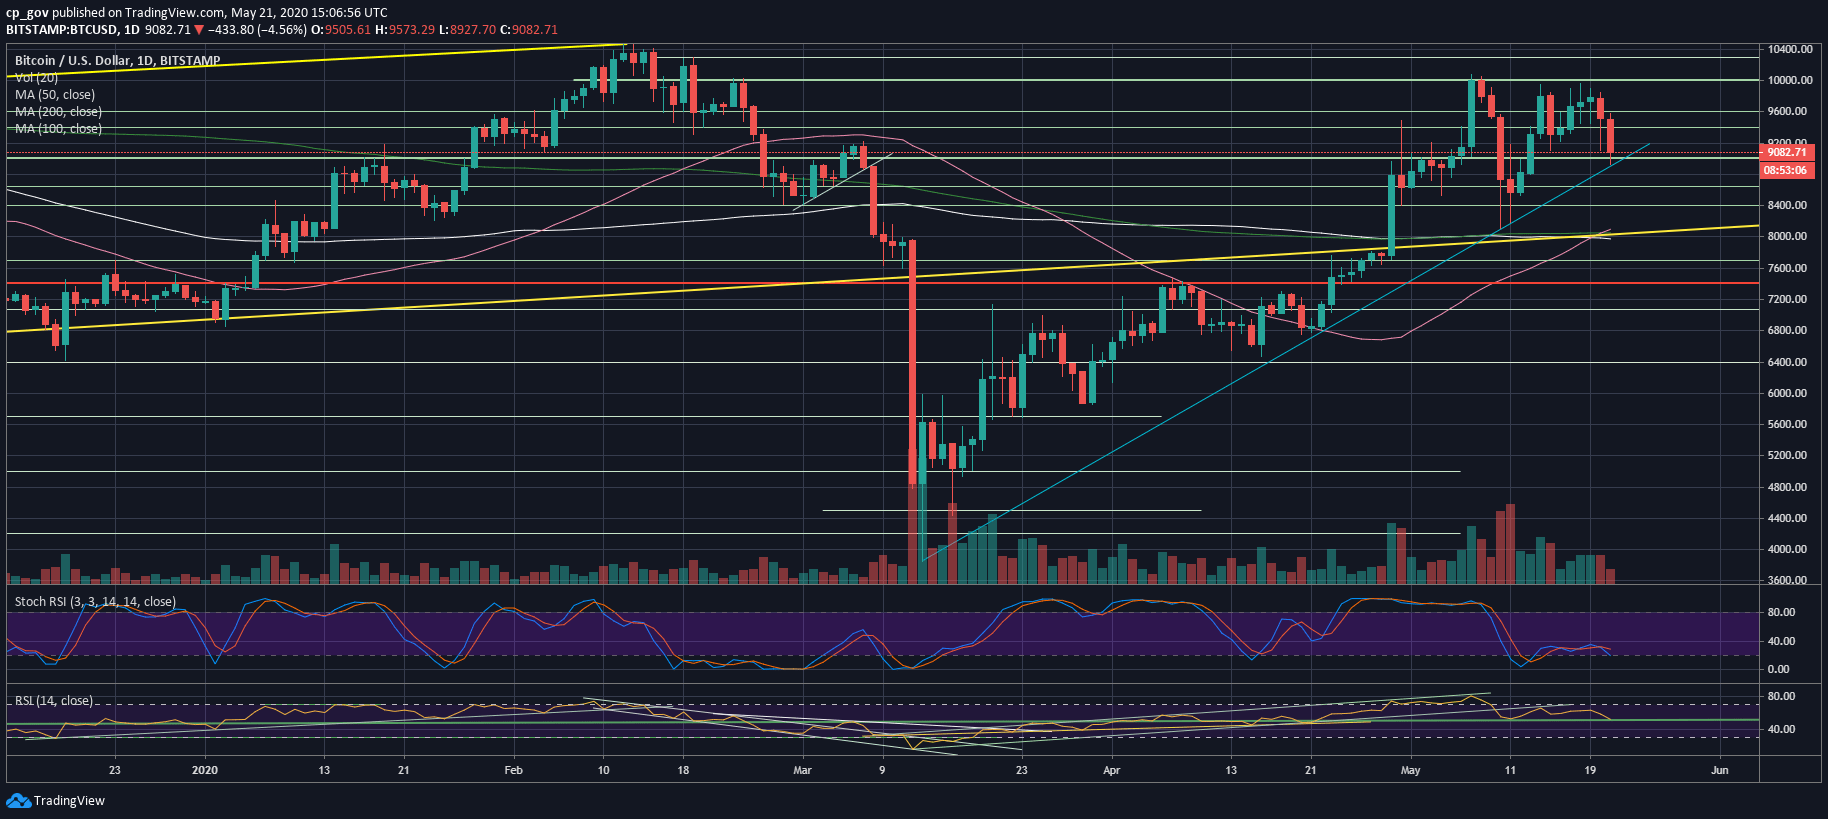
The latter is also the blue marked mid-term ascending trend-line on the following daily chart. This rising trend-line was started forming on the March 12 crash below $3800. The $8900 should provide strong support for Bitcoin since it was a tough level to break up as resistance.
Yesterday we mentioned the fact that Bitcoin’s daily chart had gone through a Golden Cross, which is text-book bullish. Despite that, the exact opposite took place. As mentioned, Golden and Death Crosses, are both lagging indicators.
As you might remember, the Death Cross on October 26 also led the “Chinese Pump,” which was the day Bitcoin rose over 40%.
Total Market Cap: $267.6 billion
Bitcoin Market Cap: $179.1 billion
BTC Dominance Index: 66.9%
*Data by CoinGecko
Bitcoin is now facing the critical level of $8900, which is the March-12 ascending trend-line. In case of a breakdown, BTC is likely to revisit lower areas – $8800, $8650, $8520, $8400. Further down lies $8000 – $8200, the strong buy area, which also includes the three significant moving average lines – 50, 100 and 200 days.
From above, the first support turned resistance levels now lie at $9200 and $9300. This is followed by $9450 and $9600.
On our most recent BTC analysis, we mentioned the weakness of the RSI indicator. This weakness now resulted in the last 2-days’ almost $1000 price drop.
Looking at the daily RSI, the indicator now reached a critical level of support at 50. It will be interesting to see if the RSI can hold the important level.
The trading volume had been declining over the past two weeks. This was also a sign of weakness – the less volume, the weaker the attempts to break.