Bart is a nickname to a chart pattern which is forming Bart’s head: a quick price gain, consolidation and a quick dump back to the baseline before the gain. Bitcoin likes to build Barts in its price chart. However, there are also upside-down Barts (dump -consolidation – gain).
Looking on the hourly chart of Bitcoin, we can see the dump mentioned on our previous analysis, consolidation, and support around the crucial $3700. From there, back to the baseline (around $3800) as happened yesterday.
This had brought Bitcoin back to the tight range between $3750 – $3850, the range BTC was trading at last week.
Total Market Cap: $132.7 Billion
BTC Dominance: 51.7%
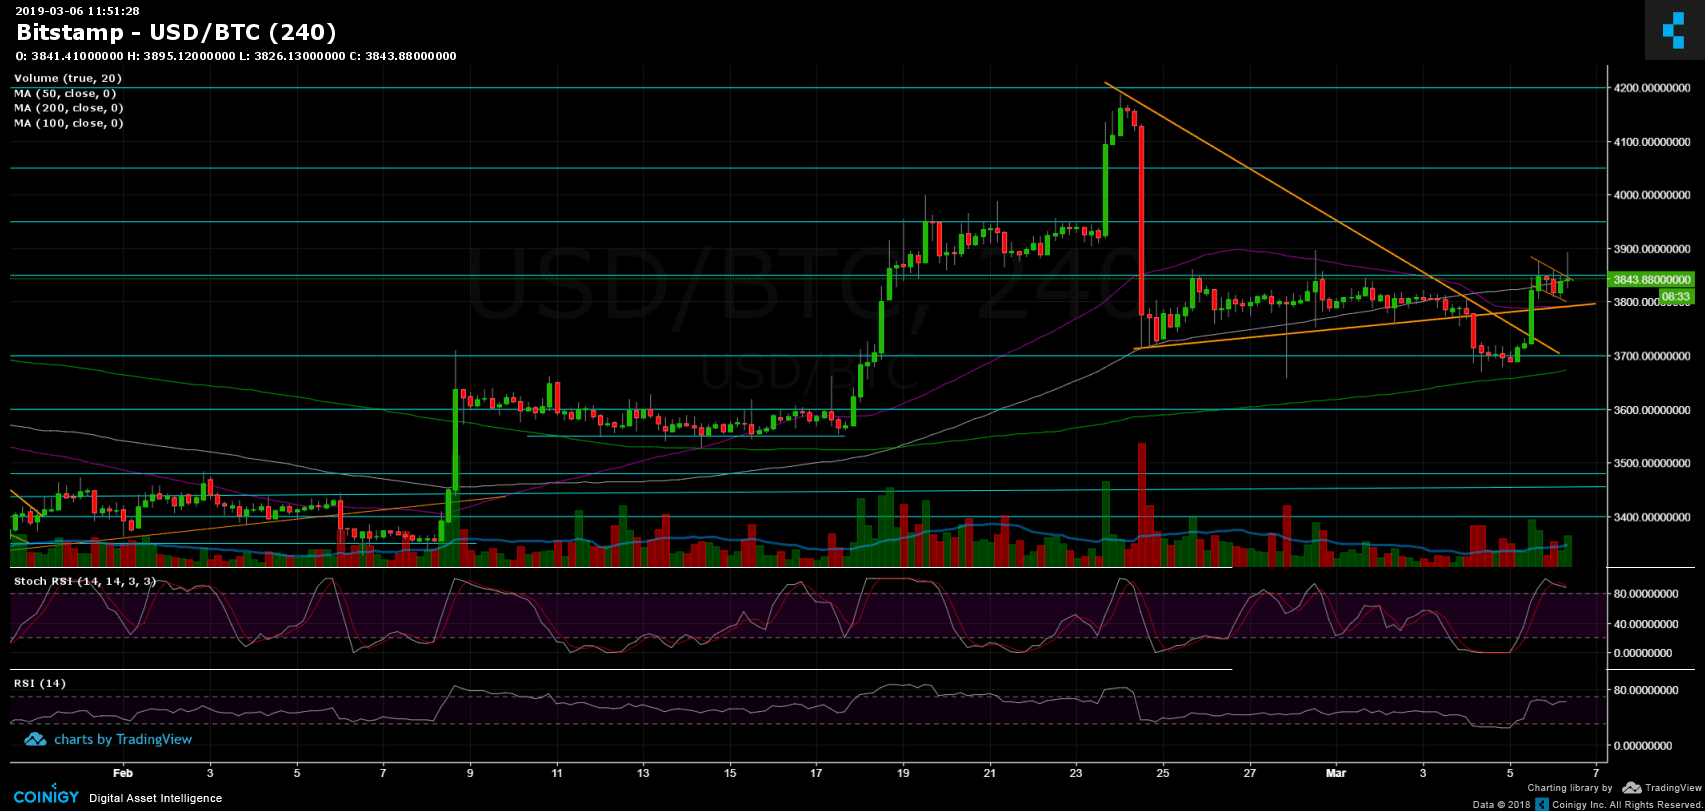
– Looking at the 4-hour chart, we can see that BTC is forming a bull flag. If this formation plays out on a break-up, the target of this move should be around $4000 (the size of the flag’s pole).
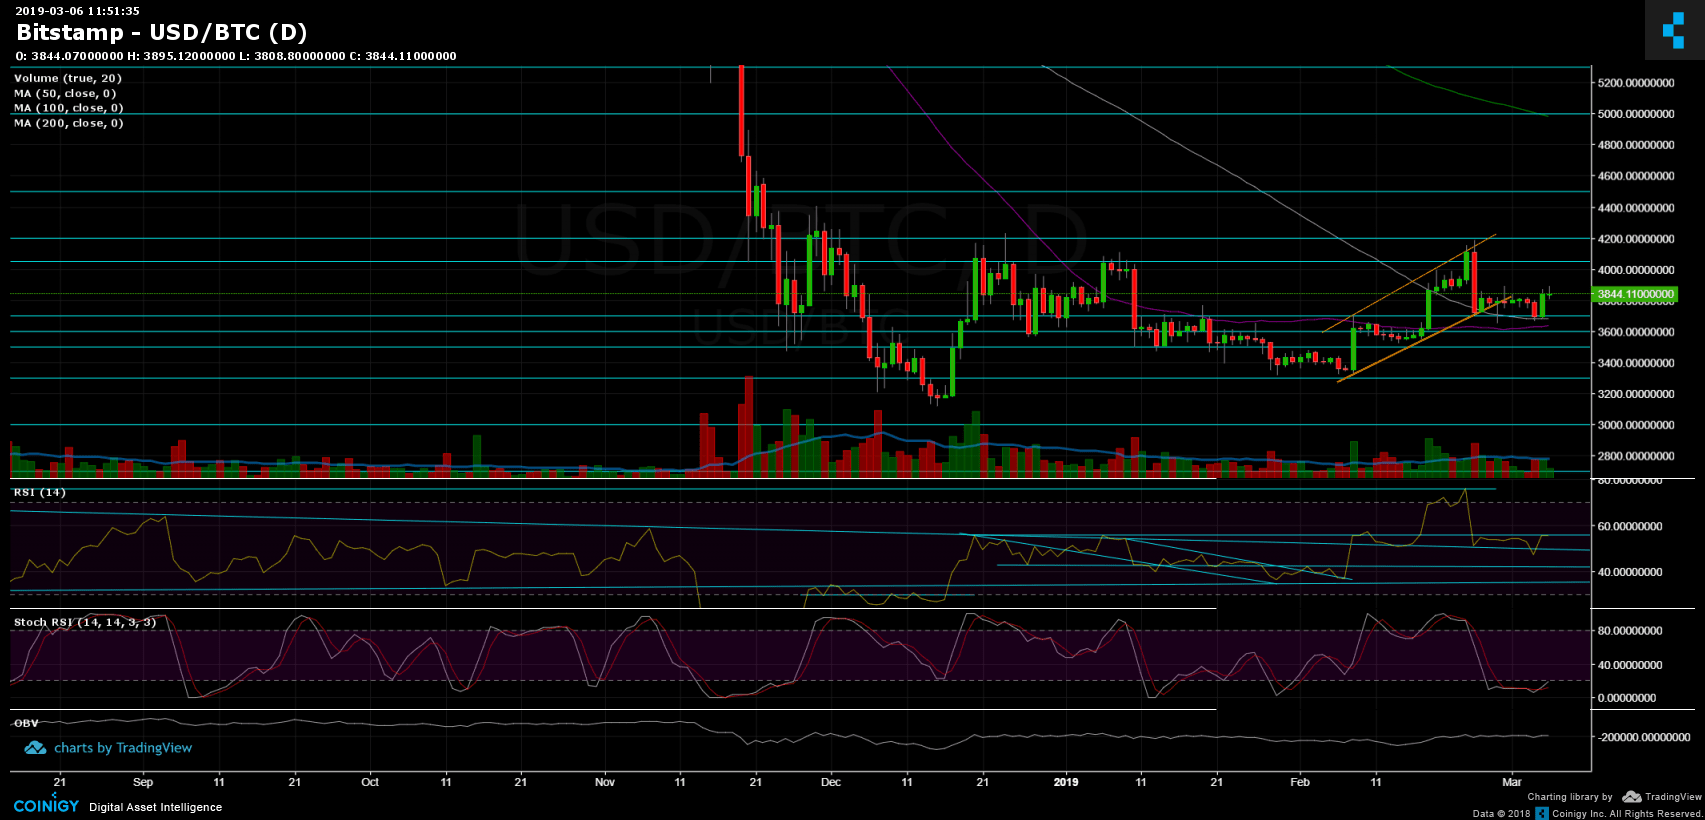
– Support/Resistance: As mentioned, Bitcoin had found support upon the daily 100-days moving average line (marked in white), along with the $3700 support level and quickly gained the $120 drop from earlier this week.
As of now, the coin is trading between the $3800 support level from below, to the resistance at $3850. The next resistance lies at $3950, $4050. From below, support lies at $3700 (along with daily MA-100), $3650 (along with daily MA-50), $3600, and the significant $3480 – $3500 support area.
– The daily chart’s RSI level: It’s incredible how the RSI can tell the whole story. The 56 level is resisting the RSI from breaking up. Recently, the daily Stochastic RSI Oscillator had crossed over at the oversold area, which can fuel bullish moves for the next days.
– The daily trading volume: the volume of the buyers and the sellers’ seem to be identical and not significant. This is another proof that BTC is at a decision point.
– BitFinex open short positions: Following a retest of the 17K support line, there are now 17.9K BTC of open short positions. The shorts number is still between the tight range of 19K BTC resistance from above and the 17K support line (the lowest point since August 2018) from below. This is also a fragile spot.