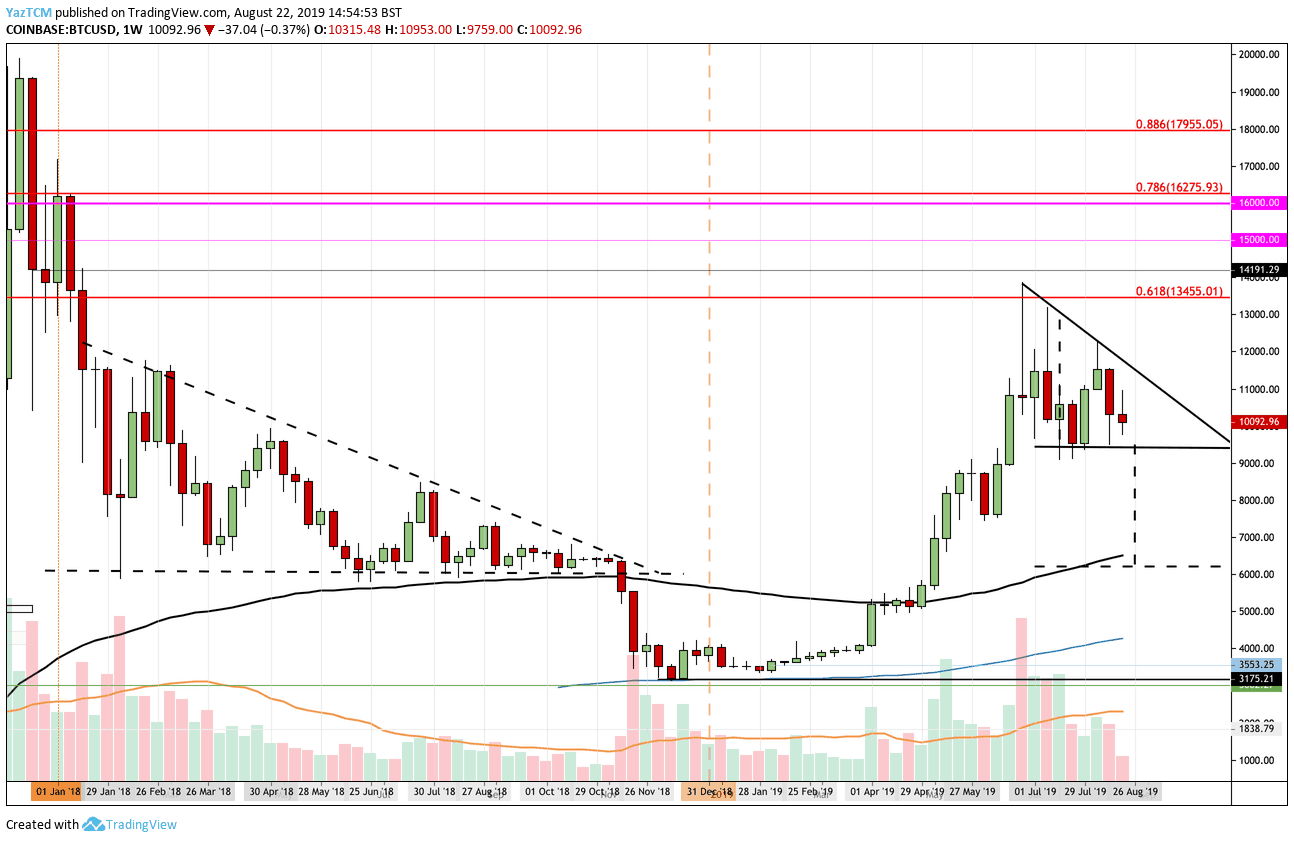
Bitcoin has been on a roller coaster over the past few days, after rebounding at $10,000 only to reach the resistance at $10,800 and rolling over to $10,000, where it is trading now. On the weekly chart, Bitcoin might be forming a descending triangle pattern. This pattern is remarkably similar to the massive descending triangle seen during most of 2018. That was finally broken in the middle of November 2018, igniting the gigantic drop from $6,000 to the 2018 low of $3,120.
BTC 2018 – 2019: The two triangles
Similar Triangles, Different Sizes
Analyzing the weekly chart above, we can see that Bitcoin has been trading within the triangle over the past few months. The Bitcoin price surged between April and June but failed to break above the Fibonacci retracement level at $13,500.
The breakdown of the 2018 triangle resulted in Bitcoin’s price dropping by roughly 45%. Similarly, in the current descending triangle, a breakdown of the bottom of the triangle would technically predict a target of approximately $6,100, which is roughly a 36% price drop. On the other hand, if the bulls can defend the lower boundary of the triangle and push higher to break above its upper boundary, the pattern would be invalidated.
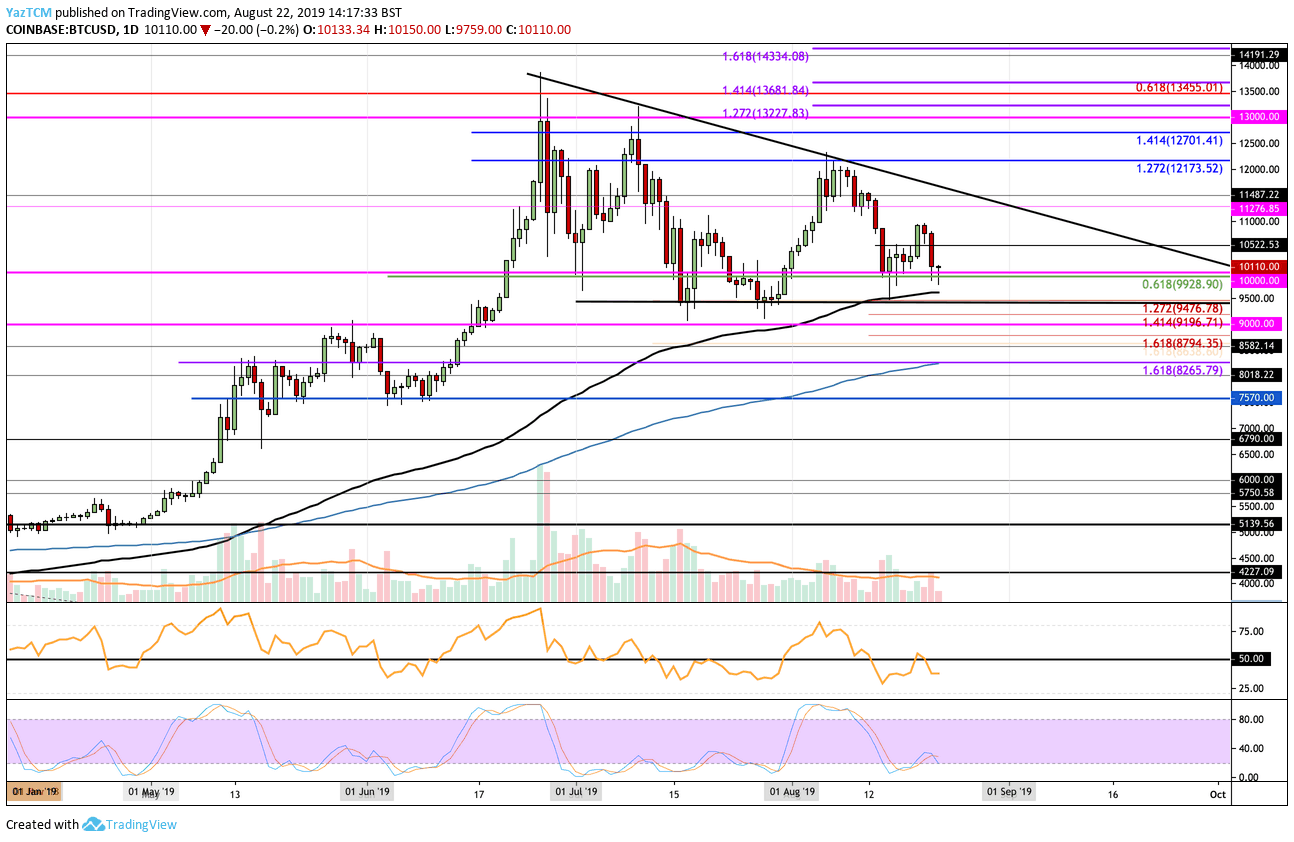
Short-Term Bearish, Long-Term Bullish
Analyzing the daily chart above, we can see that the base of the triangle is located in the $9,400 region. Bitcoin is currently trading at the $10,000 support level as the buyers battle to remain above it. However, it looks to me like the sellers will break beneath it to possibly test the lower boundary of the triangle. Before it can reach the lower boundary, the bears will need to break beneath the support at $9,928 which is the .618 Fibonacci retracement level.
If the sellers can break beneath this level, they will also have to contend with support at the 100-day EMA which is located just slightly below, at the $9,630 level.
The lower boundary is further bolstered by the short-term downside 1.272 Fibonacci extension level. If the sellers break beneath the support at the lower boundary, we can expect further support to be located at $9,196 (the downside 1.414 Fib extension), $9,000 and $8,794.
The technical indicators are all favoring the bearish case at this point in time. The RSI is beneath 50, which indicates that the sellers are in control. However, if the bulls can defend the lower boundary of the triangle, that may be enough to help bring the RSI back above 50.
Even if the price were to return to $6,100, Bitcoin would remain bullish in the longer-term analysis. As long as Bitcoin’s price stays above the $3,000-$4,000 area, the market is still in a long-term uptrend. Overall, Bitcoin has had a great run in 2019 after rising from beneath $4,000 to over $13,800.
SPECIAL OFFER (Sponsored)
LIMITED OFFER 2024 for CryptoPotato readers at Bybit: Use this link to register and open a $500 BTC-USDT position on Bybit Exchange for free!
Disclaimer: Information found on CryptoPotato is those of writers quoted. It does not represent the opinions of CryptoPotato on whether to buy, sell, or hold any investments. You are advised to conduct your own research before making any investment decisions. Use provided information at your own risk. See Disclaimer for more information.
Yaz is a cryptocurrency technical analyst with over seven years of technical analysis trading experience. As an Economics graduate, he has taken a keen interest in the future potentials of blockchain in the financial industry. Removing crypto from the equation, Yaz loves to watch his favorite football team and keep up-to-date with the latest fights within the UFC.