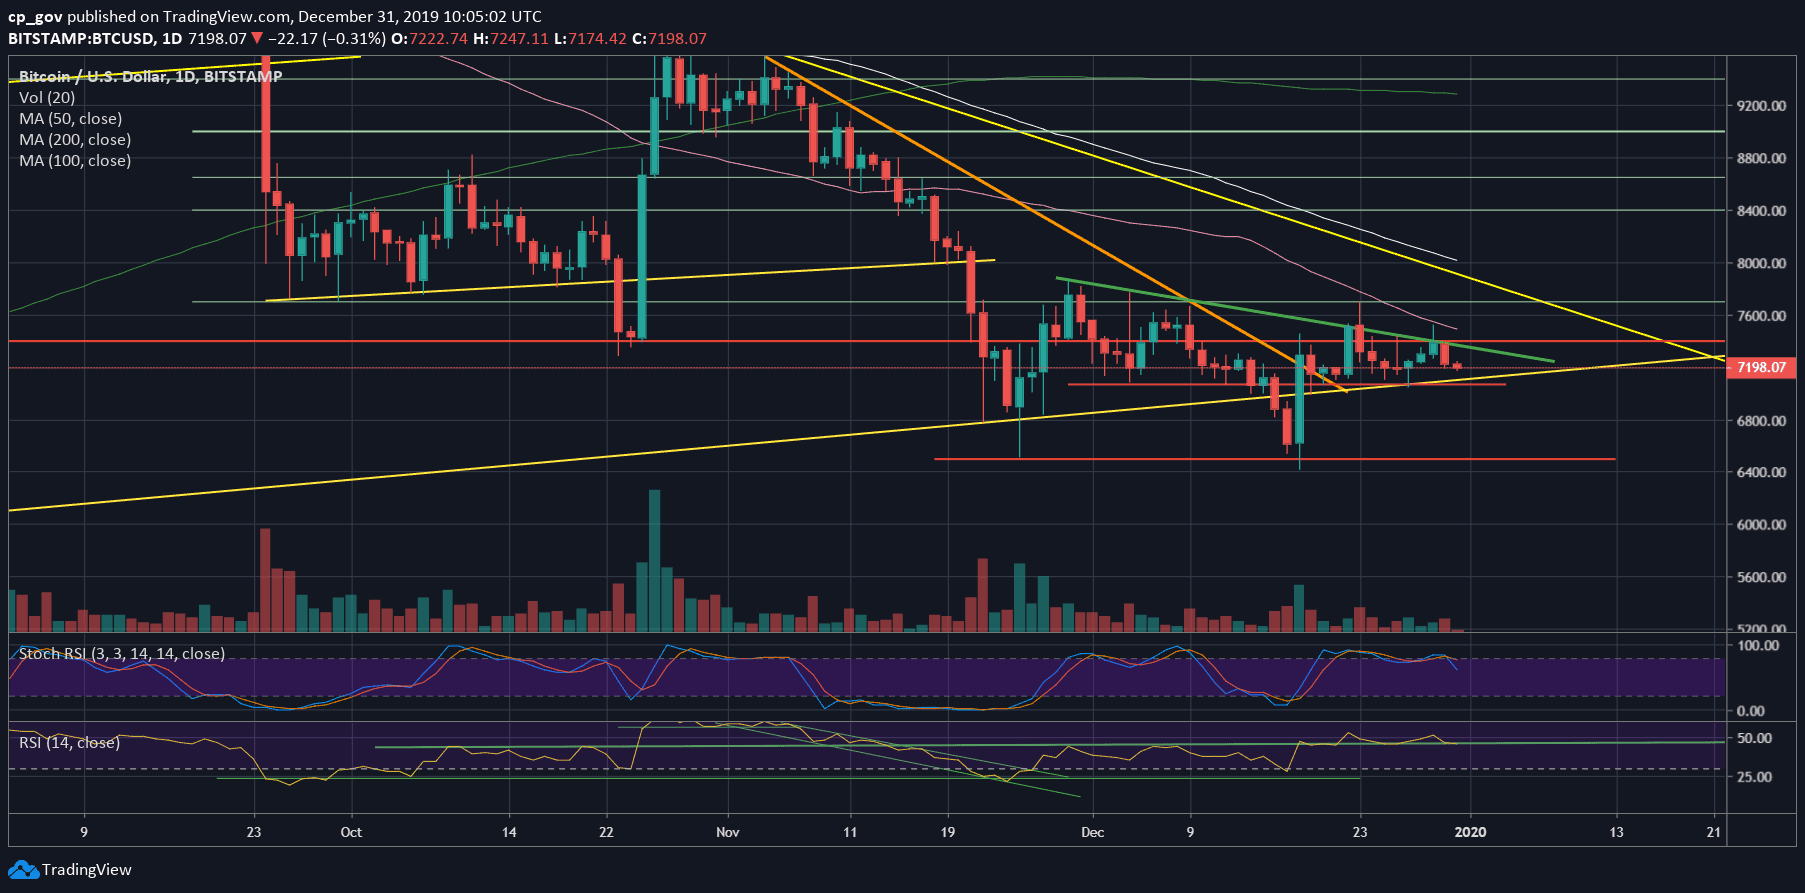
Just a quick update to yesterday’s extended Bitcoin update: Shortly after reaching the significant resistance of the month-old descending trend-line, as of yesterday, Bitcoin got rejected and rapidly lost momentum.
Failing to hold the $7400 and breach the December descending trend-line (marked light green on the following daily chart), had sent Bitcoin below the next support level at $7200. As of writing these lines, Bitcoin is trading slightly above $7200.
Part of the reason could be the left-over CME price gap at $7313, which we mentioned here yesterday. The gap got quickly filled in less than 24 hours.
Overall, the causes don’t matter, and the fact is that Bitcoin failed to breach the upper angle of the bearish triangle, and now facing the $7200 support once again.
Besides, it’s hard to believe that December’s candle will end in green, which is very unfortunate to the Bulls. Bitcoin will need to produce a quick $400 gain in the last few hours of the year.
Total Market Cap: $193.2 billion
Bitcoin Market Cap: $131.8 billion
BTC Dominance Index: 68.2%
*Data by CoinGecko
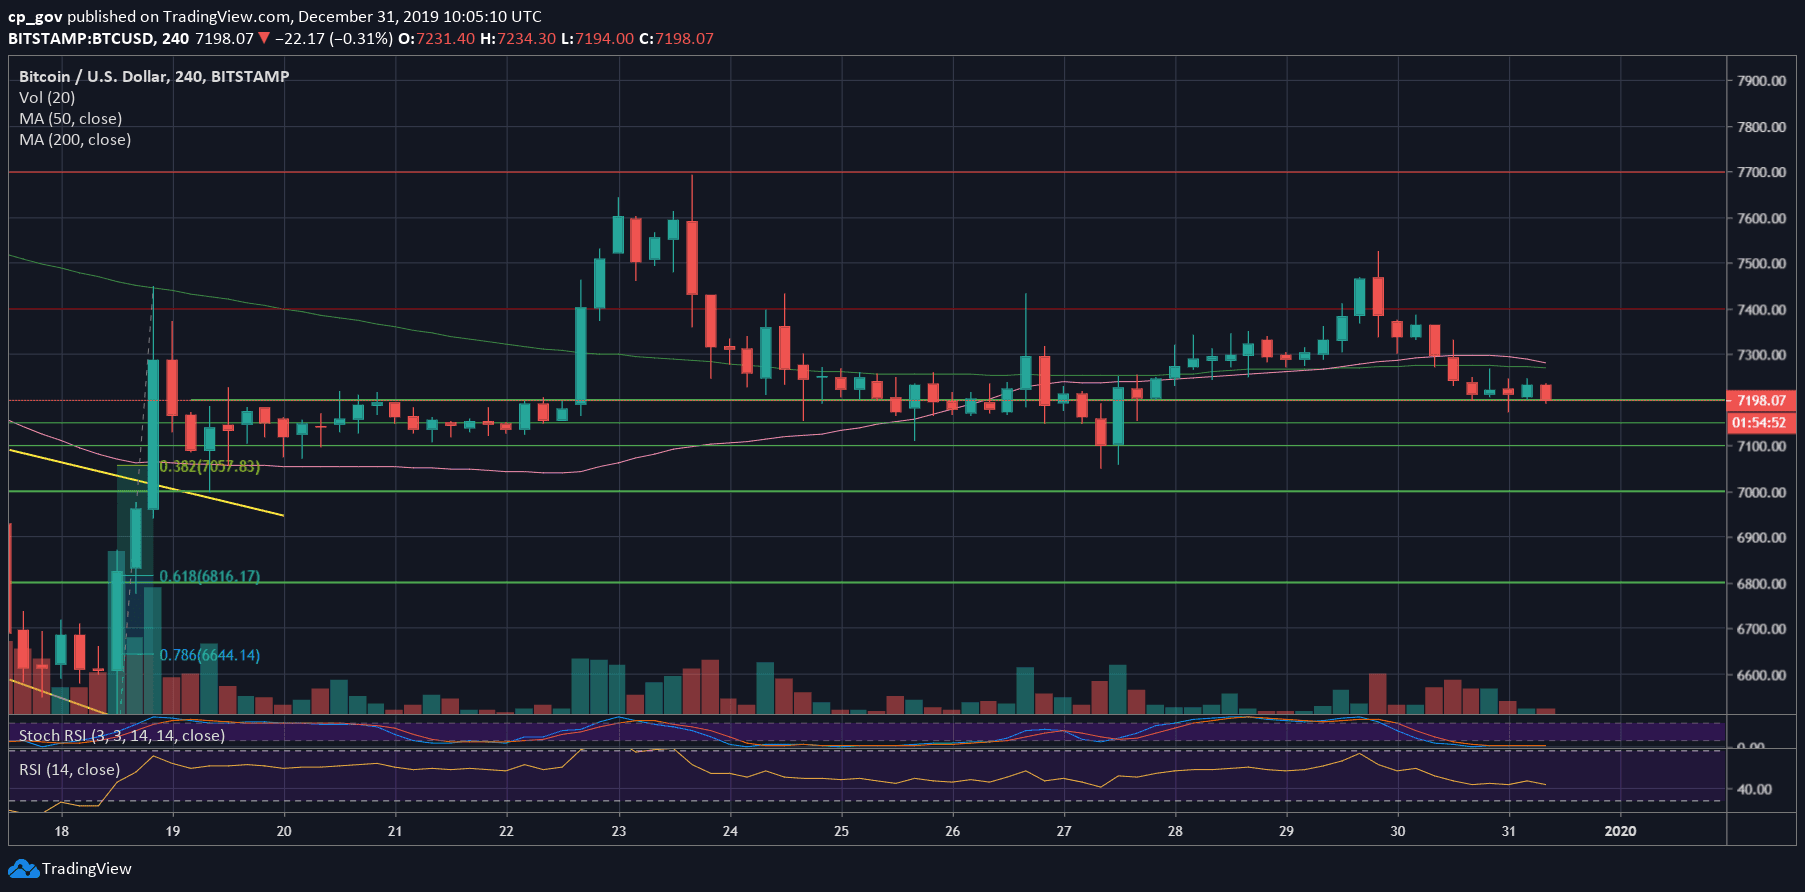
– Support/Resistance: After failing to breach the trend-line, along with the confluence price area of $7300 – $7400, this has now become the first support turned resistance level. This also includes both the 4-hour MA-50 and MA-200 lines (~$7280).
Further above lies the 50-days moving average line (pink), currently around $7520 (the high of yesterday). Higher above lies the $7700 – $7800 resistance area.
From below, the first level of support is the current level of $7200. A little down is the mid-term ascending trend-line. Further below lies $7000 – $7050 support, before $6800 and $6500 – $6600.
– The RSI Indicator: Following the recent price action, the RSI had stopped exactly by the 44-45 horizontal support line. This is a decision point for Bitcoin.
– Trading volume: Yesterday’s volume was average to the last week, and low compared to the monthly average. This can be explained because of the end of the year holidays.