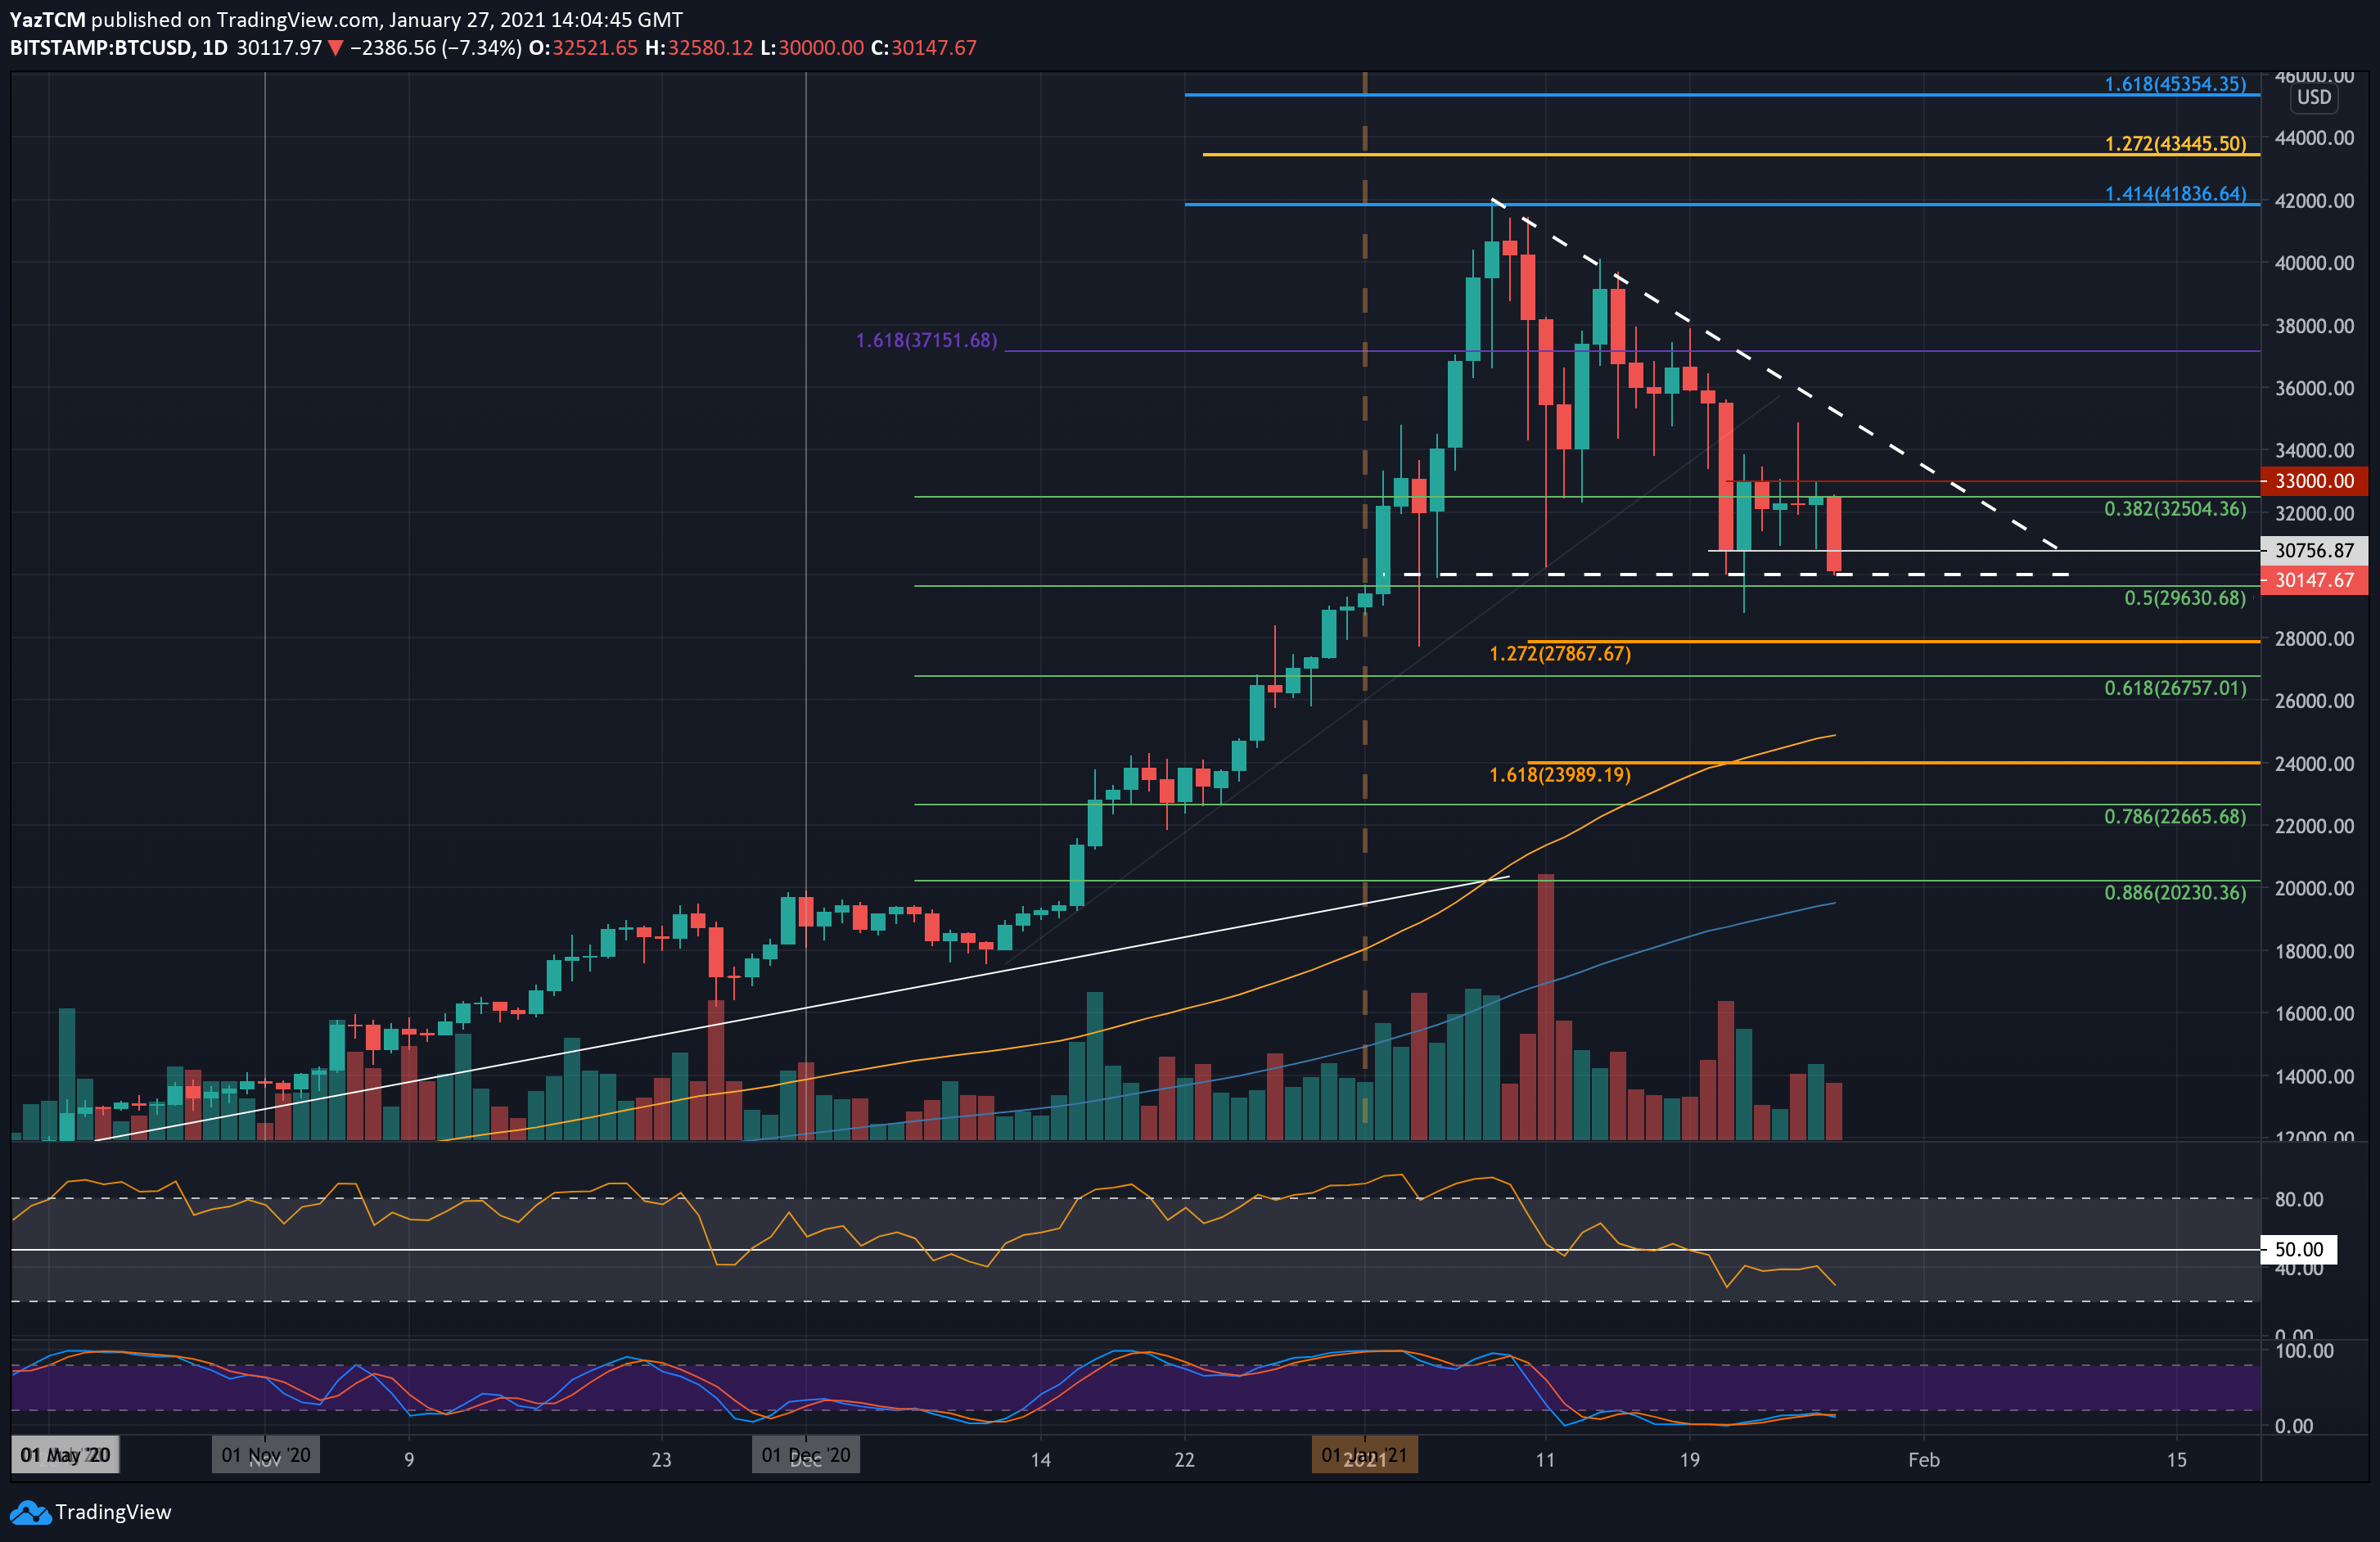
BTC/USD Daily Chart. Source: TradingView
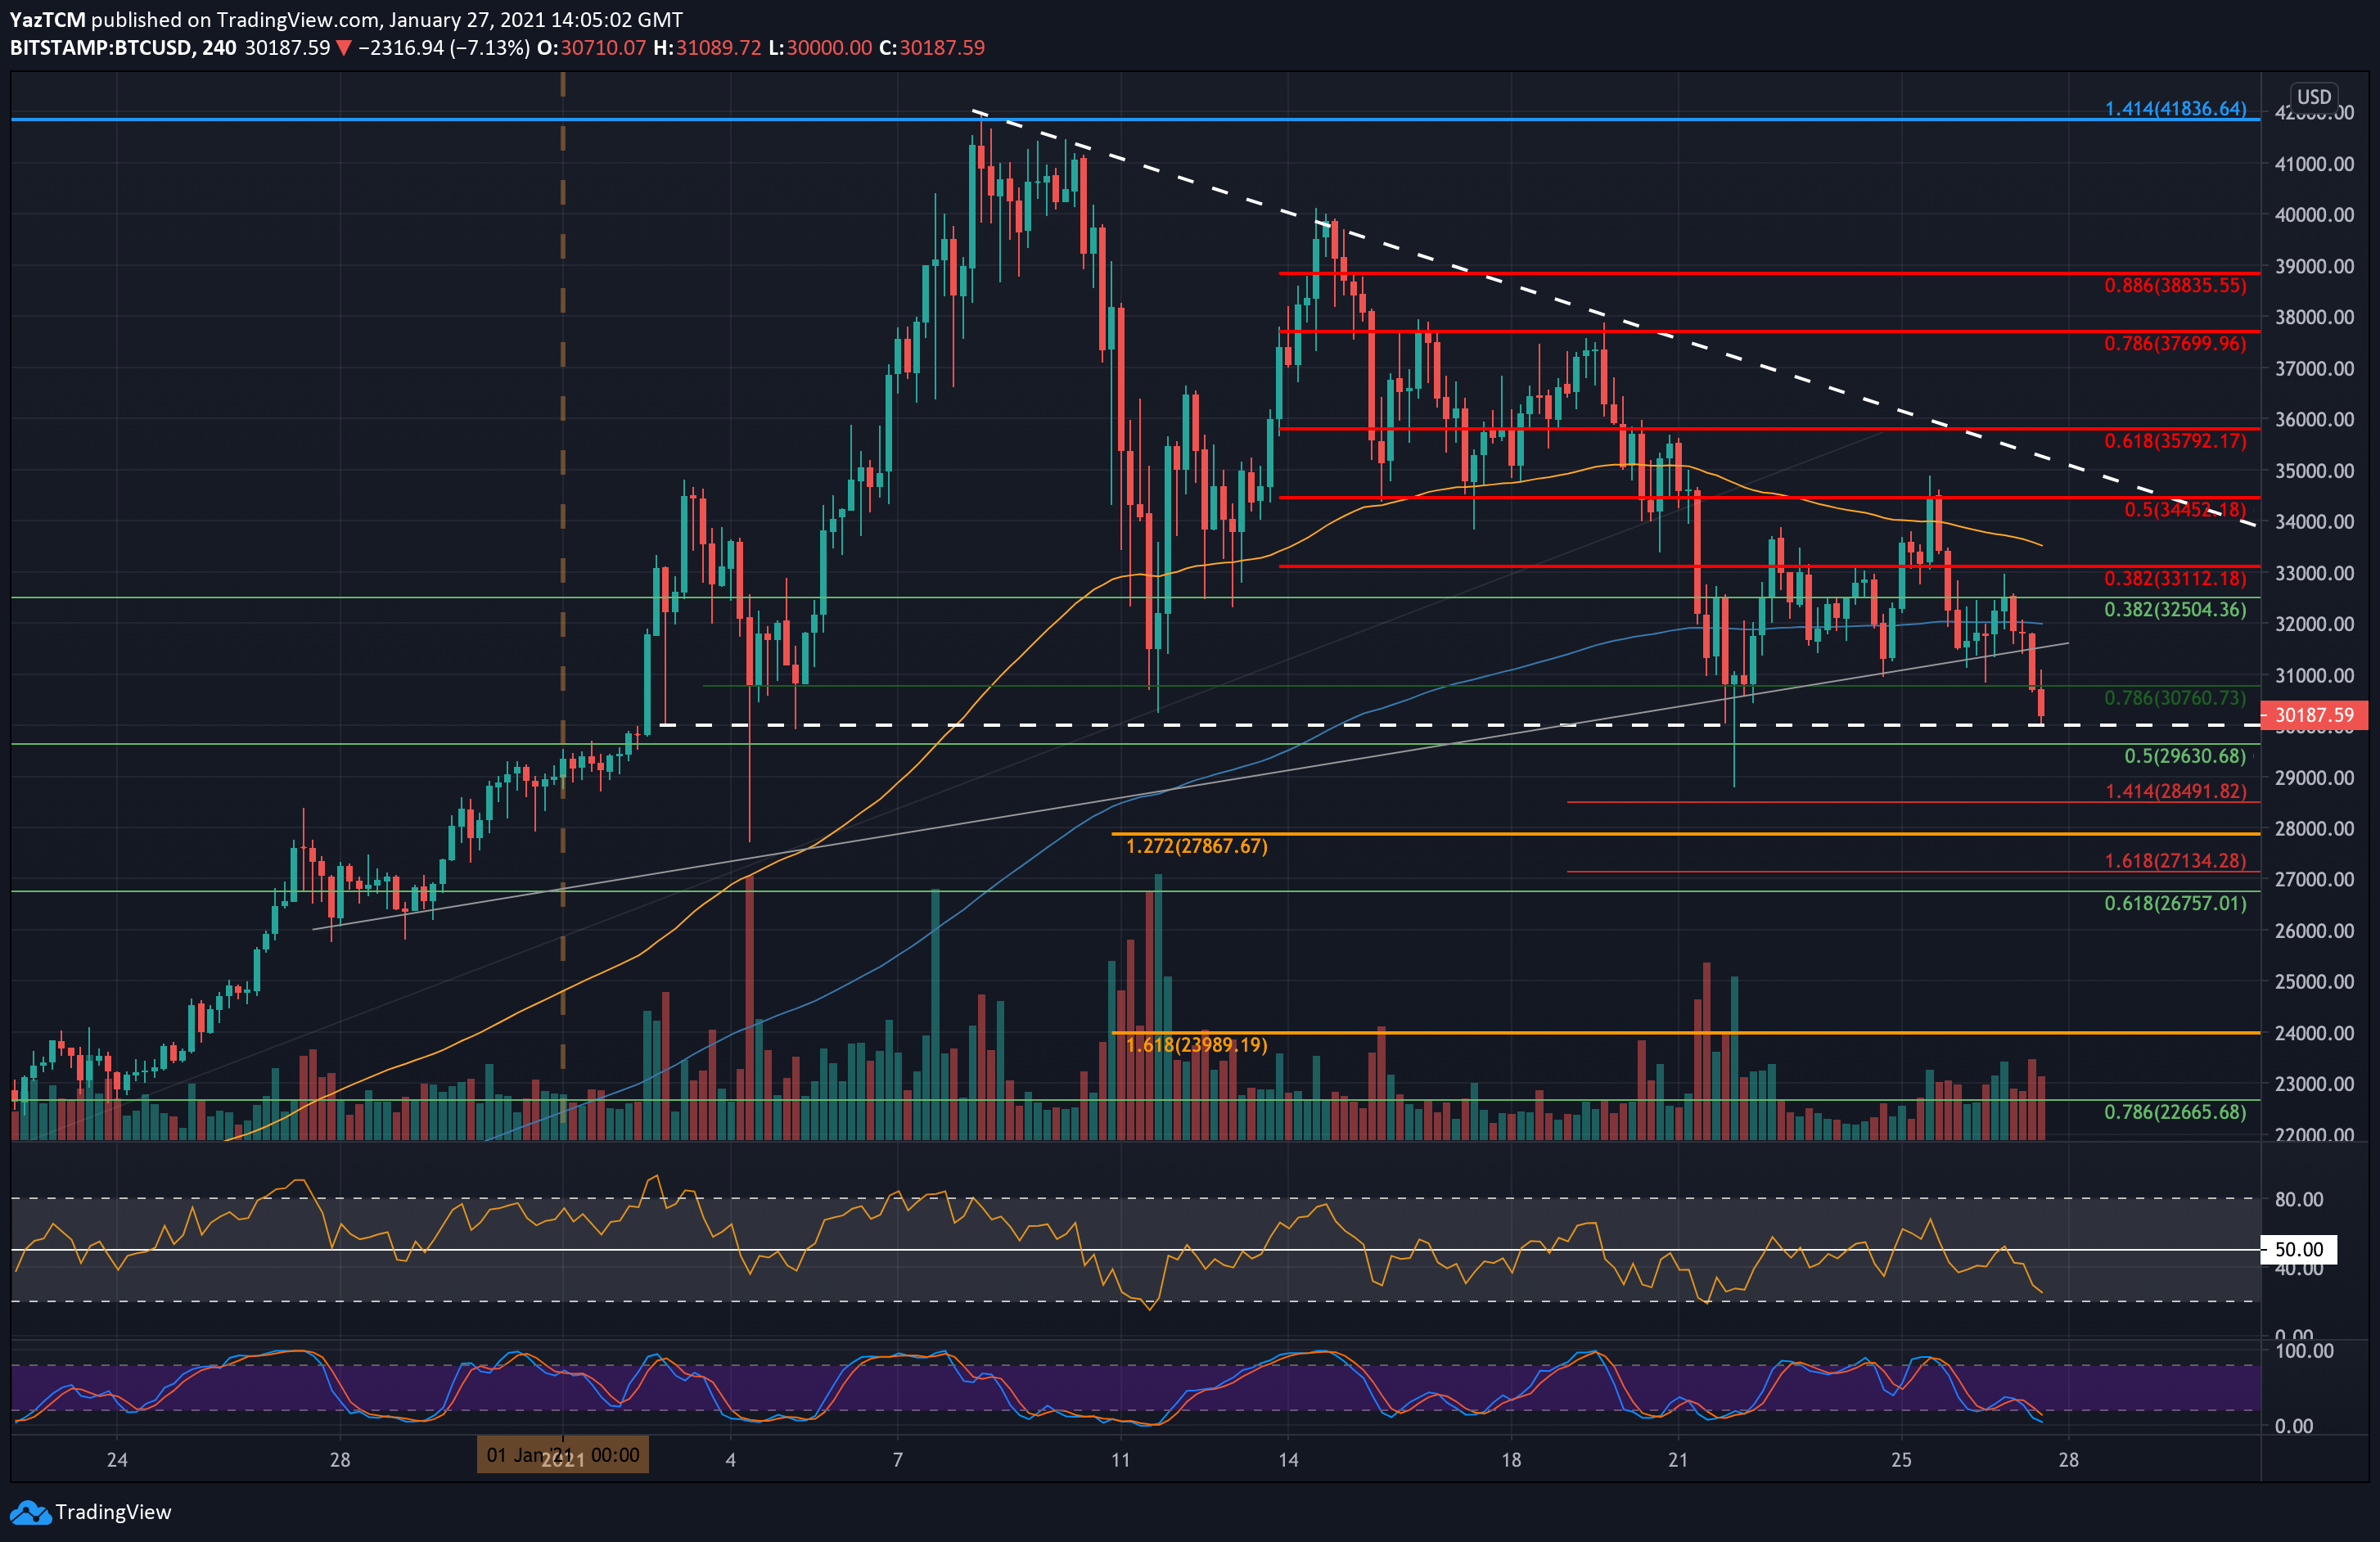
Bitcoin continues its downtrend movement. Today, the BTC is down almost 7% from the opening price of $32,500, according to Bitstamp. The cryptocurrency failed to close a 4-hour candle above that level yesterday and since then, saw only one direction – down.
It eventually plummeted beneath the short-term rising trend line we were tracking over the past few days, which can also be seen as a Head and Shoulders pattern (where the line is served as the neckline). In this case, the target of the H&S is somewhere between $28K – $29K.
Regardless, Bitcoin continued its decline, breaking down the next critical support level at $30,760 (.786 Fib) to hit the current $30,150 level.
If today’s candle closes at current levels, the break of $30,760 marks the end to the previous rangebound trading area between $33,000 and $30,760 that Bitcoin was ‘trapped’ inside for the past six days. However, the daily candle has almost 10 hours more to go.
Looking at the bigger picture, Bitcoin is now facing a critical support mark at $30,000, which forms the base of the descending triangle pattern that it has been consolidating within since recording its all-time high at $42K on January 8 this year. A break beneath this triangle could potentially see Bitcoin plunging toward $28,000 and even $26,000.
Key Support Levels: $30,000, $29,630, $28,500, $28,000, $26,575.
Key Resistance Levels: $30,700, $32,500, $33,100, $34,000,$34,450.
As mentioned above, the first level of support lies at $30,000, which is the base of the bearish triangle pattern, marked on the following daily chart. This is followed by $29,630 (.5 Fib), $28,500 (downside 1.414 Fib Extension), $28,000, and $26,575 (.618 Fib). Further down lies $26,000.
On the other side, the first level of resistance lies at $30,760 (support turned resistance). This is followed by $32,000, $32,500, and $33,100 (bearish .382 Fib). Significant resistance is also found at $34,000 and $34,450 (bearish .5 Fib & upper angle of the descending triangle).
The daily RSI has turned bearish, indicating that the bears are in control. There is still much room to go down, judging by the momentum indicator.