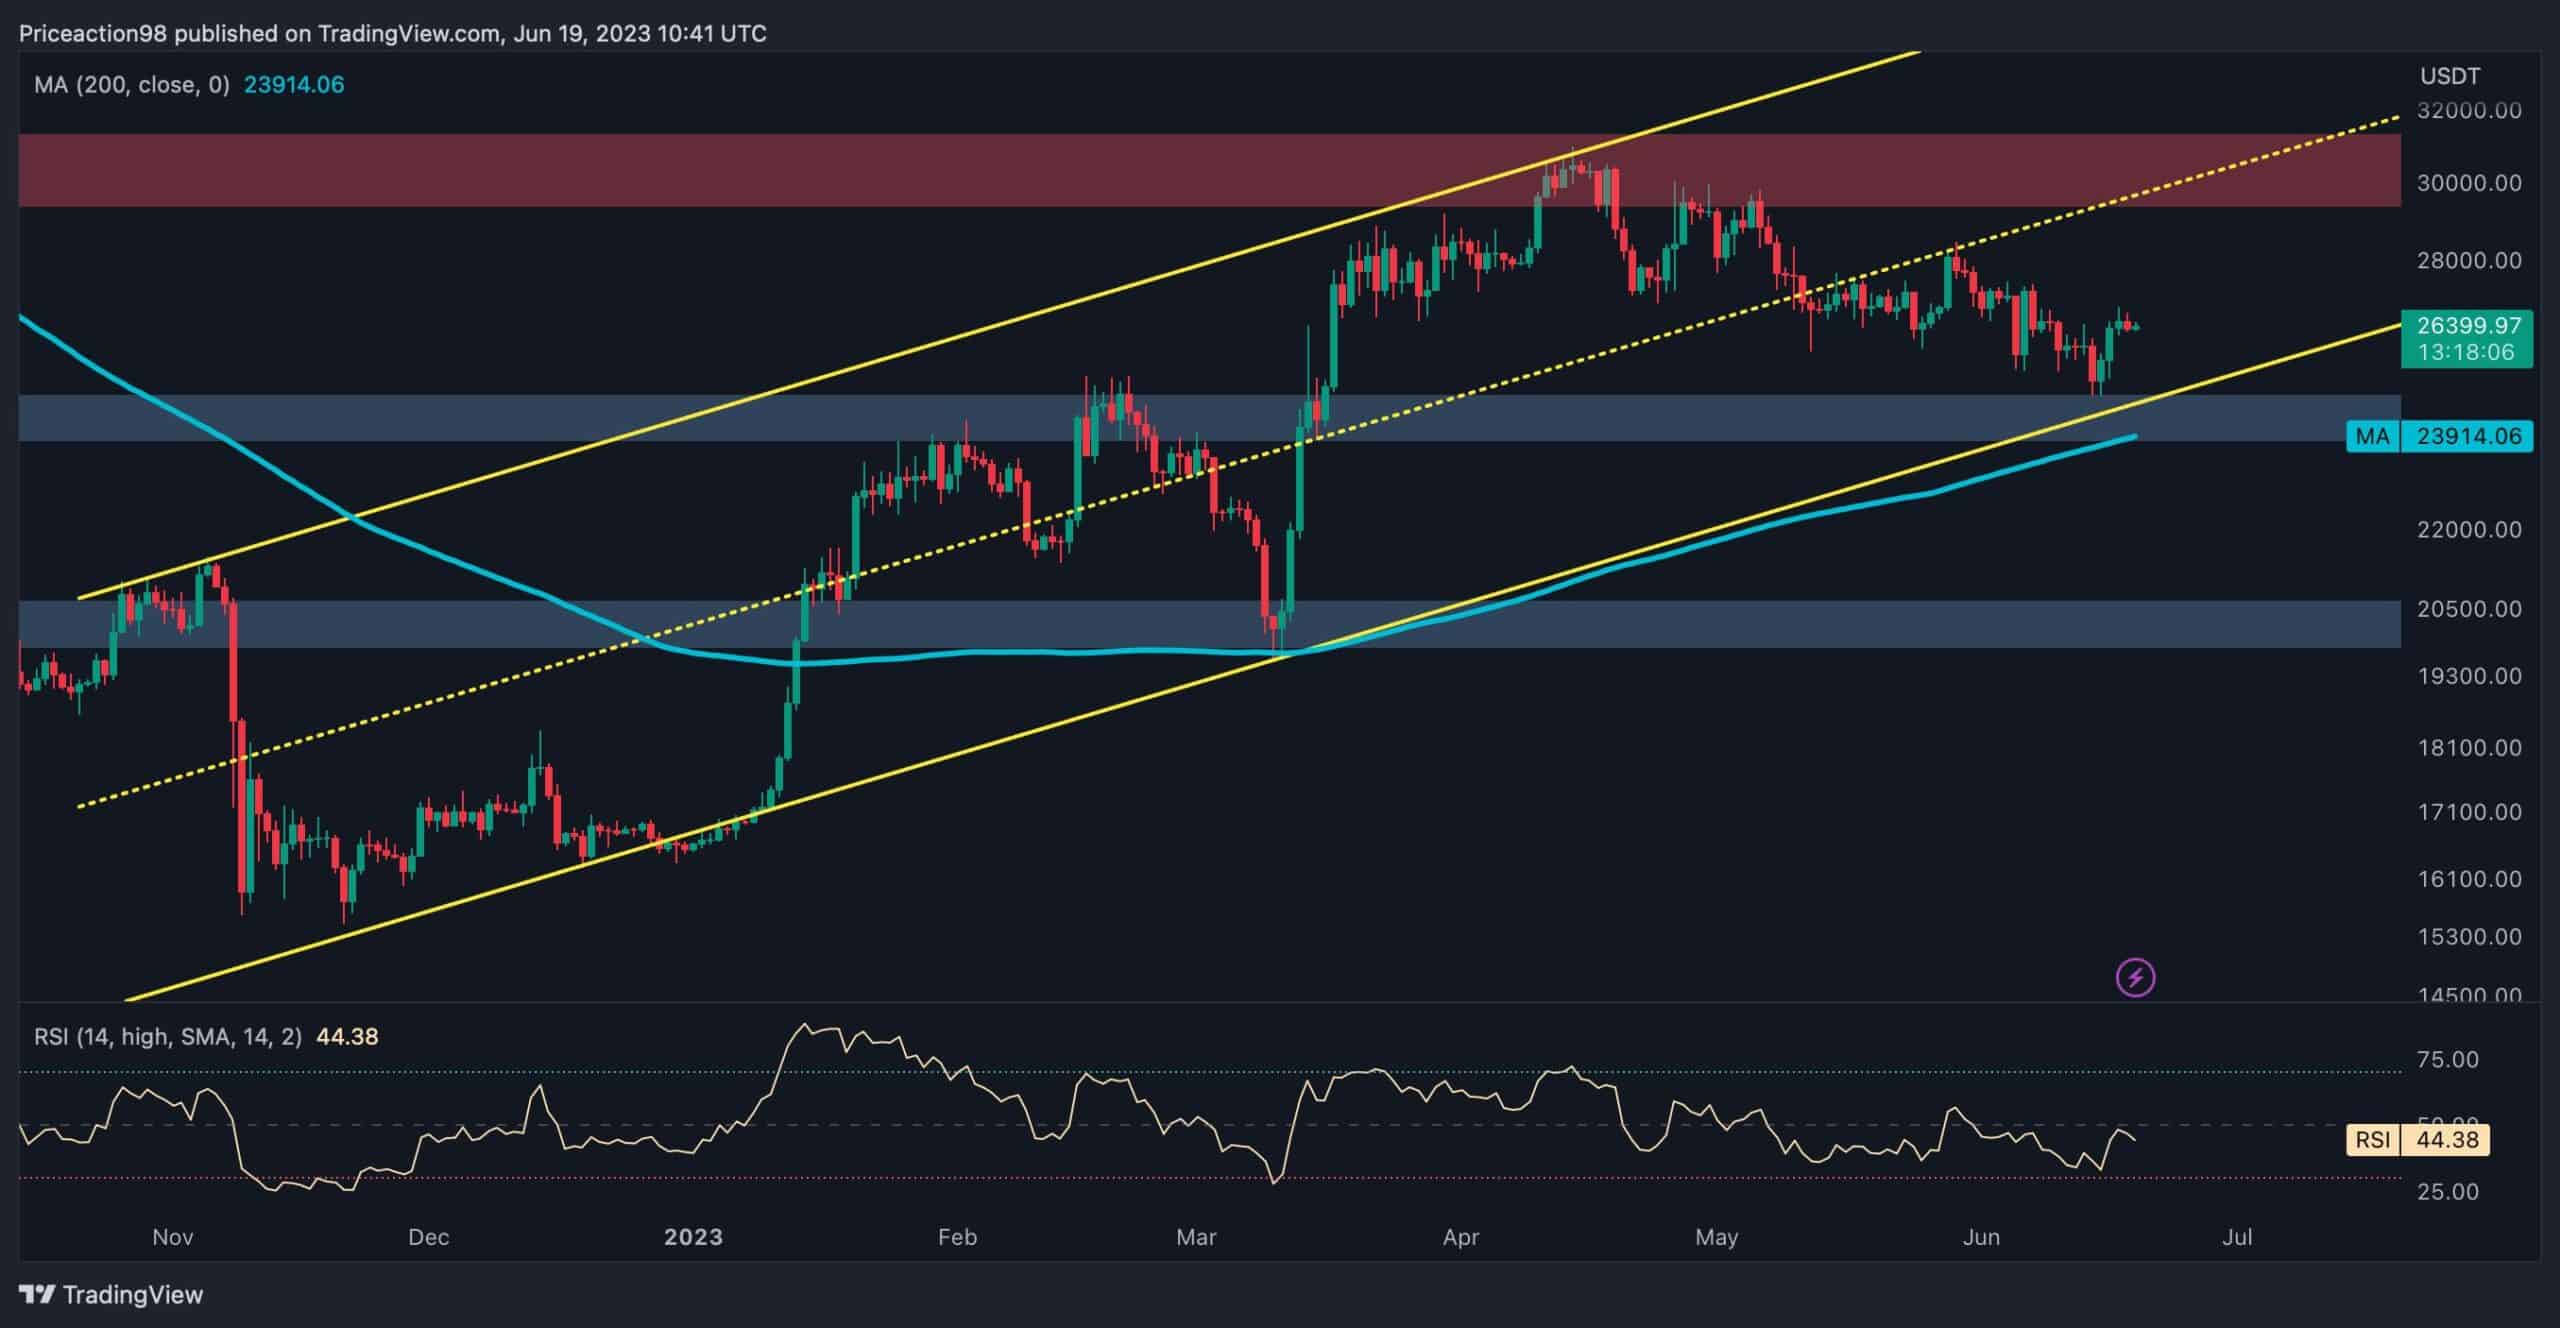
Bitcoin’s price has reached a significant support region, including the lower boundary of the ascending channel and the static support zone of $25K, which also aligns with its prior major swing formed back on February 19th. The price is expected to receive outstanding support in this region, as the buying pressure seems high.
By Shayan
After an extended consolidation correction stage, Bitcoin’s price started to plummet slightly and experienced a 20% decline (from the $31K yearly high to the recent swing low of $24.8K).
However, following the correction legs, the price has reached significant psychological support at $25K alongside the channel’s lower trendline.
However, an impulsive bearish rally might occur if the price drops below this region, as the selling pressure might substantially increase. Nonetheless, it should be noted that the 200-day moving average, robust support for the price, is currently situated below the channel’s lower boundary, approximately at $23.9K, and might hold Bitcoin from a further decline.
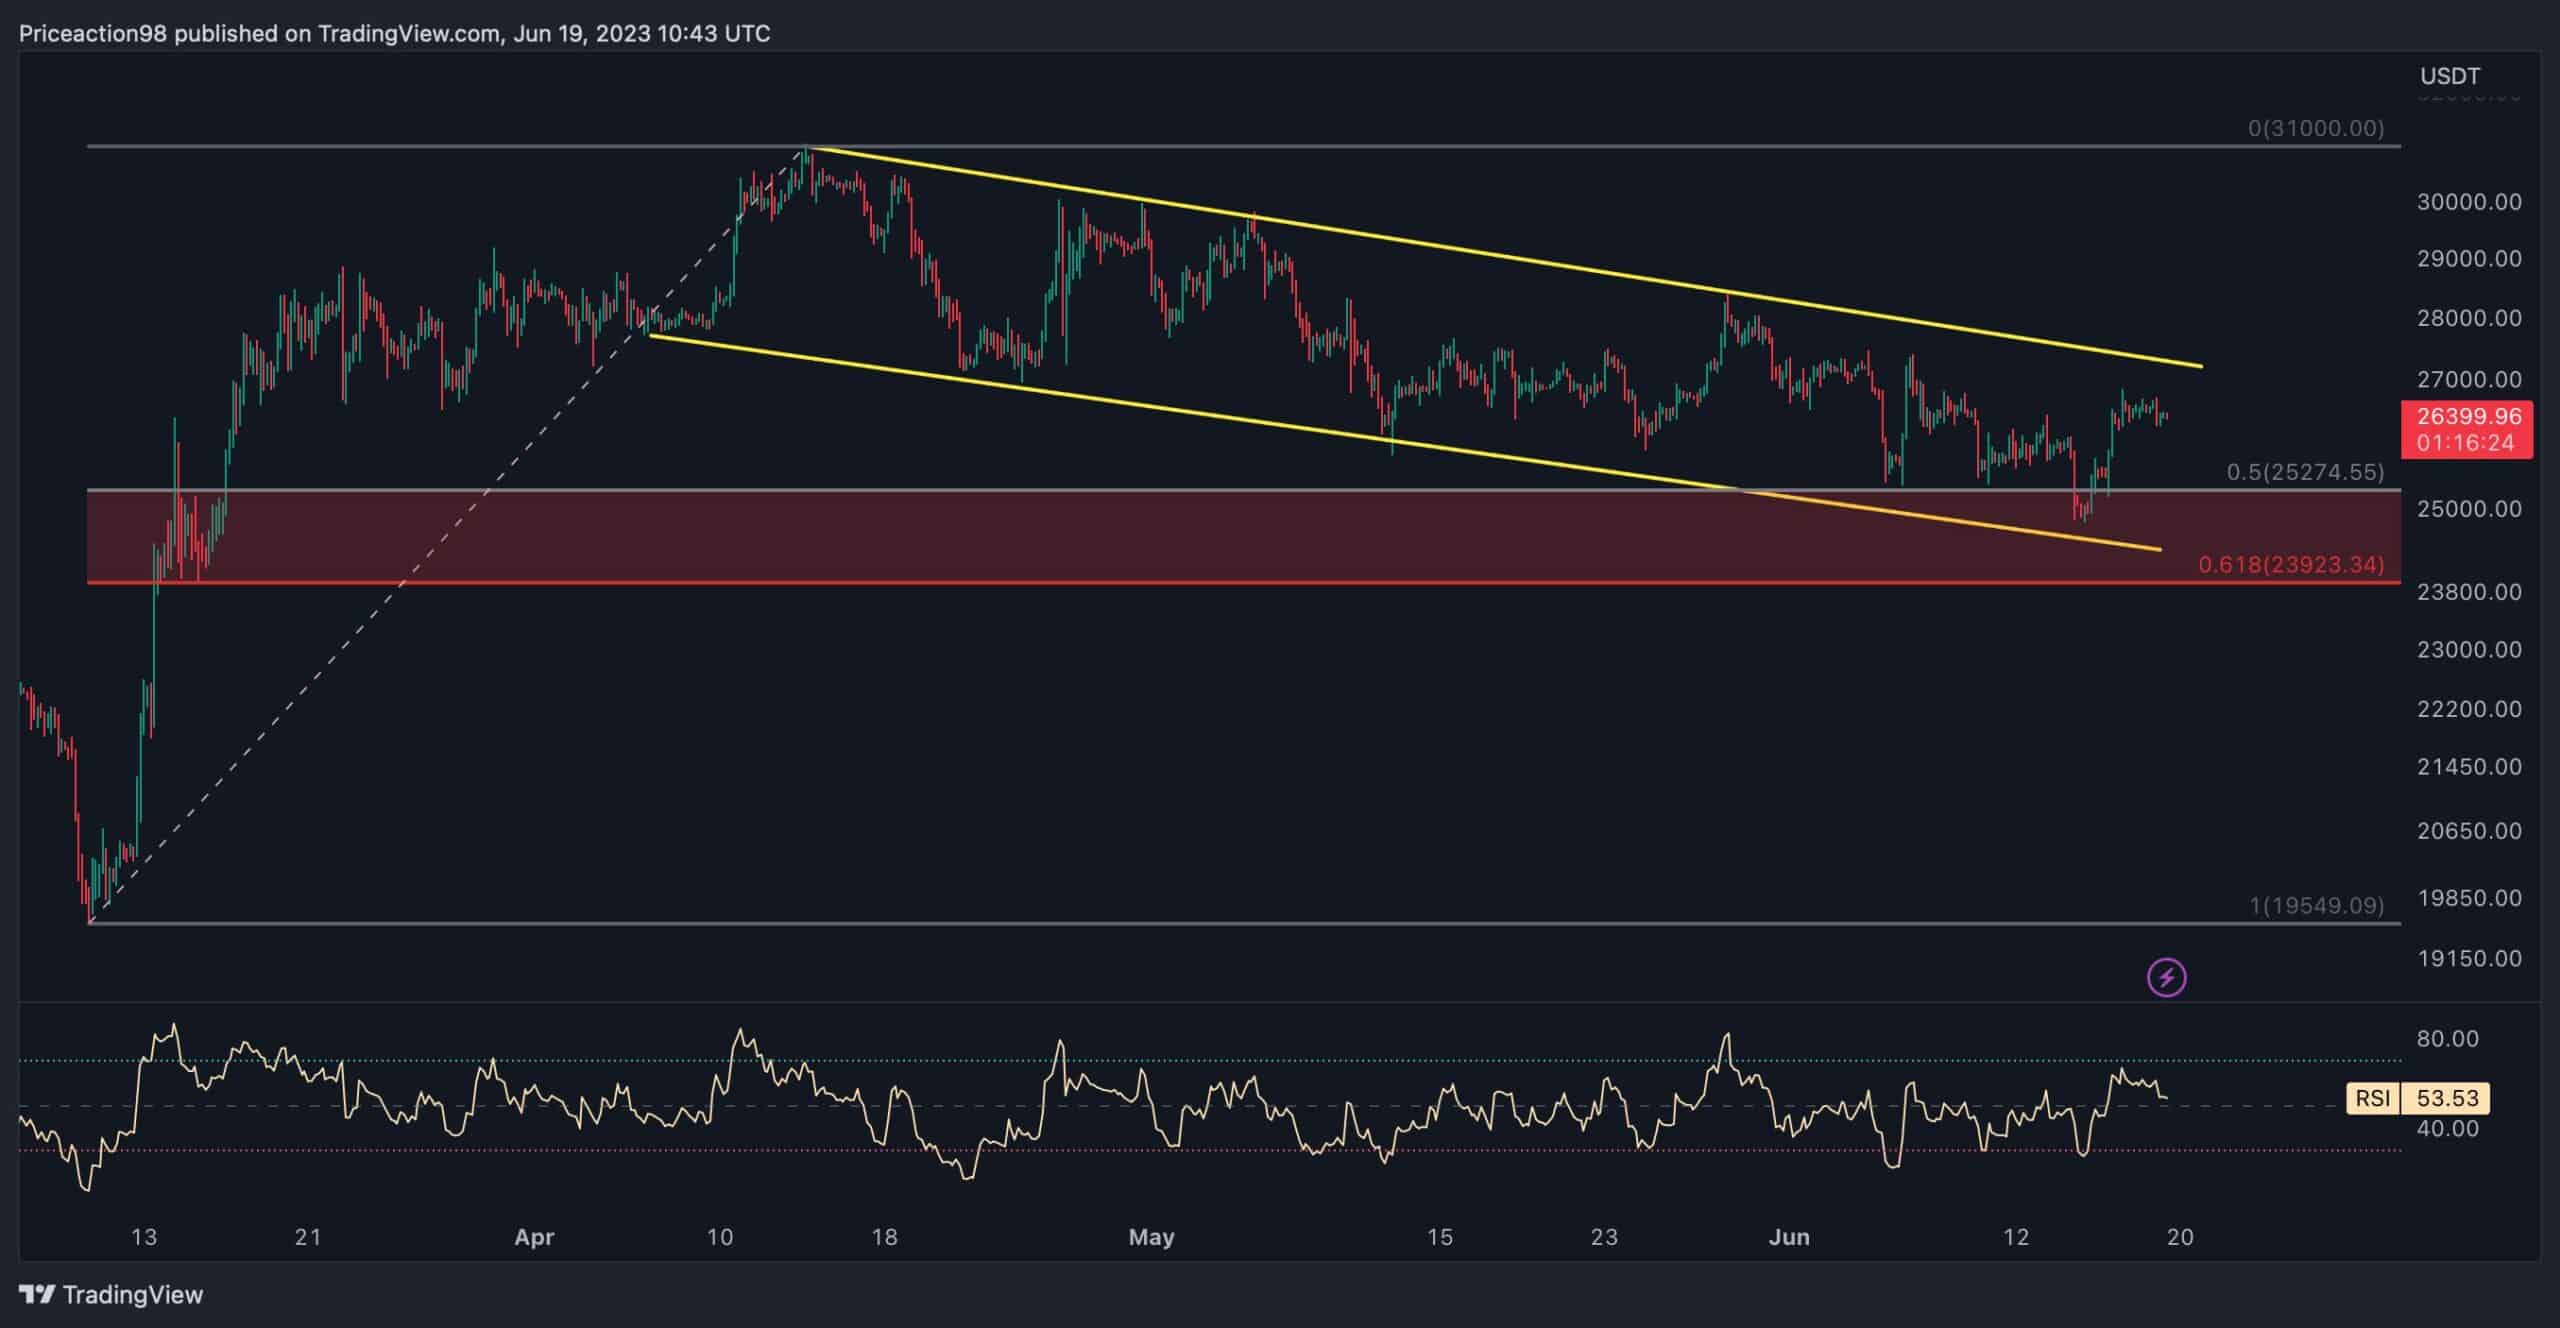
Bitcoin’s price has developed a descending channel since it was rejected from the $31K region and started plunging. Most recently, during the downtrend, it reached the channel’s lower trendline, standing at $24.7K, and found support.
On the other hand, the 61.8%-50% Fibonacci range also aligns with the lower trendline, providing strong support. As a result, Bitcoin has experienced a reversal and initiated an impulsive bullish rally.
Currently, the price is attempting to break above the channel’s upper threshold, sitting at $27K, and if the breakout succeeds, the bullish rally will become imminent. Therefore, Bitcoin’s next stop might be the substantial resistance region of $30K in this scenario.
By Shayan
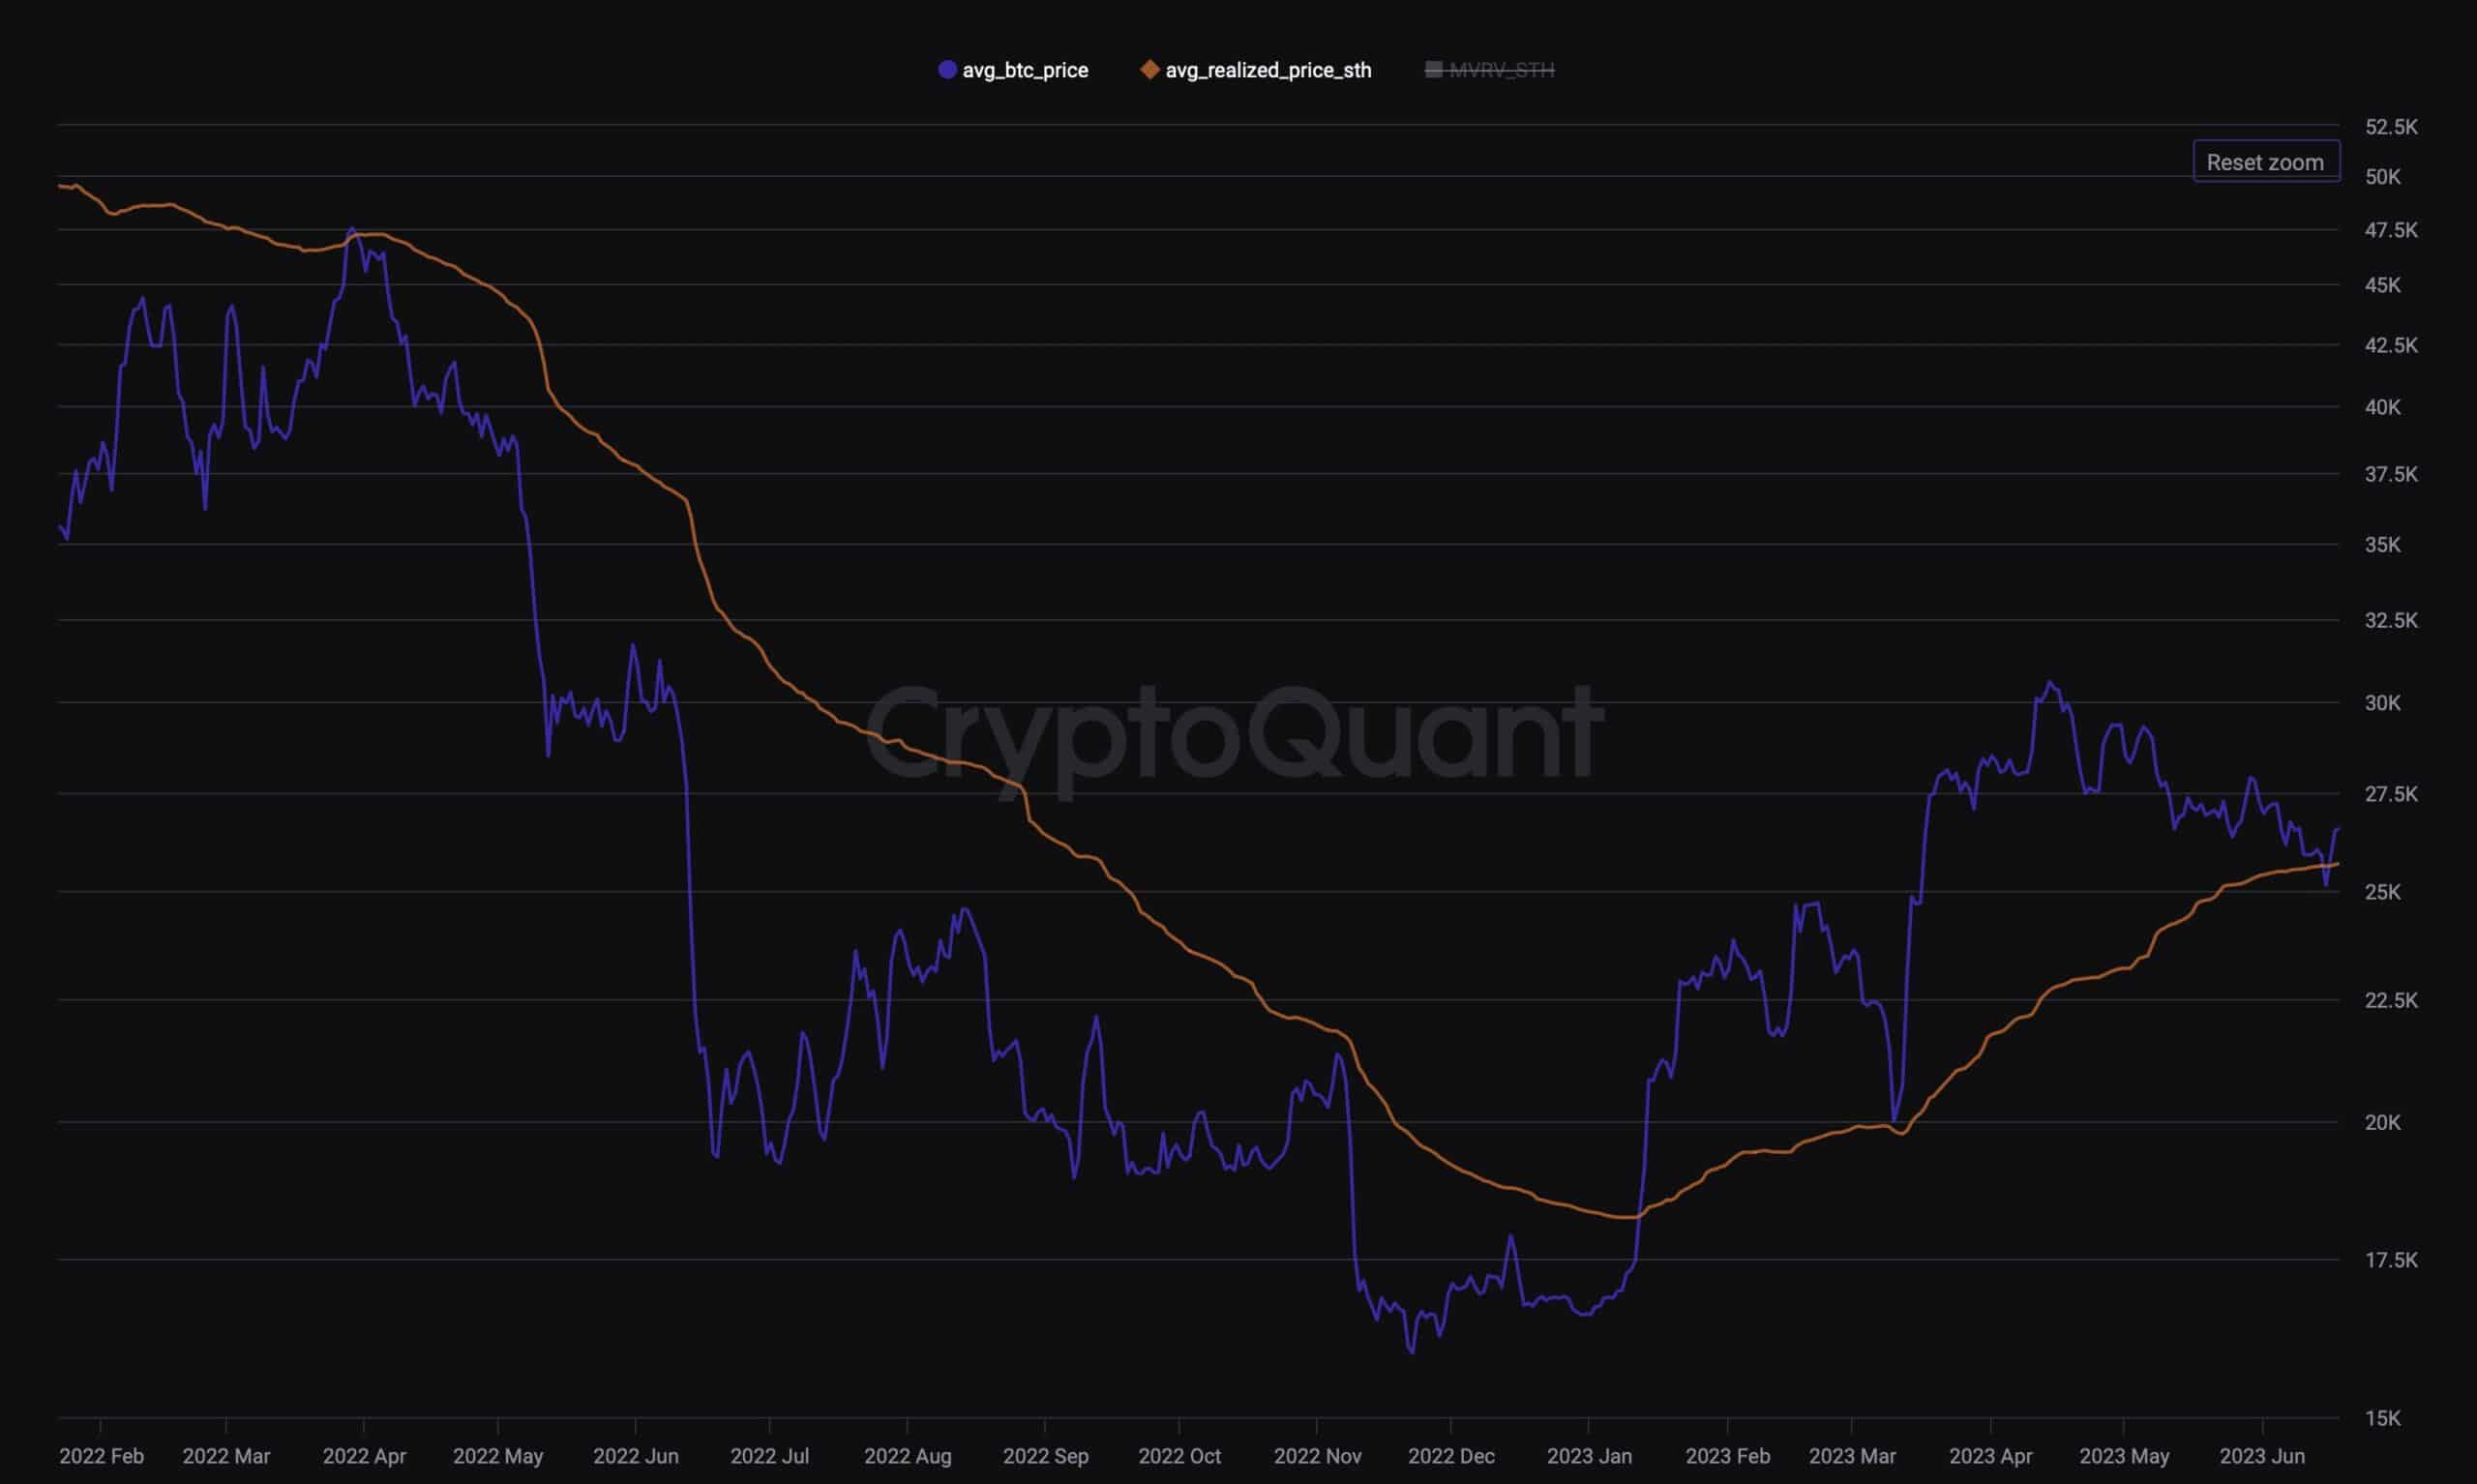
The Realized Price chart for short-term holders is a valuable and helpful on-chain metric for Bitcoin. It has historically acted as both support and resistance.
Recently, an interesting development occurred when Bitcoin dipped below the average purchase price of short-term holders. This situation could potentially have prompted those holders to sell their BTC once they broke even.
However, contrary to expectations, short-term holders saw this as an opportunity to accumulate BTC relatively cheaply, resulting in an increase. Consequently, the cryptocurrency has now broken above the Realized Price of Short-Term Holders.
As long as this level continues to act as support, the cryptocurrency might explore higher levels. The market owes this positive outcome to the actions of short-term holders who took advantage of the opportunity to purchase Bitcoin at a discounted rate.