This was expected. Following a phenomenal week in which the price of Bitcoin rose from $9,000 to almost $14,000 without stopping, Bitcoin bears stopped the train, at least for now.
In a session of violent drops, Bitcoin claimed nearly $11,200 as its new low. Is this a change of momentum? Is the bear market here again? In my opinion, no. Corrections are part of the way up, as mentioned previously, especially to do so in a healthy way.
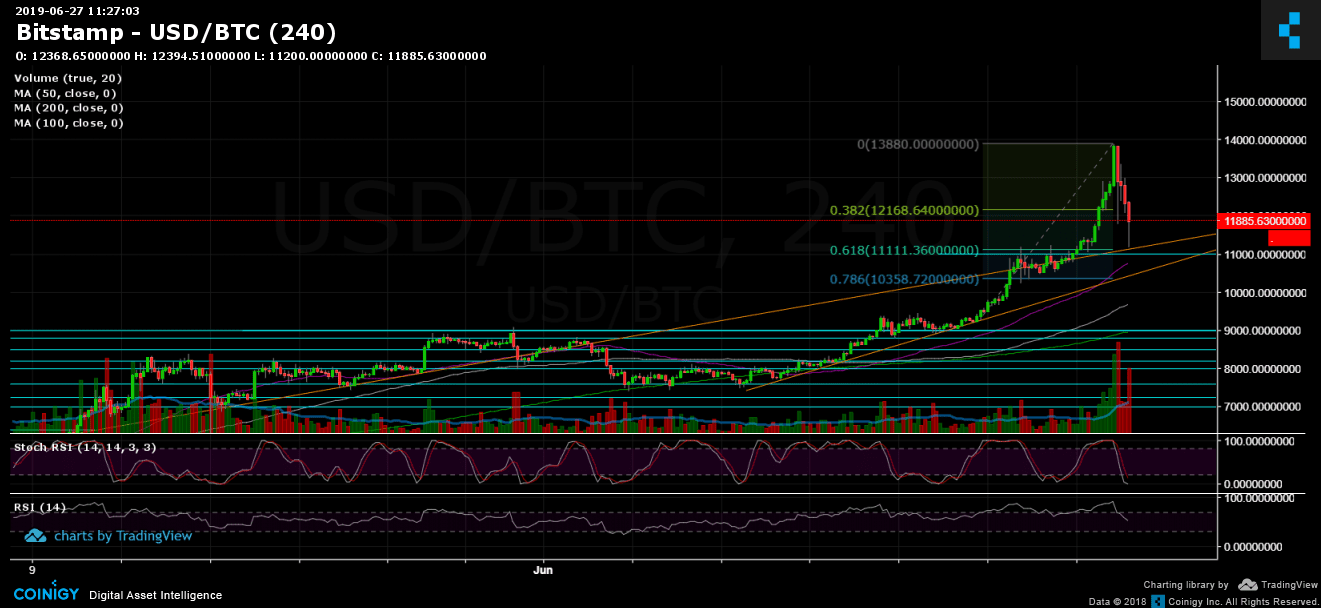
As can be seen on the 4-hour chart, Bitcoin ended its bloodbath at the significant 61.8% Fibonacci retracement level, along with the mid-term ascending trend line (marked in orange). As long as the bottom remains there, the bulls can’t complain, in my opinion.
Support/Resistance: Bitcoin’s price fell all the way to the $11,200 level. Yes, that was the recent resistance/high from days ago. If Bitcoin breaks further down, the bears should expect to see it retest the $10,600 support level before reaching the $10,000 level which was quickly and easily broken on the way up. Further below lie $9,800 and $9,400.
From above, Bitcoin again faces the $12,000 – $12,170 area (38.2% Fib retracement level) as its closest resistance zone. The next level is around $12,500 followed by $13,000. Breaking the recent 2019 high at $13,880 (along with the $14,000 area) would likely send Bitcoin to the $15,000 zone since there is not much resistance along the way, including the next targets of $16,400 – $16,650, $17,400 (the high from January 7, 2018), $18,000, $19,300 and $20,000 – the current all-time high from December 2017.
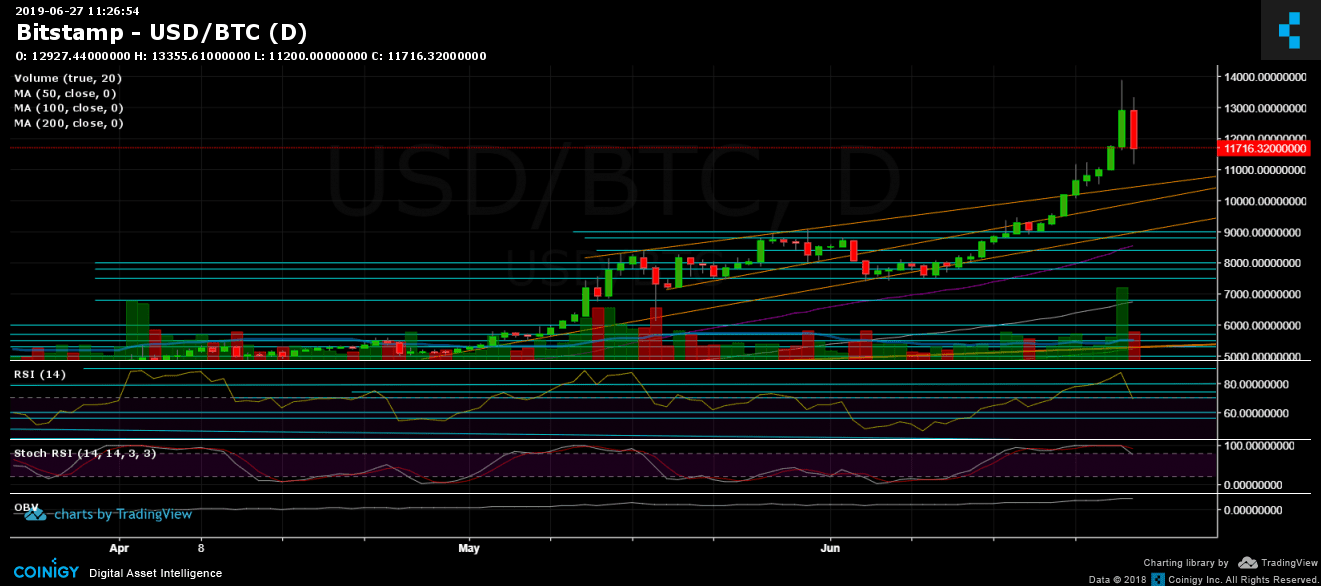
Daily chart RSI: After reaching the overbought area and the aforementioned resistance from yesterday in the 88 – 90 RSI area, the correction came, and the RSI dropped sharply to the support area at 68, still on the bullish side. Every time Bitcoin reaches that RSI level, a severe correction takes place.
Trading Volume: This was probably one of the most significant volume days for Bitcoin. Bitmex, which is leading the Bitcoin margin trading volume chart, saw an all-time high volume day.
Bitfinex open short positions: After the amount of shorts climbed to a monthly high at 29.7K BTC, the price correction reduced the number a bit to a current amount of 29.2K BTC.