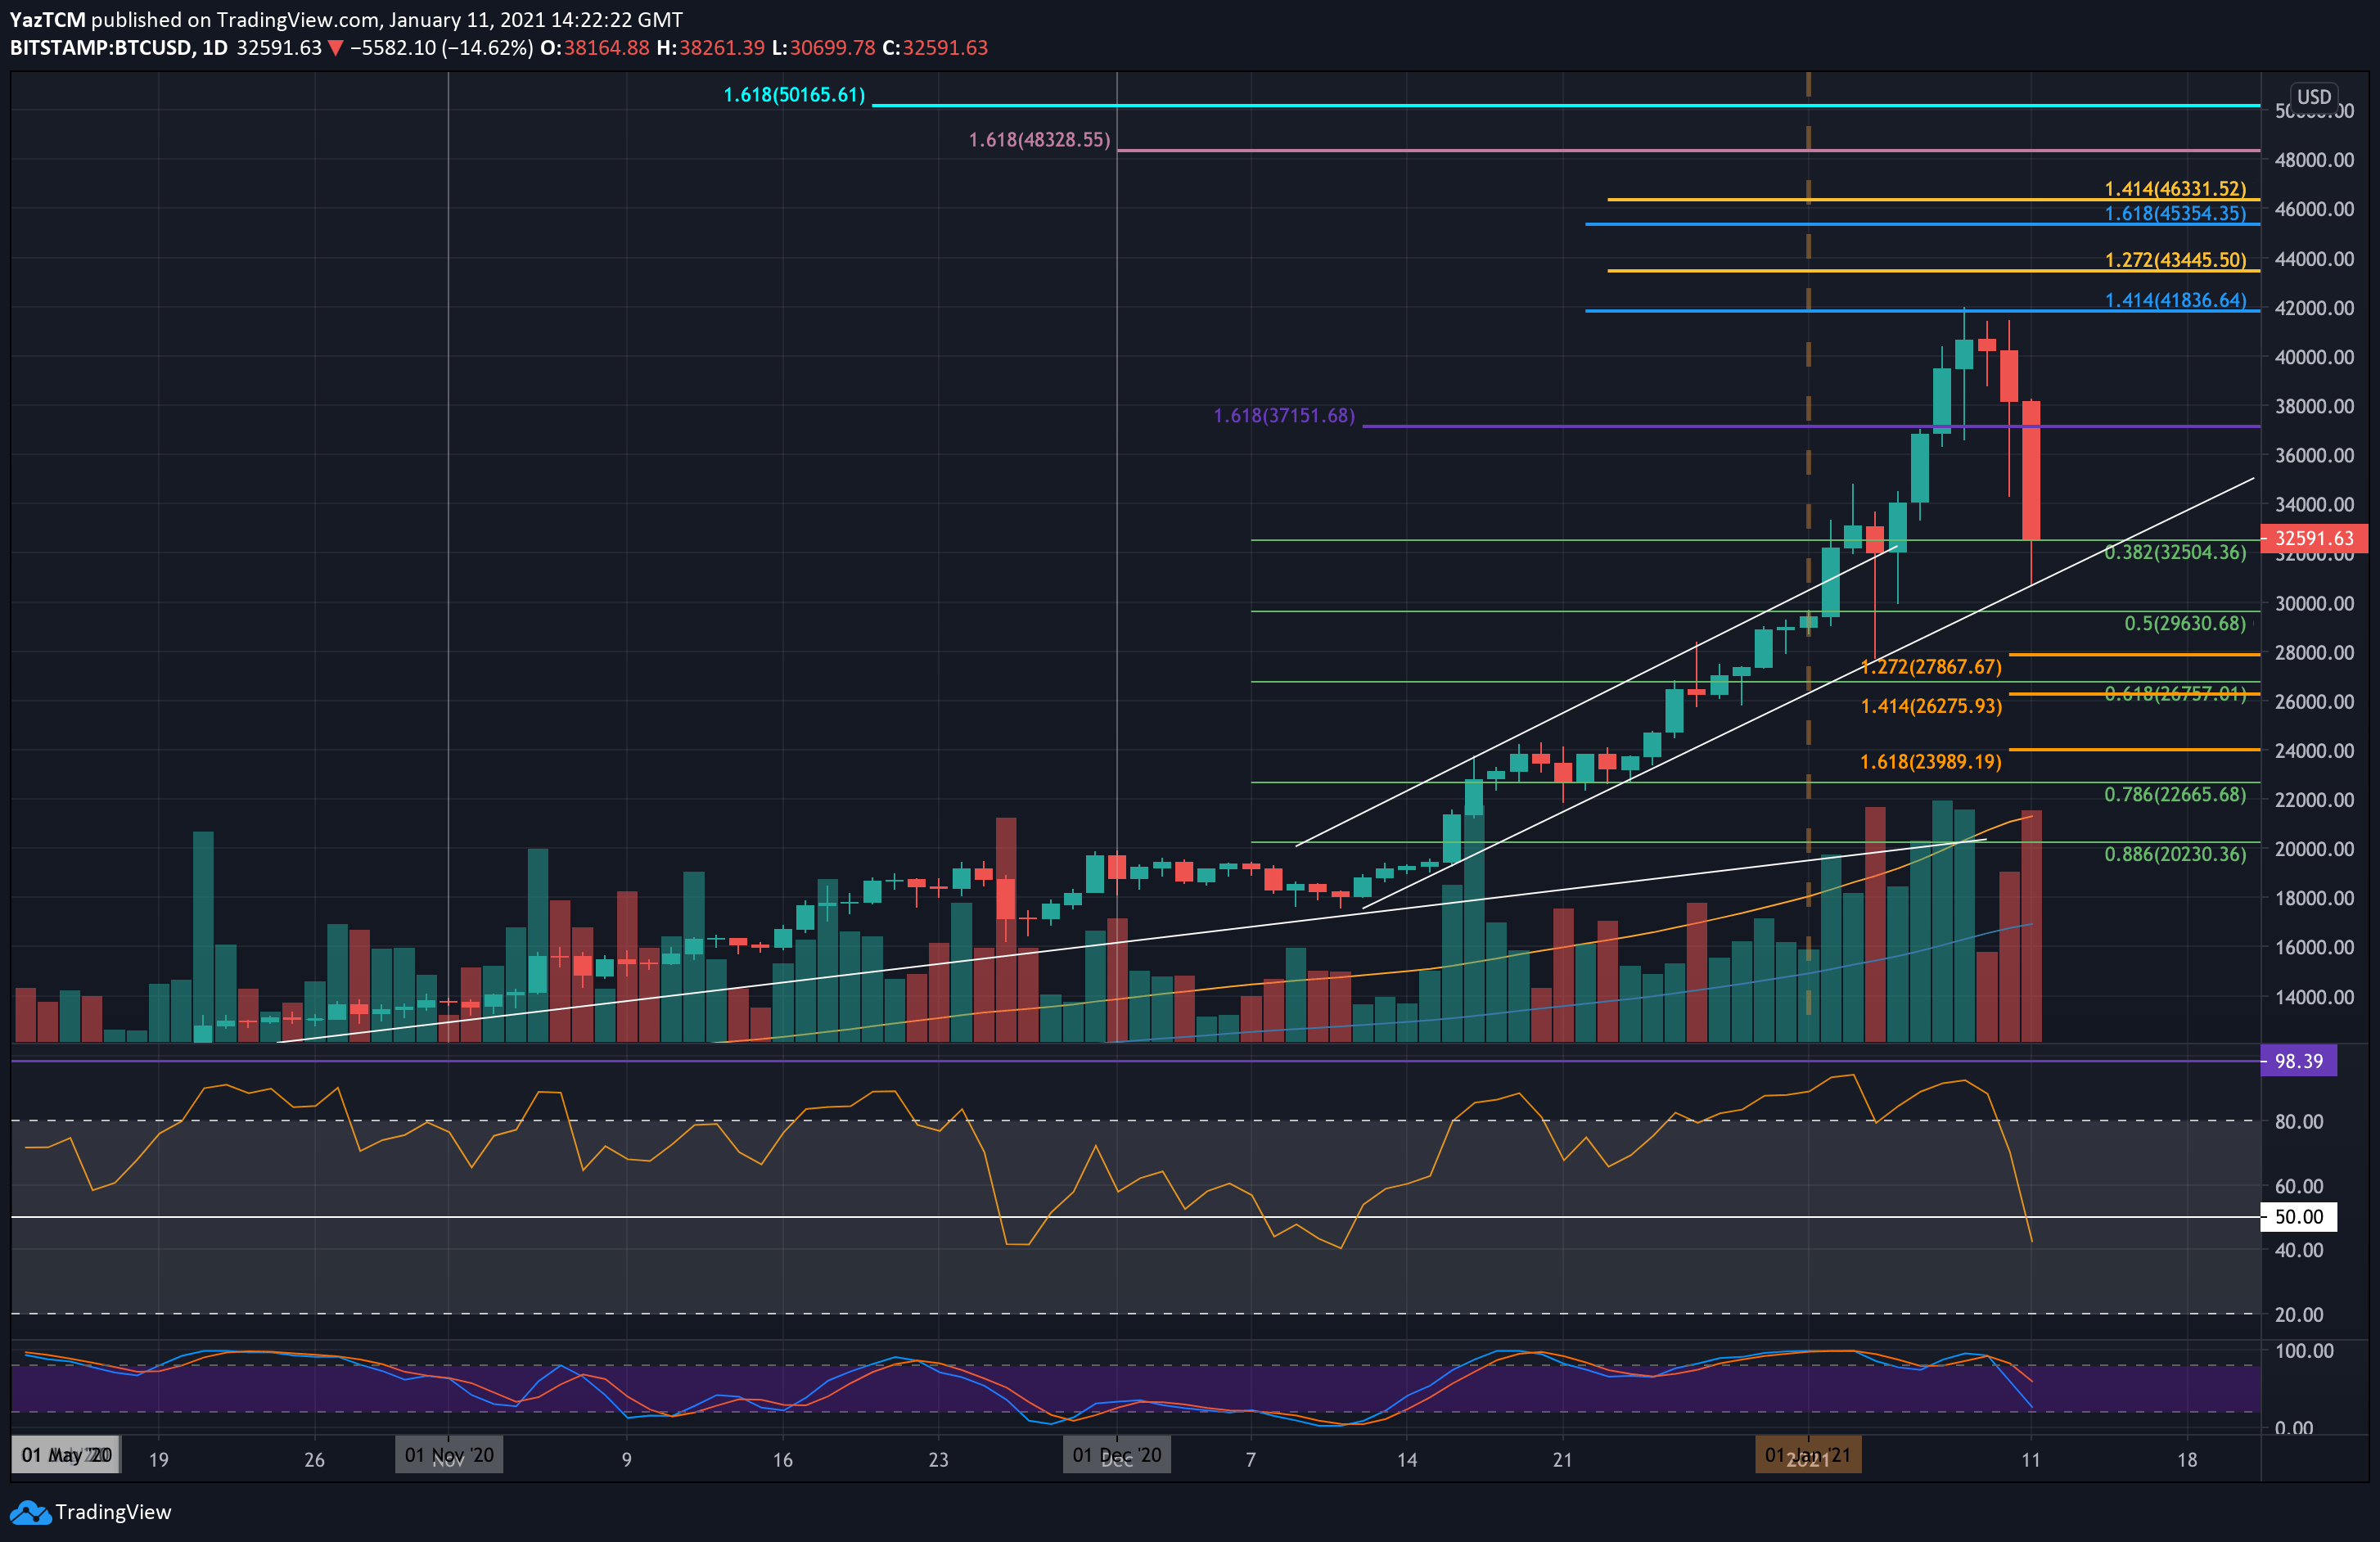
BTC/USD Daily Chart. Source: TradingView
The price of Bitcoin took a tumble today after dropping by almost 25% in the past 24-hours alone, and almost 30% from the ATH that was set last Friday at $42K.
Over the past 14 hours, Bitcoin dropped by a total of $7,400 after following a breakdown of the marked descending triangle (4-hour chart), which has been predicted in our yesterday’s analysis. Bitcoin dropped severely to $30,700 as the current low, according to Bitsamp.
Typically, this type of pullback is necessary after the parabolic bullish move. There was no significant correction (of over 25%) since Bitcoin broke the 2017 all-time high a month ago.
The question now is whether the bulls found a strong-enough support level at the mid-term ascending trend line at $30,700. This trend line extended back to the December lows and allowed BTC to rebound and trade back above support at $32,500, provided by a .382 Fibonacci Retracement level.
Although it looks like Bitcoin should recover from here, a breakout beneath this rising trend line could spell another spill for BTC as it would likely cause the price to drop beneath $30,000 and help the bears with another panic sell toward the $26,750 support (.618 Fib Retracement) and $24,000.
Key Support Levels: $32,500, $30,700, $30,000, $29,630, $27,870.
Key Resistance Levels: $34,000, $36,000, $37,150, $38,000, $39,000.
Moving forward, the first level of support lies at $32,500, which was the low before the recent plunge to $30K. The next level to consider lies at the rising trend line, around the current low of $30,700. This is closely followed by the psychological support at $30,000.
Below $30,000, further support lies at $29,630 (.5 Fib Retracement), $27,870 (downside 1.272 Fib Extension), and $26,760 (.618 Fib Retracement), and $26,000. Further is $24,000 and the 2017 ATH at $20K.
On the other side, the first major level of resistance lies at $34,000. This is followed by $36,000, $37,150, $38,000, and $39,000.
Today’s sell-off caused the daily RSI to head beneath the midline, finally releasing the RSI from the over-bought area it was trading at. A rebound on the RSI can be expected at 40 as it bounced from the same area in November and December.
Moreover, we mentioned this bearish divergence in our most recent price analysis from yesterday.