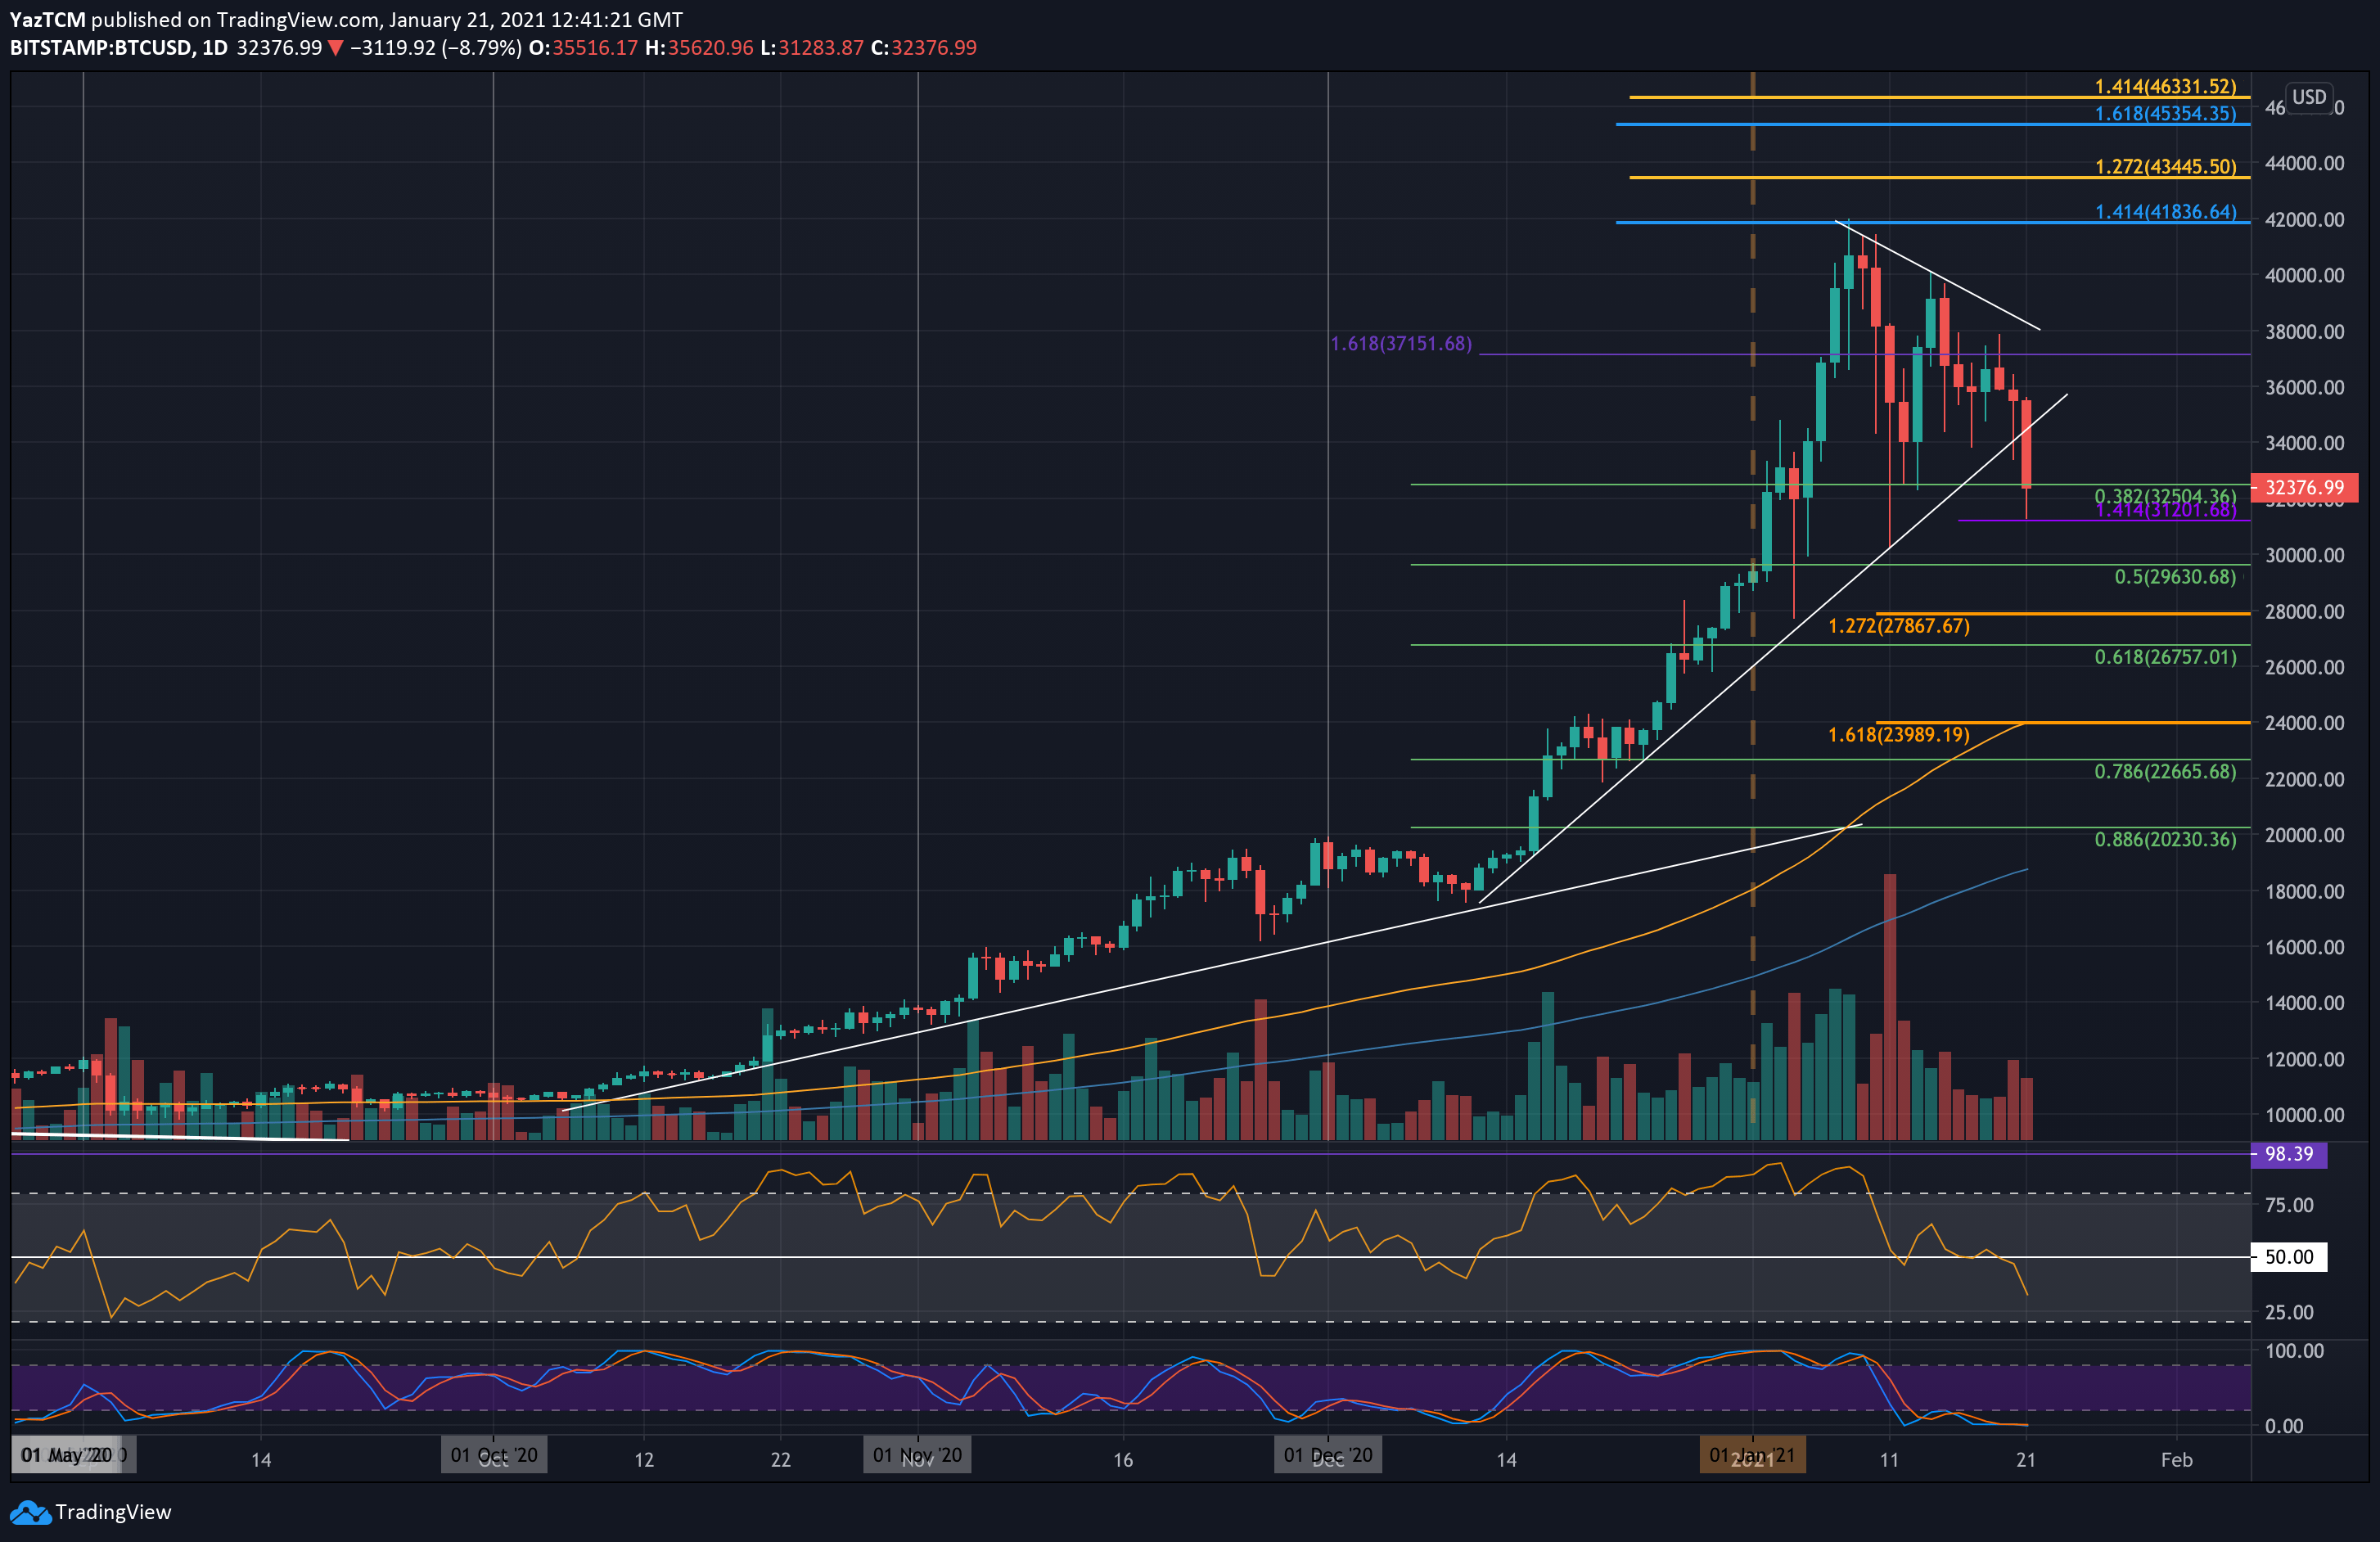
BTC/USD Daily Chart. Source: TradingView
Today has been a rough day for Bitcoin bulls. The price dropped by a sharp 10% today, over $4K, over the past hours. This comes just one day after the primary cryptocurrency reached $38K. In conclusion – we saw a 2-day nightmare of almost $7000 loss in value.
What leveraged the collapse was the horizontal triangle’s breakdown, as mentioned here in our most recent BTC analysis from yesterday. As can be seen on the daily chart below, once the triangle was broken along with horizontal support of $34K, the bloodbath began.
As of writing these lines, the daily low (according to Bitstamp) lies about the support area at $31,200, which is the downside 1.414 Fib Extension level.
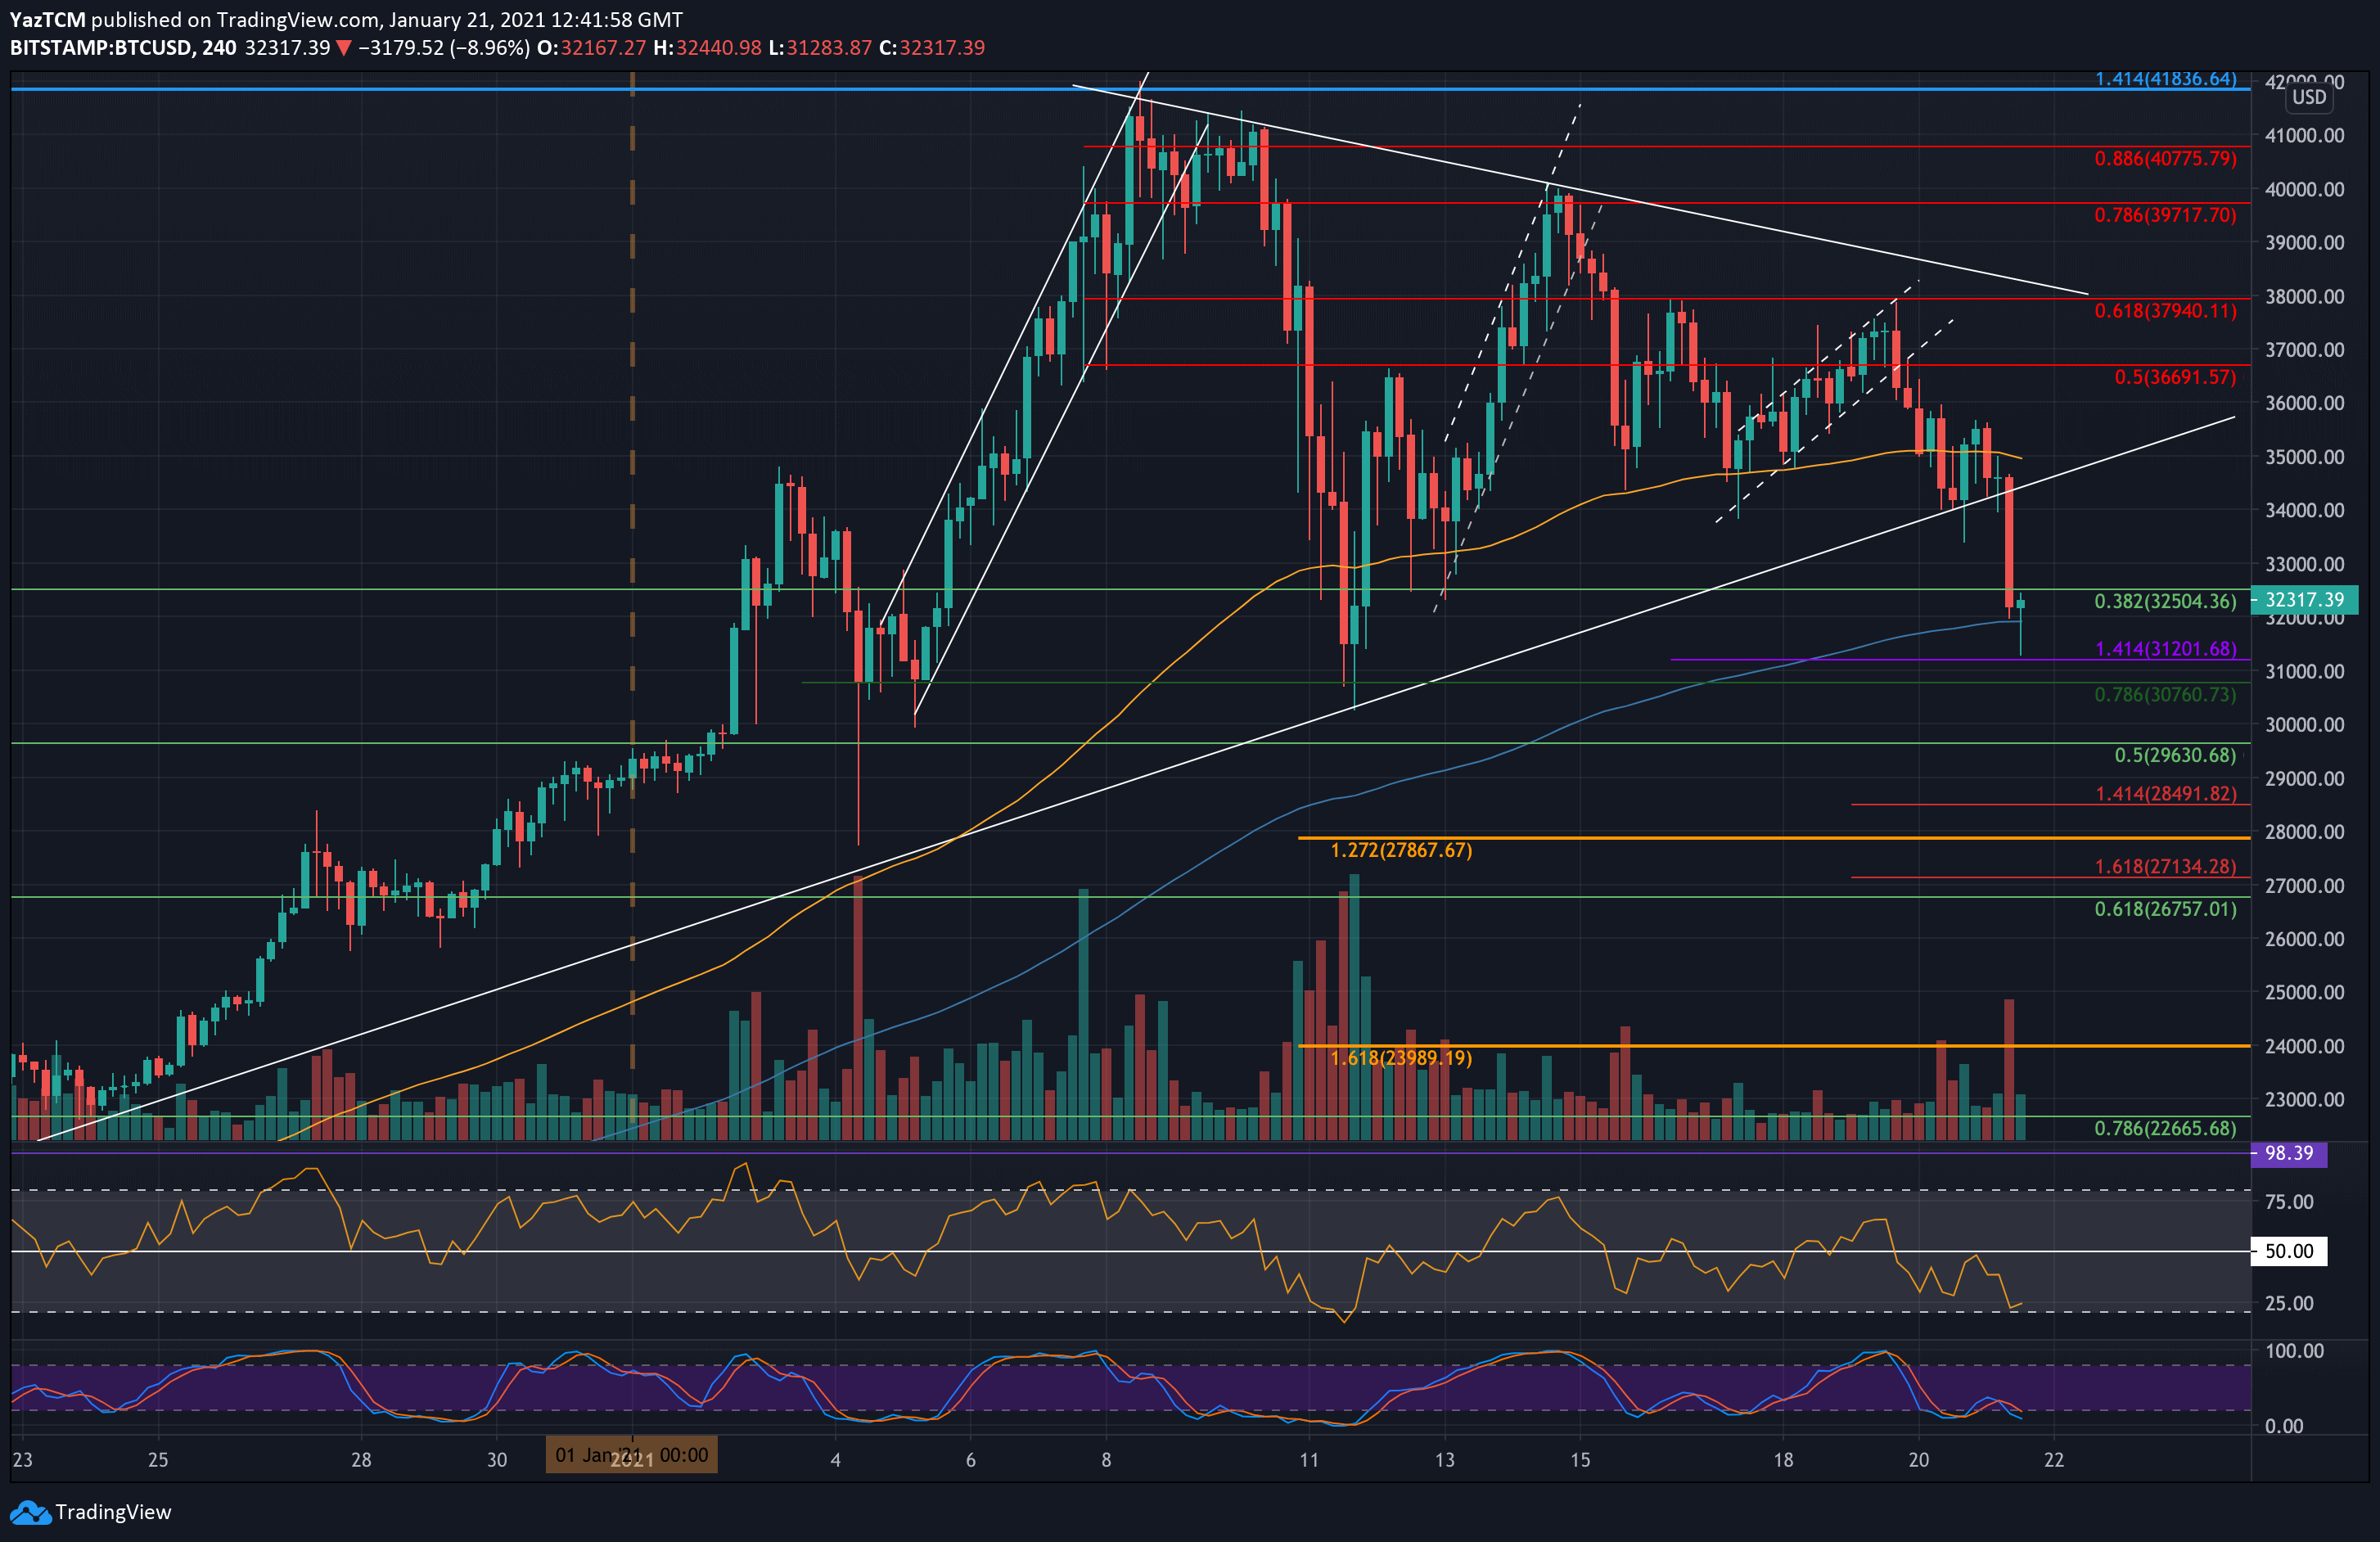
Shortly after recording the current low at $31,200, the bulls had come and a massive correction above was initiated. We should pay attention to the triangle’s breakdown level at $34K. In case today’s candle will close above it, then the mid-term bull trend might still be intact. From the other side, a retest and a failed attempt to breach mean one thing – the bears are in control for the upcoming short-term.
Key Support Levels: $31,200 (today’s low), $30,760, $30,000 (last week’s low), $29,630, $28,500.
Key Resistance Levels: $32,500, $34,000, $34,800, $35,000, $36,000.
Looking ahead, if the bears continue to drive Bitcoin beneath $31,200, the first level of support lies at $30,760 (short term .786 Fib), as well as a strong support level from the past week. This is followed by $30,000 – last week’s low, $29,630 (.5 Fib), $28,500 (short term downside 1.414 Fib Extension), and $27,900 (downside 1.272 Fib Extension).
The next possible targets might be $26,757 (.618 Fib) and $26,000.
On the other side, the first level of resistance lies at $32,500. This is followed by $34,000, as mentioned above, $34,800 – $35,000. Further resistance is located at $36,690 and $37,940 (yesterday’s top).
The Daily RSI has now plunged into the bearish territory, indicating that the selling momentum is increasing rapidly. However, the Stochastic RSI oscillator both on the 4-hour and the 1-day chart are deep in the oversold area, which might trigger a correction.