BTC Analysis
6 years ago

Bitcoin Chart Analysis March.27 & Overview

Yuval Gov Mar 27, 2018 07:53

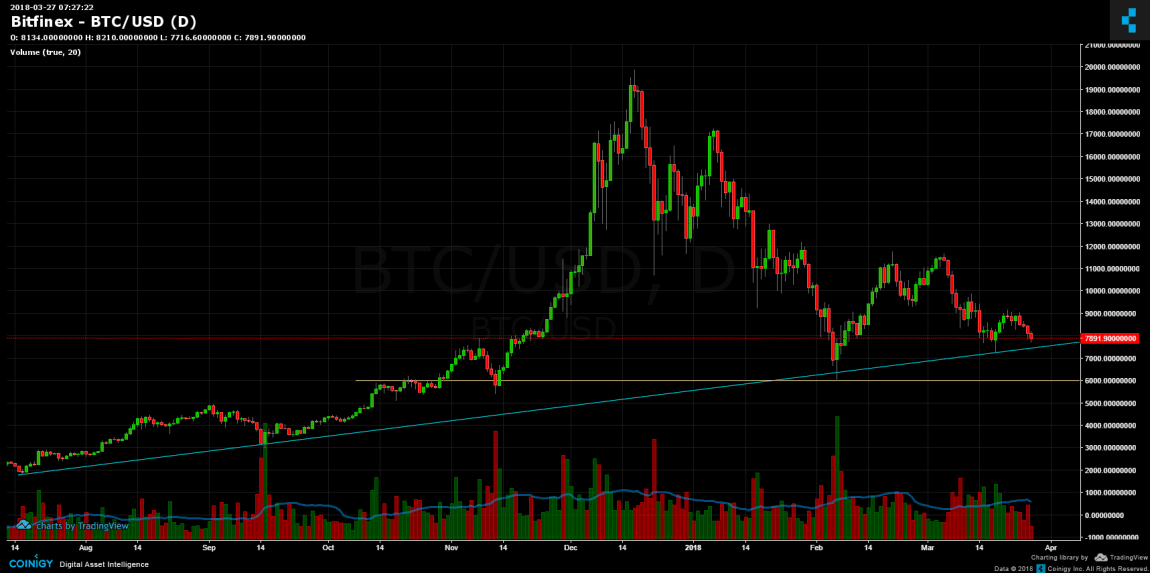
Following our previous BTC price analysis, Bitcoin had broke the important support level at $8,400, and from there quickly head down to the next support level at $7,800. As of now, we are struggling around the support level. Breaking down the $7,800 will send us to $7,300-$7,500 which is critical major area of support. From there, the way to test the $6,000 zone is fast to reach. On the bull side, we can see testing the support-turned resistance area at $8,400.

BTC/USD BitFinex 4 Hours chart

BTC/USD BitFinex 1 Day chart Overview

The critical area is at the long-term trend-line at around $7,500. Bitcoin might get support there and go for another wave up. Breaking it down and $6,000 is at reach.


SPECIAL OFFER (Sponsored)
LIMITED OFFER 2024 for CryptoPotato readers at Bybit: Use this link to register and open a $500 BTC-USDT position on Bybit Exchange for free!


Disclaimer: Information found on CryptoPotato is those of writers quoted. It does not represent the opinions of CryptoPotato on whether to buy, sell, or hold any investments. You are advised to conduct your own research before making any investment decisions. Use provided information at your own risk. See Disclaimer for more information.

Share This Article
Yuval Gov

Yuval Gov has over 15 years of trading experience in the stock exchange, graduated from TAU - Economics and Management. Fell in love with the crypto space. Does Crossfit to get away from FOMO. Contact Yuval: LinkedIn