BTC Analysis
6 years ago

Bitcoin Chart Analysis March.18

Yuval Gov Mar 18, 2018 12:01

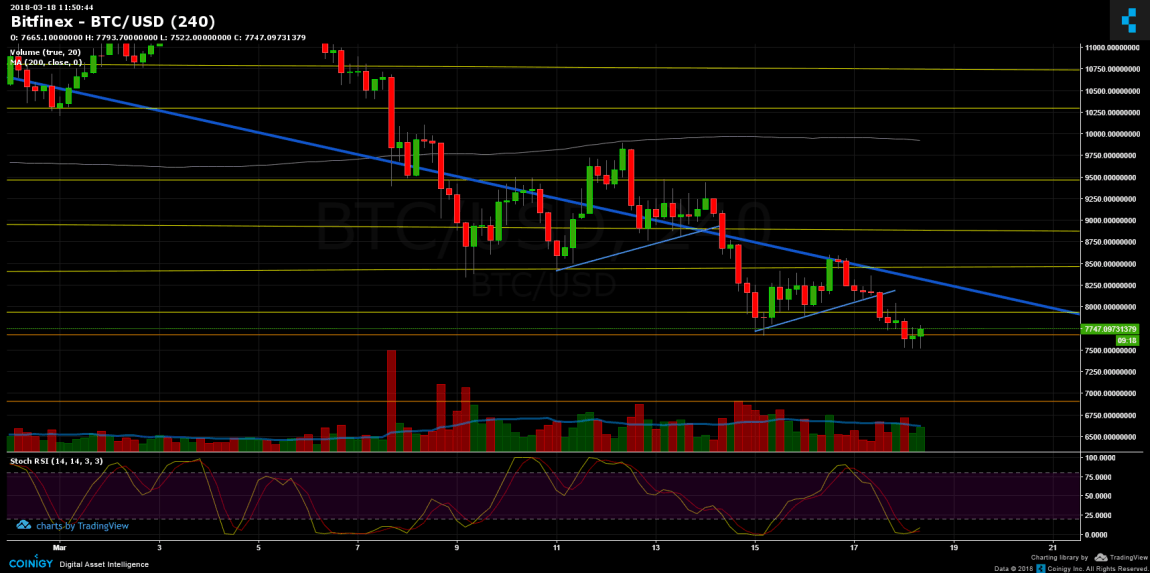
Over the past 24 hours we’ve seen Bitcoin breaking down the trend line at $8100, down to support area at $7600. This looks almost the same trend line which got broken at $9000 on Mar.14, just 4 days ago. The overall pattern is creating lower highs – which indicates on a bear market.

For the very short term, we might see a correction (Scholastic RSI has crossed and is at its low values) towards the long-term descending trend line at around $8,000-$8,200. But overall, like mentioned here before, we might test the $6,800 support and from there the way to the February 6 low at $5,900 is pretty close.

The market feels the uncertainty of the upcoming G20 crypto talks that might have significant influence.

BTC/USD BitFinex 4 Hours chart

SPECIAL OFFER (Sponsored)
Binance Free $600 (CryptoPotato Exclusive): Use this link to register new account and receive $600 exclusive welcome offer on Binance (full details).

LIMITED OFFER 2024 for CryptoPotato readers at Bybit: Use this link to register and open a $500 BTC-USDT position on Bybit Exchange for free!


Disclaimer: Information found on CryptoPotato is those of writers quoted. It does not represent the opinions of CryptoPotato on whether to buy, sell, or hold any investments. You are advised to conduct your own research before making any investment decisions. Use provided information at your own risk. See Disclaimer for more information.

Share This Article
Yuval Gov

Yuval Gov has over 15 years of trading experience in the stock exchange, graduated from TAU - Economics and Management. Fell in love with the crypto space. Does Crossfit to get away from FOMO. Contact Yuval: LinkedIn