BTC Analysis
6 years ago

Bitcoin Chart Analysis March.15

Yuval Gov Mar 15, 2018 08:34

Rainy days. Reminder from our last analysis, two days ago: “As of now, it looks as we are struggling to stay above the descending line and the $9,000 support area. Breaking it down will send us to test $8,400 support zone, the next major support area is the $7,800-8K level. The high volume of the sellers (relatively to the buyers) might be a sign that the overall direction is still down.”

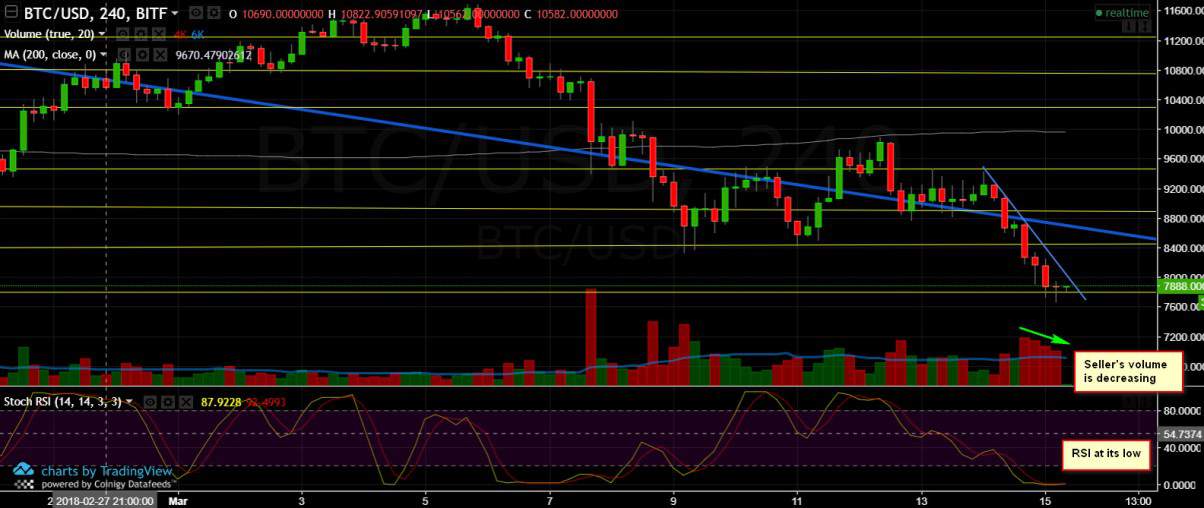
Unfortunately, this bear scenario happened, and quicker than expected we are testing the important support level at $7,800-8000. For the very short term, we might see a correction up from here: The sellers force and volume is getting lower (the green arrow on the chart), Stochastic RSI oscillator is at its very low values, and after so many red candles its likely to see some green. But, the overall pattern of the market still looks very bearish, hence, we might see sooner or later testing again the $6,000 levels.

BTC/USD BitFinex 4 Hours chart

SPECIAL OFFER (Sponsored)
Binance Free $600 (CryptoPotato Exclusive): Use this link to register new account and receive $600 exclusive welcome offer on Binance (full details).

LIMITED OFFER 2024 for CryptoPotato readers at Bybit: Use this link to register and open a $500 BTC-USDT position on Bybit Exchange for free!


Disclaimer: Information found on CryptoPotato is those of writers quoted. It does not represent the opinions of CryptoPotato on whether to buy, sell, or hold any investments. You are advised to conduct your own research before making any investment decisions. Use provided information at your own risk. See Disclaimer for more information.

Share This Article
Yuval Gov

Yuval Gov has over 15 years of trading experience in the stock exchange, graduated from TAU - Economics and Management. Fell in love with the crypto space. Does Crossfit to get away from FOMO. Contact Yuval: LinkedIn