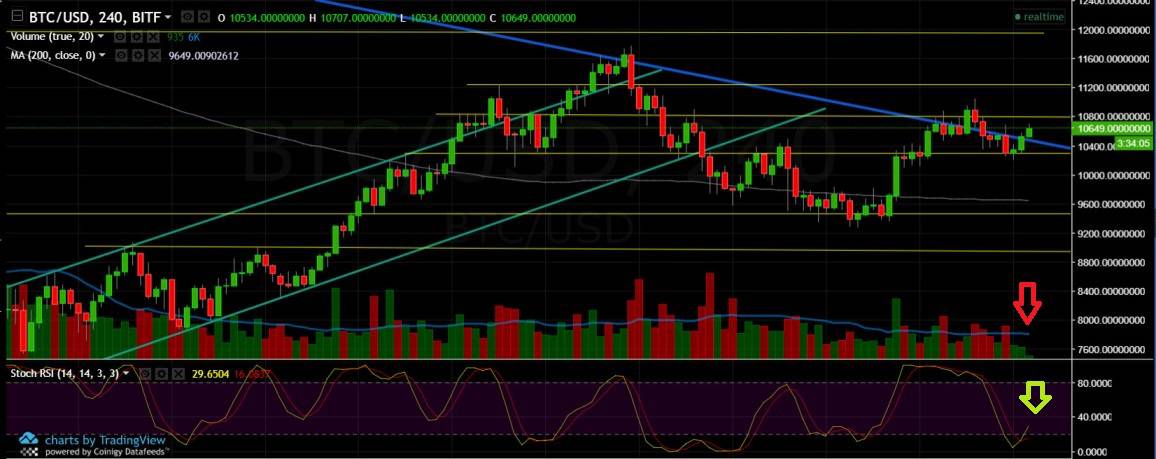
We continue the previous analysis from two days ago, where Bitcoin was about to break up the long-term descending trend line (marked with blue). Quoted from previous analysis: “We might need some air to continue the way up, so the %38.2 Fibonacci retracement level and support at $10,200 area, is likely to be tested again in between.”
As of now, Bitcoin reached a low of $10,210 on BitFinex, before facing up again. As we can see on the chart, Bitcoin is testing the descending line again. A break, with high volume (trading volume is very low the past 12 hours, marked with a red arrow), will set targets at $11,900-12,000 area. Stochastic RSI oscillator looks positive (marked with a green arrow). On the bearish side, failing (again) to break up the descending line will send us back to the $10K area, and from there to test again support levels at $9,400 and $9,000.