Faster than we expected, Bitcoin had raised to test resistance around $10-$10,300 and from there, after 10 hours consolidation, BTC went up to test the long-term descending line. On yesterday’s analysis, we mentioned that direction. This was followed by high volume, looks like the reason is that Circle, Goldman-Sachs backed company, had bought Poloniex exchange.
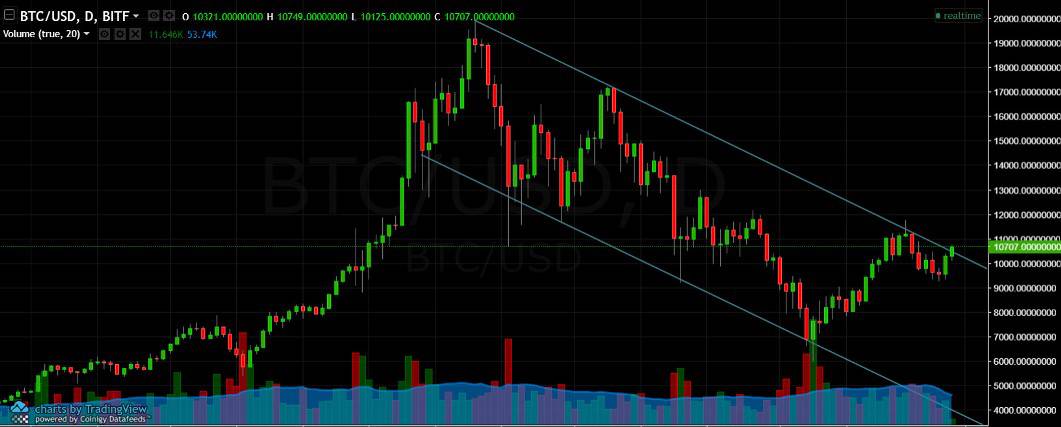
From here, breaking up the long-term descending line (see overview 1 day chart below), followed by high volume, will send us to resistance level at $11,200, and then to test the $11,900-$12,000 area.
We might need some air to continue the way up, so the %38.2 Fibonacci retracement level and support at $10,200 area, is likely to be tested again in between. Stochastic RSI oscillator is about to cross – this indicates the need for a little correction down. Overall, Bitcoin looks positive for the short-term, but for the long-term we are still under bear market conditions.
As mentioned above, we are testing again the long-term descending line: last time it was tested on February 20, just a week ago, at around $11,600. Would we see a break on the daily chart?