BTC Analysis
6 years ago

Bitcoin Chart Analysis Feb.13

Yuval Gov Feb 13, 2018 09:57

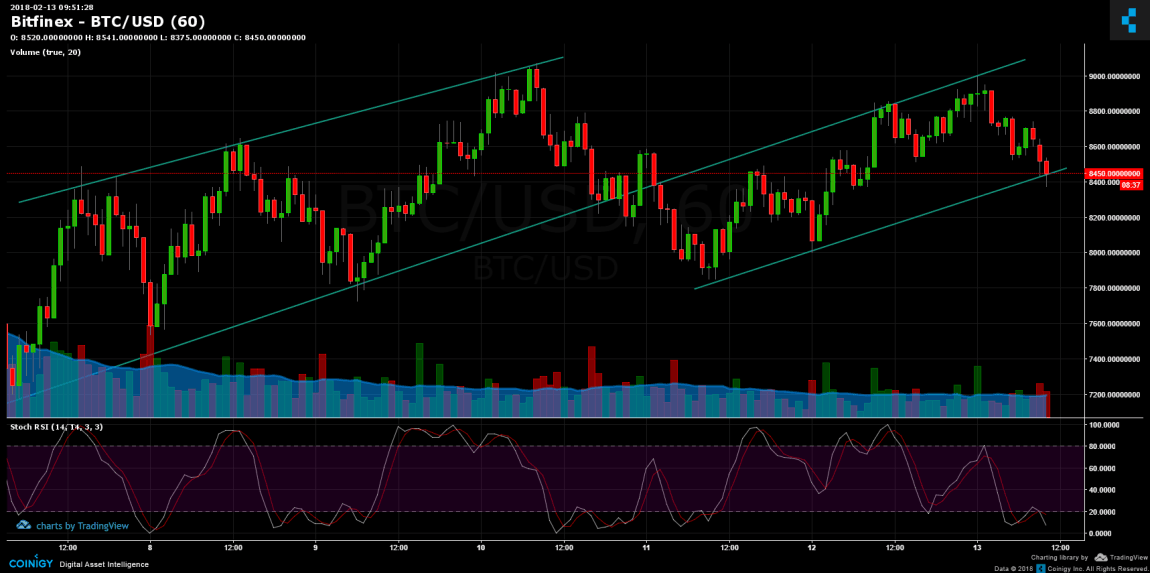
During recent hours BTC had reached $9000, but could not rise above the resistance level and turned downwards. After the formation of a head and shoulders pattern, it broke back to the support around the $8600. The broad chart show weakness – Stochastic RSI indicator points down, and there is a substantial chance of a returning towards the $7800. Breaking of the $7800 will lead us to the $7600 and back to the $6000 area. We’ll keep you updated.

We are still positive for the short term, as long as Bitcoin finds support above the trend line.

BitFinex BTC/USD 1HR Chart:


SPECIAL OFFER (Sponsored)
LIMITED OFFER 2024 for CryptoPotato readers at Bybit: Use this link to register and open a $500 BTC-USDT position on Bybit Exchange for free!


Disclaimer: Information found on CryptoPotato is those of writers quoted. It does not represent the opinions of CryptoPotato on whether to buy, sell, or hold any investments. You are advised to conduct your own research before making any investment decisions. Use provided information at your own risk. See Disclaimer for more information.

Share This Article
Yuval Gov

Yuval Gov has over 15 years of trading experience in the stock exchange, graduated from TAU - Economics and Management. Fell in love with the crypto space. Does Crossfit to get away from FOMO. Contact Yuval: LinkedIn