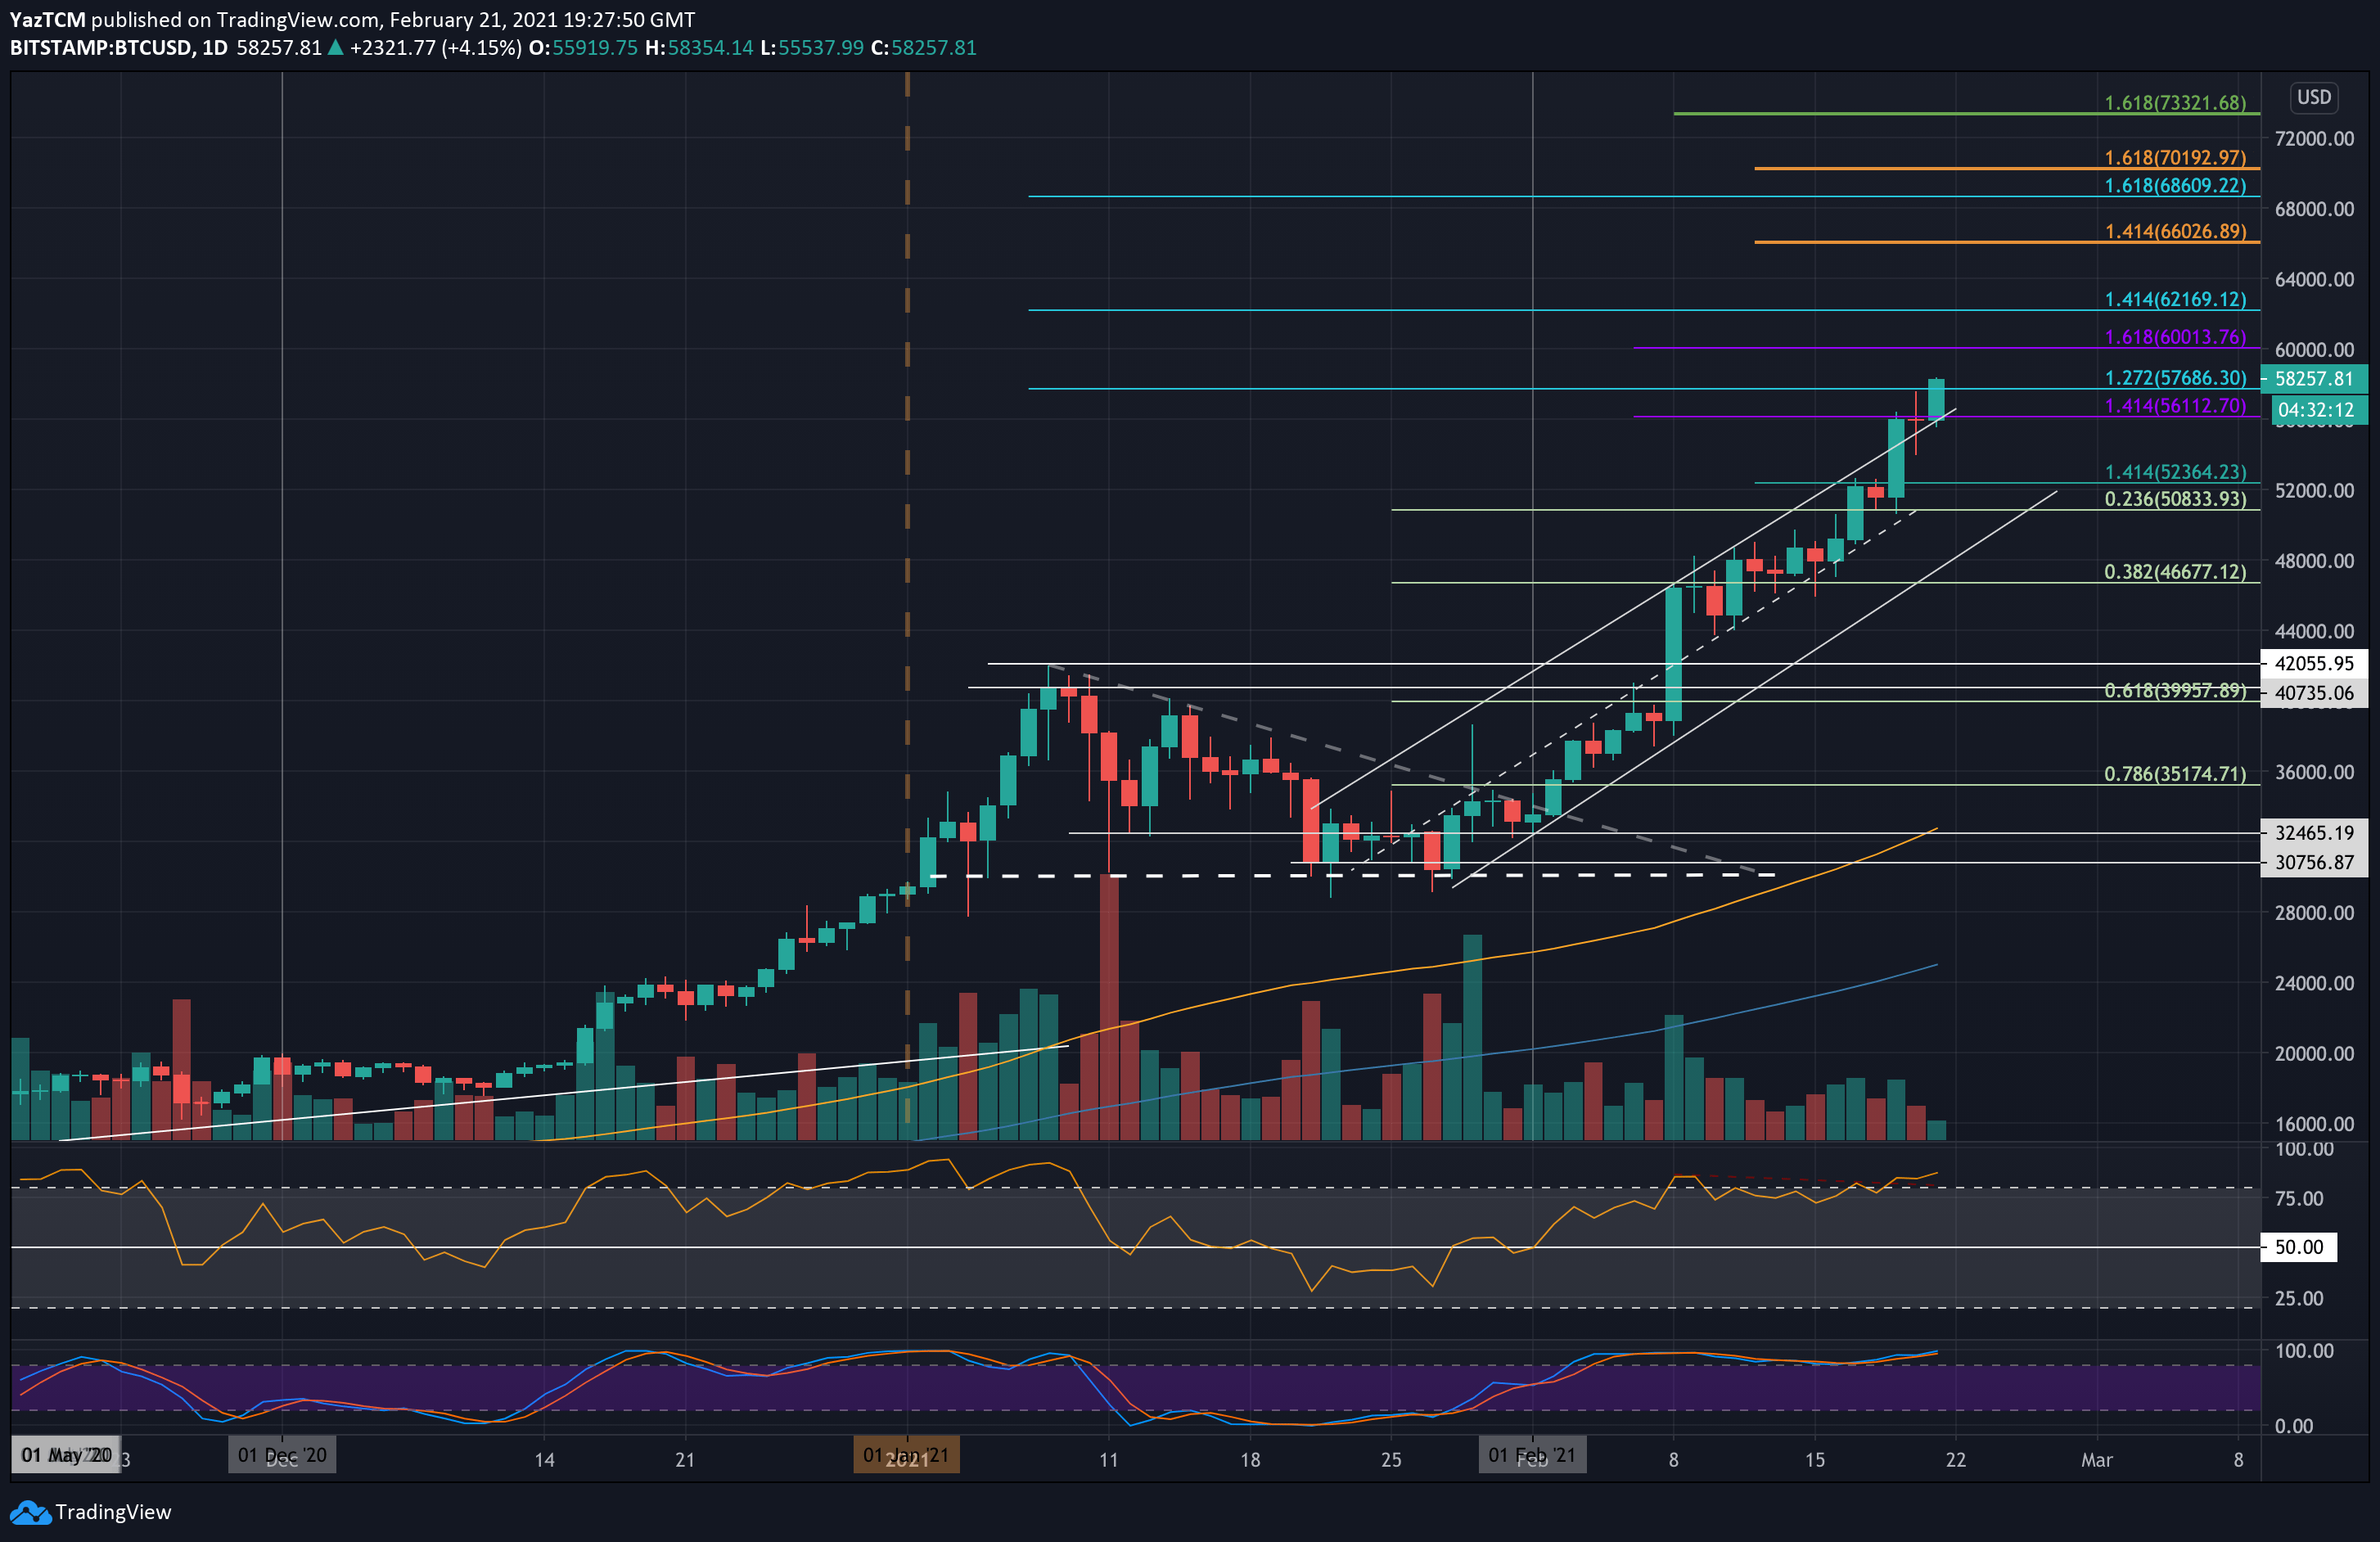
BTC/USD Daily Chart. Source: TradingView
Bitcoin surged by a solid $2,500 so far today, gaining almost 5% in value. This allowed the cryptocurrency to break resistance at $56K, surpassing $58K to set a new all-time high.
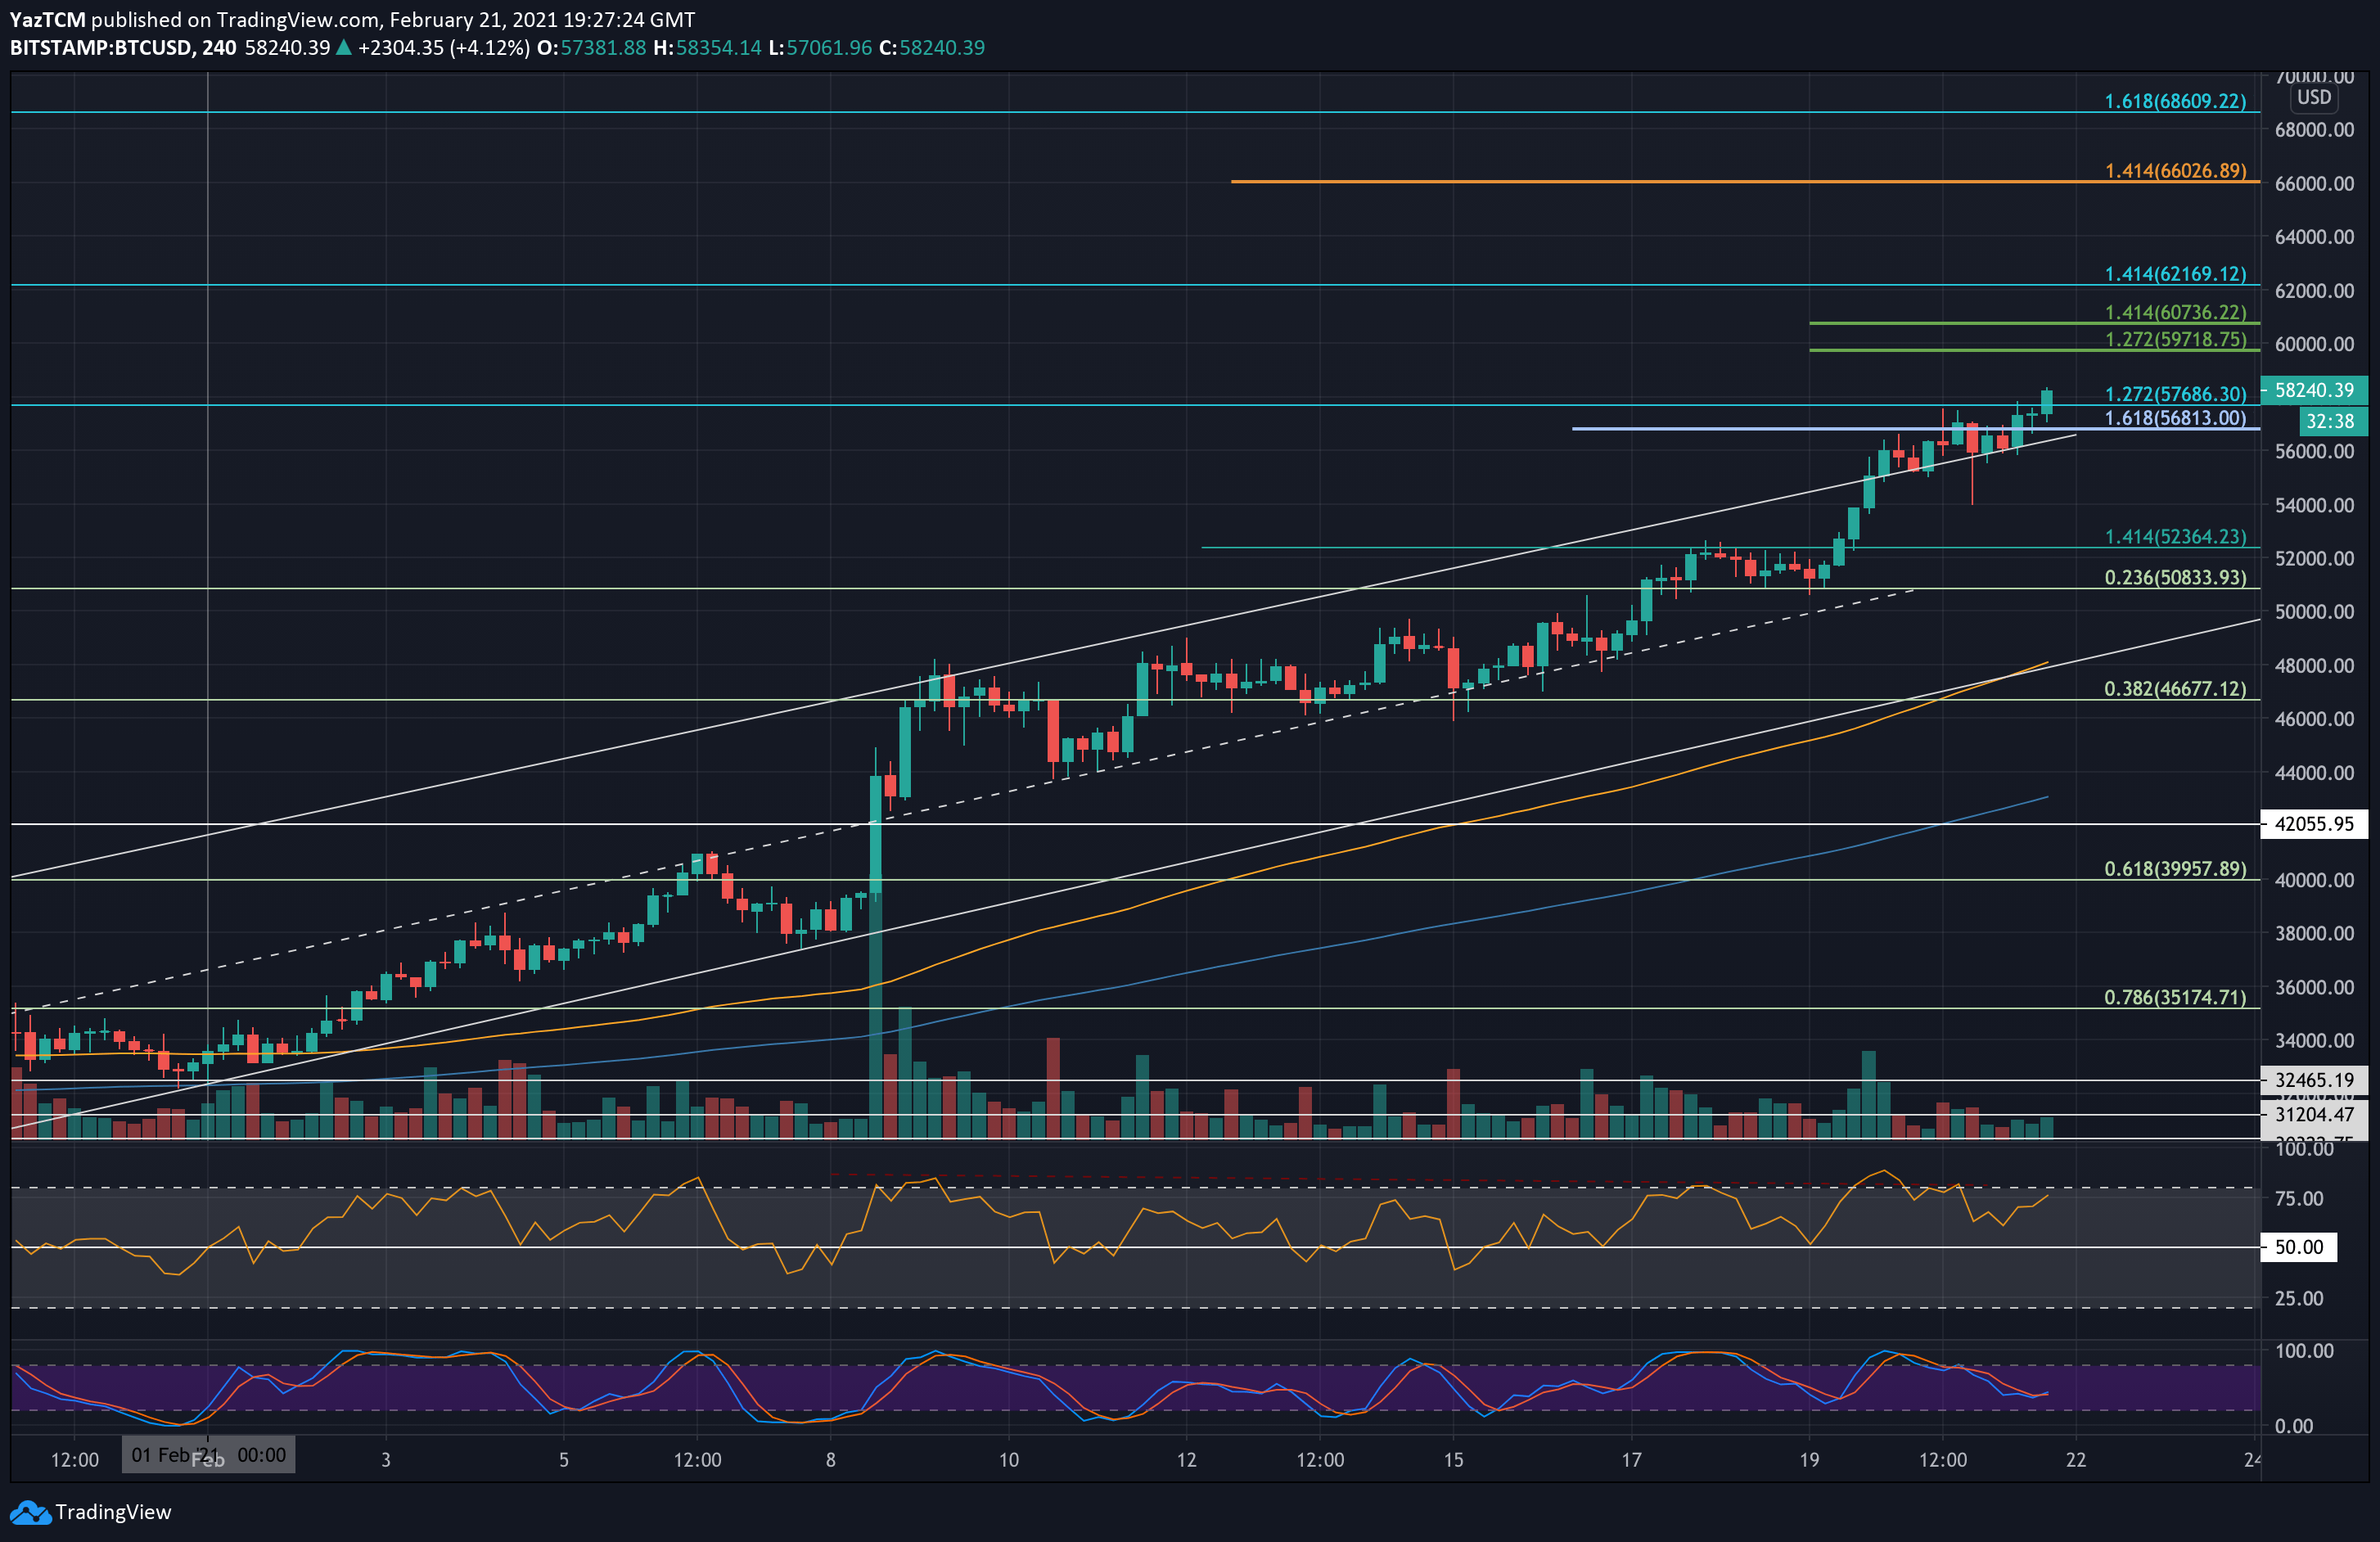
The primary cryptocurrency had been trading within an ascending price channel for the entire month of February. On Friday, Bitcoin had surged by 8.5% as it broke past the previous resistance at $52,365 to smash the upper boundary of the marked price channel, reaching the resistance level at $56,112 (1.414 Fib Extension).
From there, Bitcoin had failed to close a daily candle above that level. Yesterday, after setting a new ATH at $57.5K, Bitcoin had seen an enormous price correction of $3500 to $54,000. However, the bulls quickly jumped on the cheap BTC showing how strong the market is. Just hours later, and Bitcoin broke Saturday’s ATH to a new one set above $58K.
Key Support Levels: $57.5K – $57,686, $56,112, $55,000, $52,365, $50,800.
Key Resistance Levels: $58,350, $59,720 – $60,000, $60,735, $62,170, $64,000, $66,000.
Looking ahead, the first level of resistance now lies at the current ATH at $58,350, followed by resistance at $59,720 (short-term 1.272 Fib Extension). This is closely followed by $60,000.
Beyond $60,000, additional resistance lies at $60,735 (short term 1.414 Fib Extension), $62,170 (1.414 Fib Extension – blue), $64,000, and $66,000 (1.414 Fib extension – orange).
In case of a correction, the first support lies at $57,686 (today’s previous resistance and yesterday’s high). This is followed by $56,112 (yesterday’s resistance turned support & previous price channel boundary), $55,000, $52,365, and $50,800 (.236 Fib Retracement & lower boundary of price channel).
The RSI is extremely overbought as it sits above 80. However, the RSI was higher during the January 2021 surge, indicating there is still room for the momentum to push higher.
It will be interesting to see if the bullish momentum will continue going forward to the new week.