Bitcoin’s price has undergone a period of corrective retracements, recently witnessing a 9% drop towards the $64K level.
However, the cryptocurrency is fortified by several robust support levels, potentially halting further downward pressure from market sellers.
By Shayan
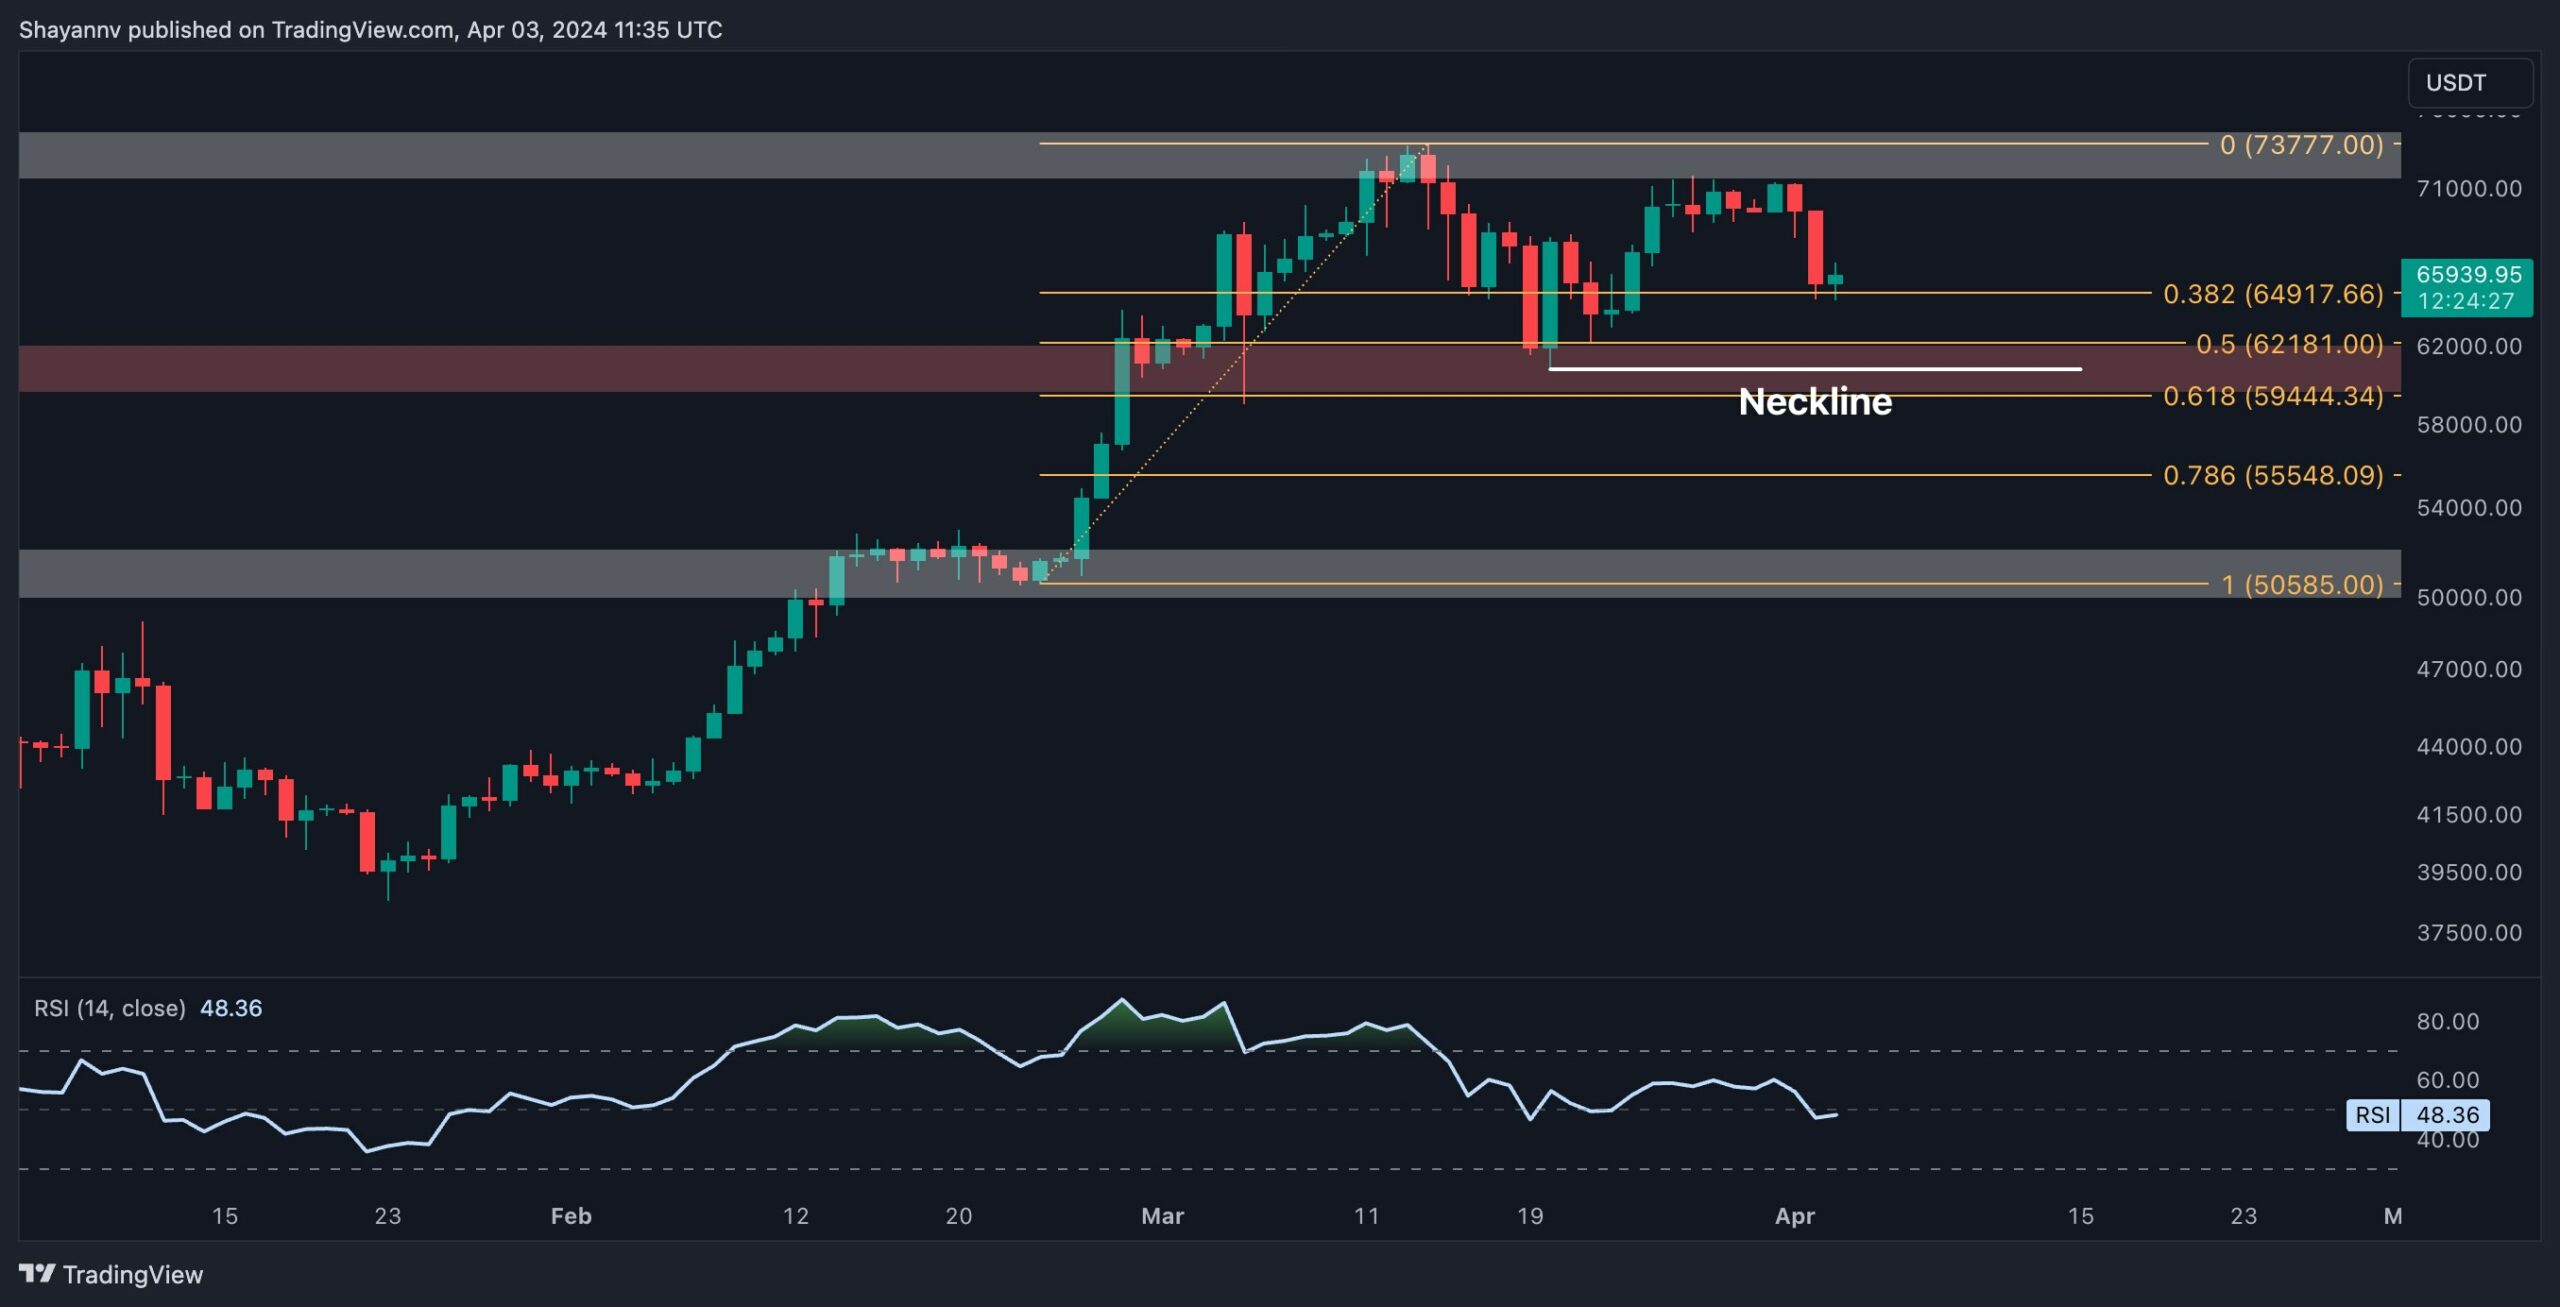
A thorough examination of the daily chart reveals significant selling pressure on Bitcoin’s price after surpassing the critical $70K resistance, resulting in a notable rejection. This led to a 9% decline towards the critical $64K threshold.
Currently, Bitcoin appears to be forming a potential double-top pattern, with the neckline positioned at $62K. A breach below this level could signify the completion of the pattern, triggering a further downward movement towards the critical support area at $59K.
Nevertheless, the BTC price has multiple support points to rely on ahead, notably the range between the 0.5 ($62,181) and 0.618 ($59,444) Fibonacci retracement levels. These marks may serve to halt further downward pressure and initiate a bullish reversal.
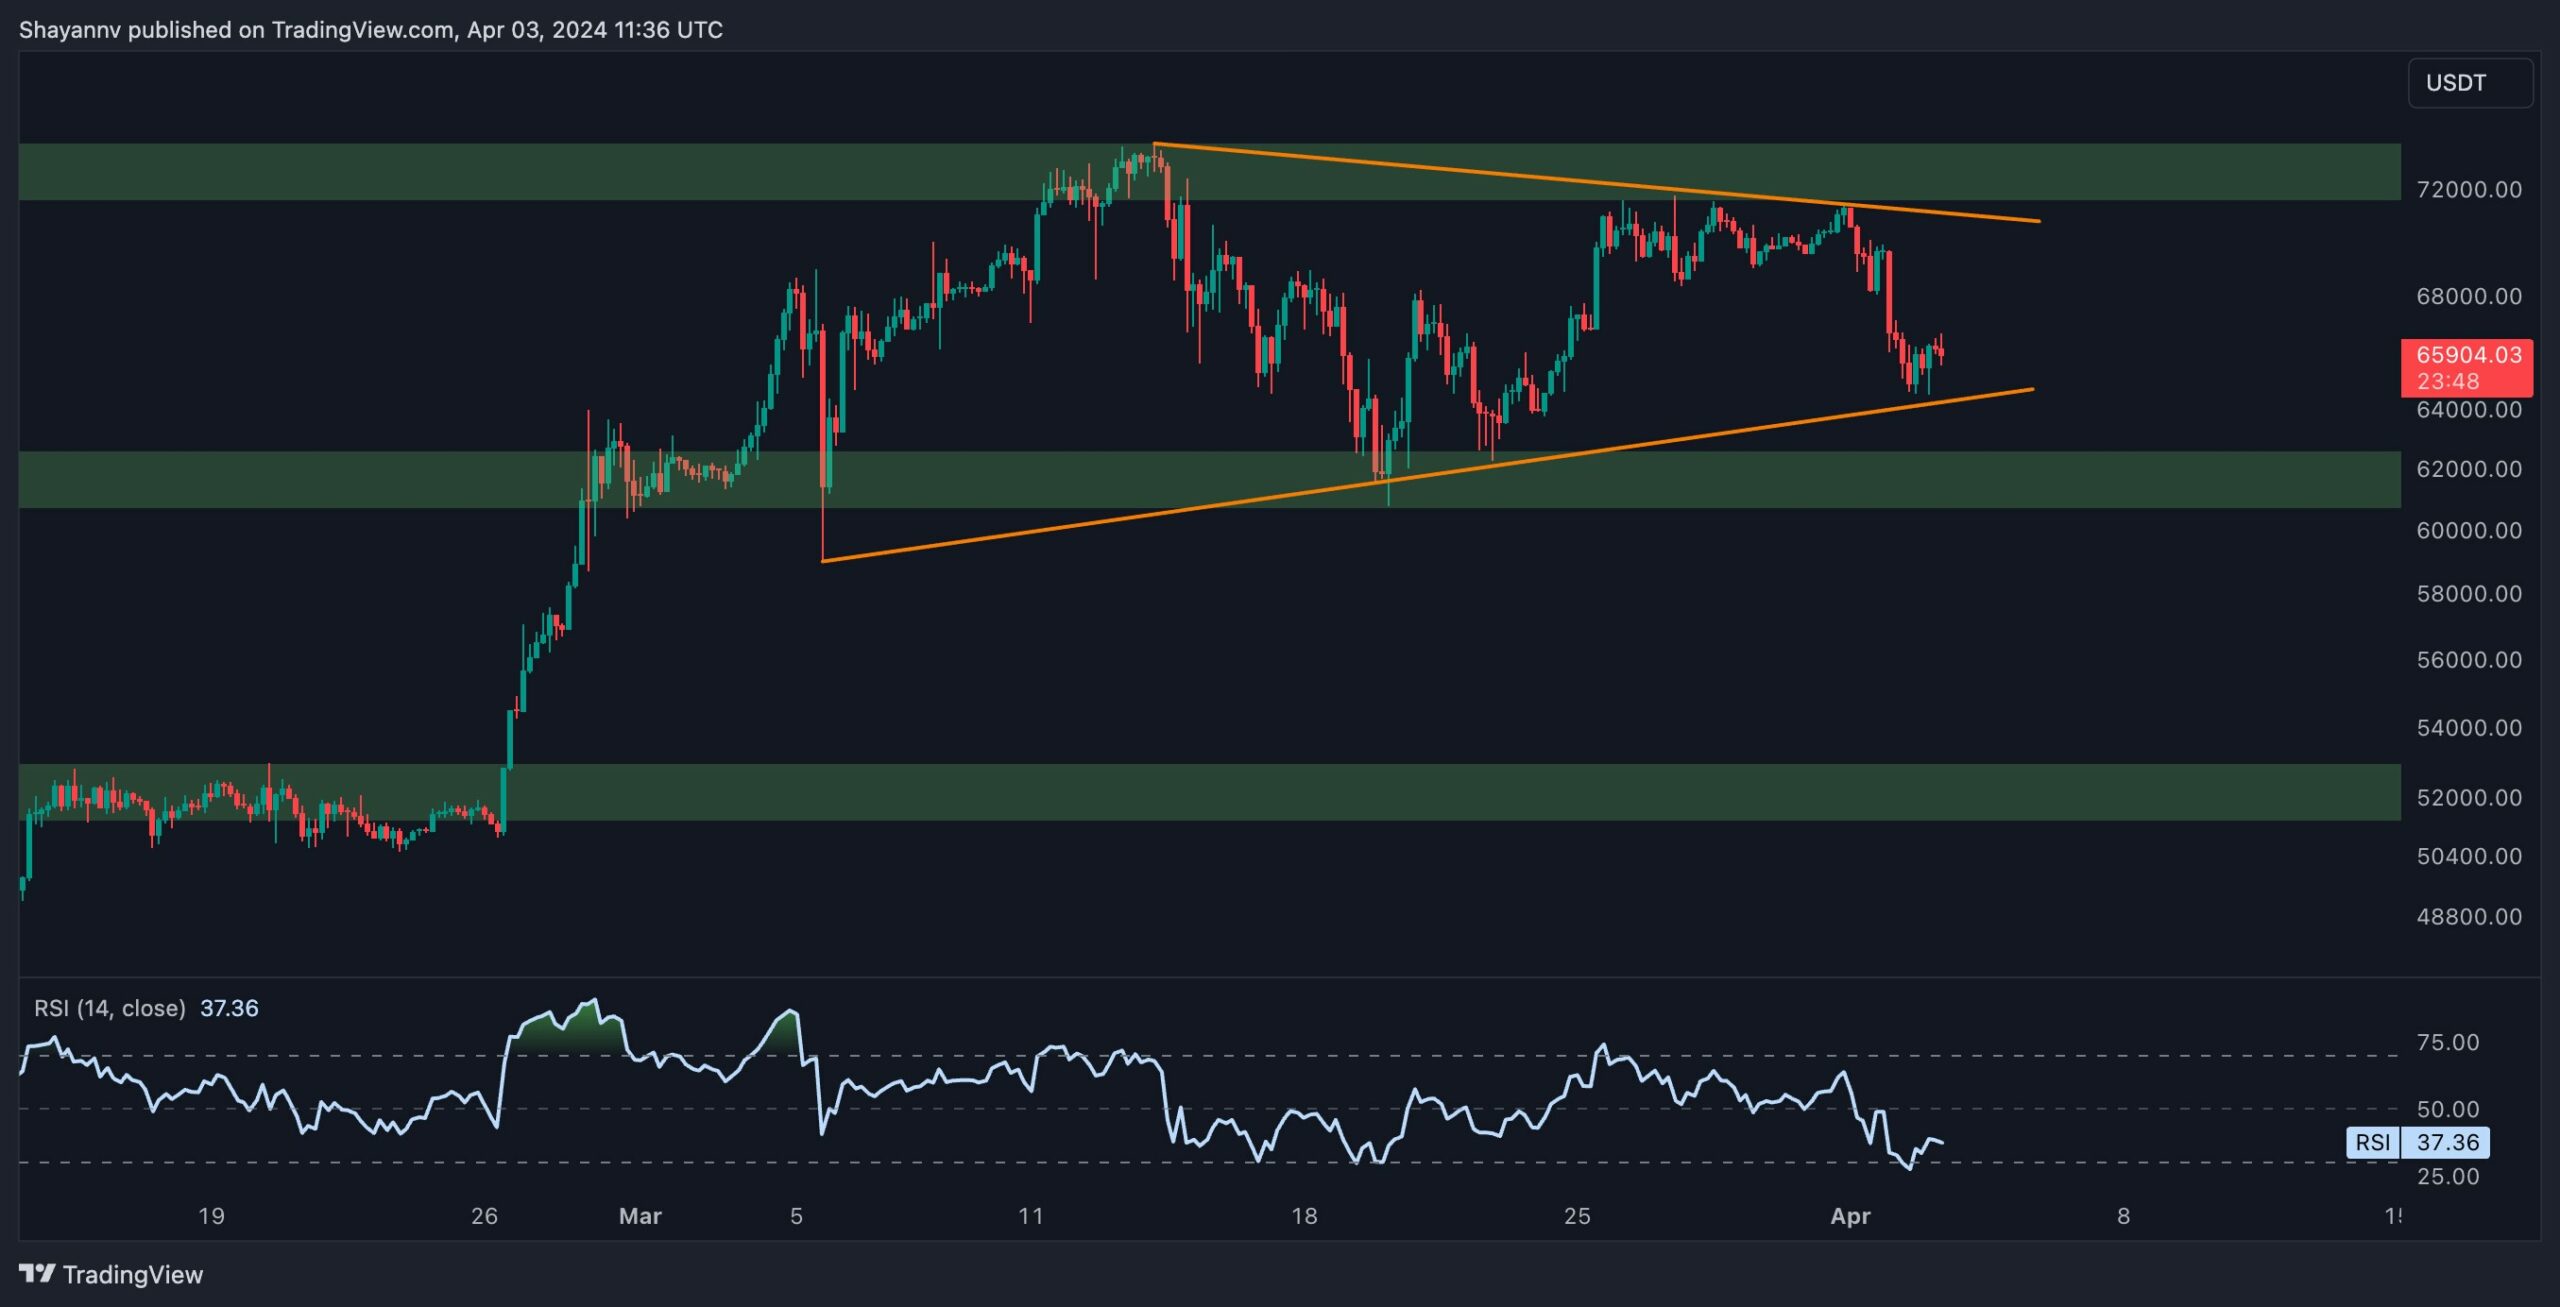
Analysis of the 4-hour chart reveals intensified selling pressure as Bitcoin attempted to reclaim the upper boundary of the sideways wedge, corresponding to the crucial $70K resistance.
This resulted in a significant bearish reversal, driving BTC’s price towards the lower trendline of the wedge, approximately at $64K, as anticipated in our last analysis.
Currently, Bitcoin sellers are striving to breach the lower boundary of the sideways wedge. However, if buyers regain control and the price finds support near this crucial level, a bullish rebound towards the $70K mark could ensue.
Conversely, if selling pressure persists and the price breaches the pattern’s lower boundary, an extension of the bearish retracement towards the $62K region becomes increasingly likely.
By Shayan
Bitcoin has recently undergone a pullback, witnessing a decline towards the $64K level. Assessing whether this correction has resulted in a cooling down of the futures market can provide valuable insights for investors.
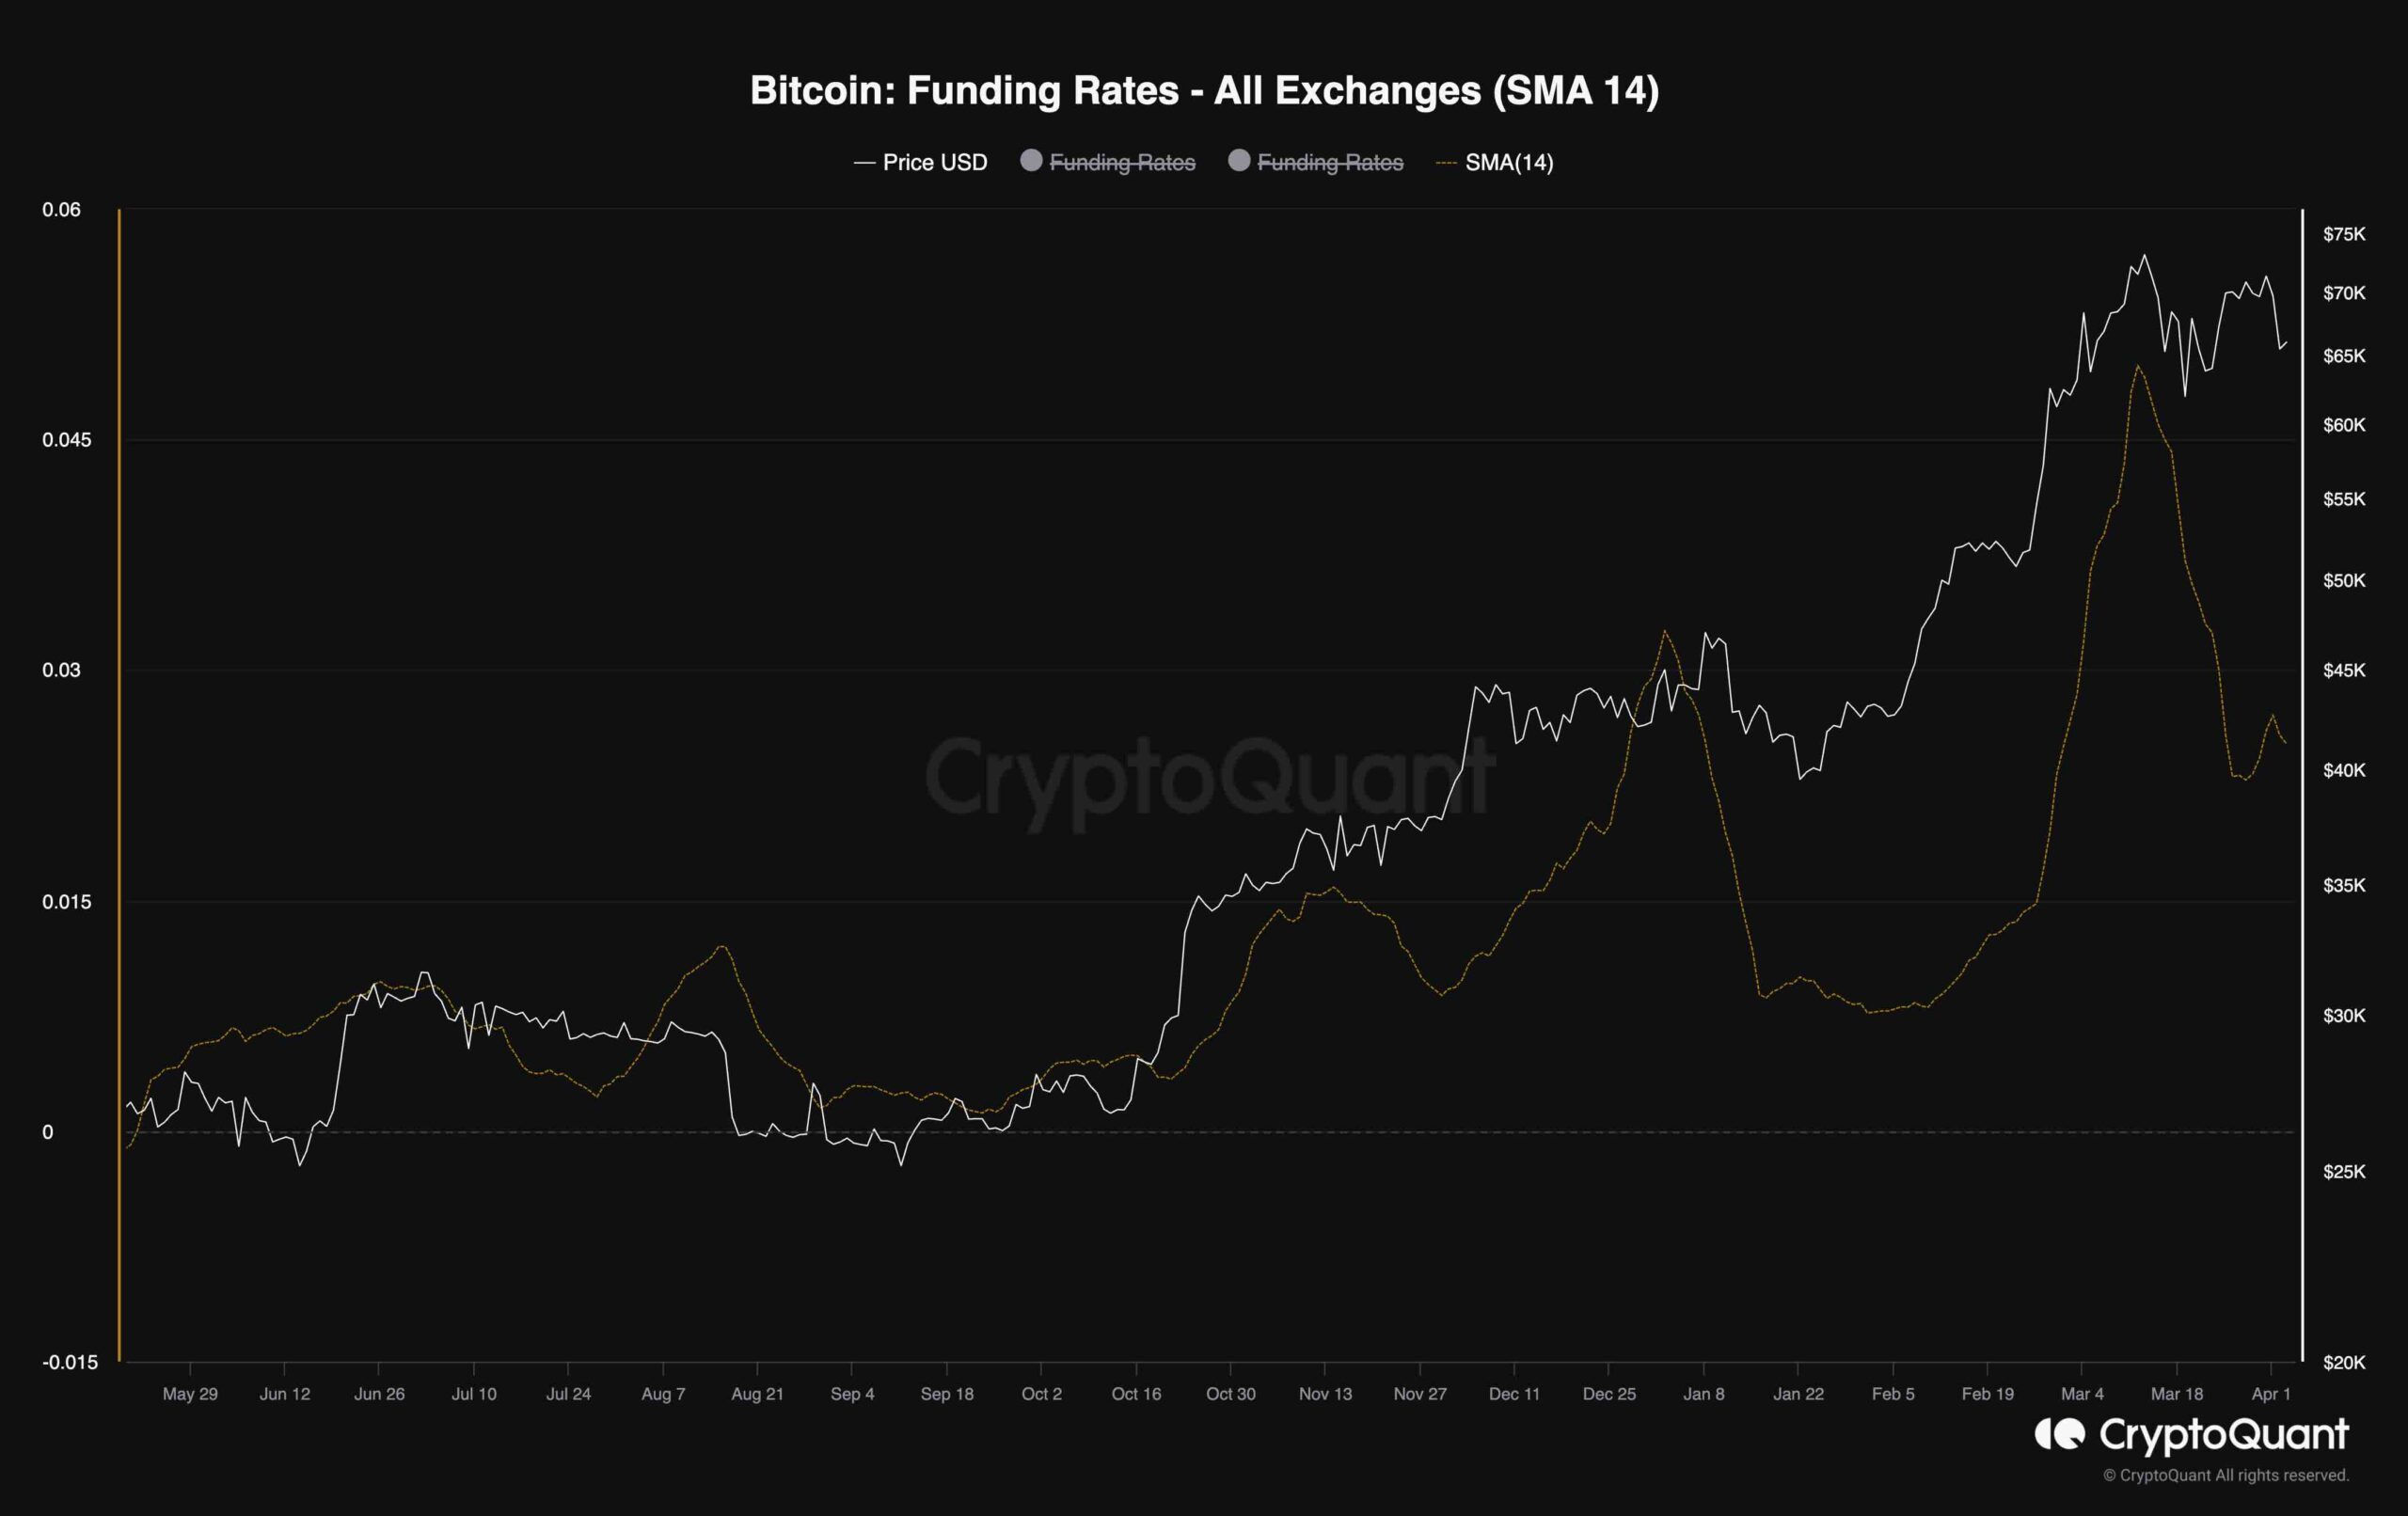
The chart presented illustrates Bitcoin funding rates, which serve as indicators of whether buyers or sellers are executing their orders more aggressively. While positive funding rates are essential, elevated values can raise concerns, often leading to a cascade of long liquidations.
Observing the chart, it becomes apparent that the price has undergone corrective retracements recently. This has triggered a notable decrease in funding rates following a substantial surge in early February. This decline suggests a shift in the futures market from an overheated state to a phase of cooling down.
Such a development can be interpreted as positive in the long term, as it alleviates the pressure for further liquidations and fosters conditions conducive to a sustainable uptrend. Consequently, investors may find reassurance in this shift, as it potentially signals a healthier market environment in a broader view.