Bitcoin has enjoyed a nice rally during the last few months: From December’s low of $3,120 (Bitstamp), the price rallied to $13,880, providing an impressive 250% ROI in approximately six months.
In this analysis post, we are going to focus on the bigger picture.
Since hitting that $13,880 resistance level, which was a long-term 61.8% Fibonacci retracement level from the 2018 all-time high, the BTC price was held by the bears below resistance.
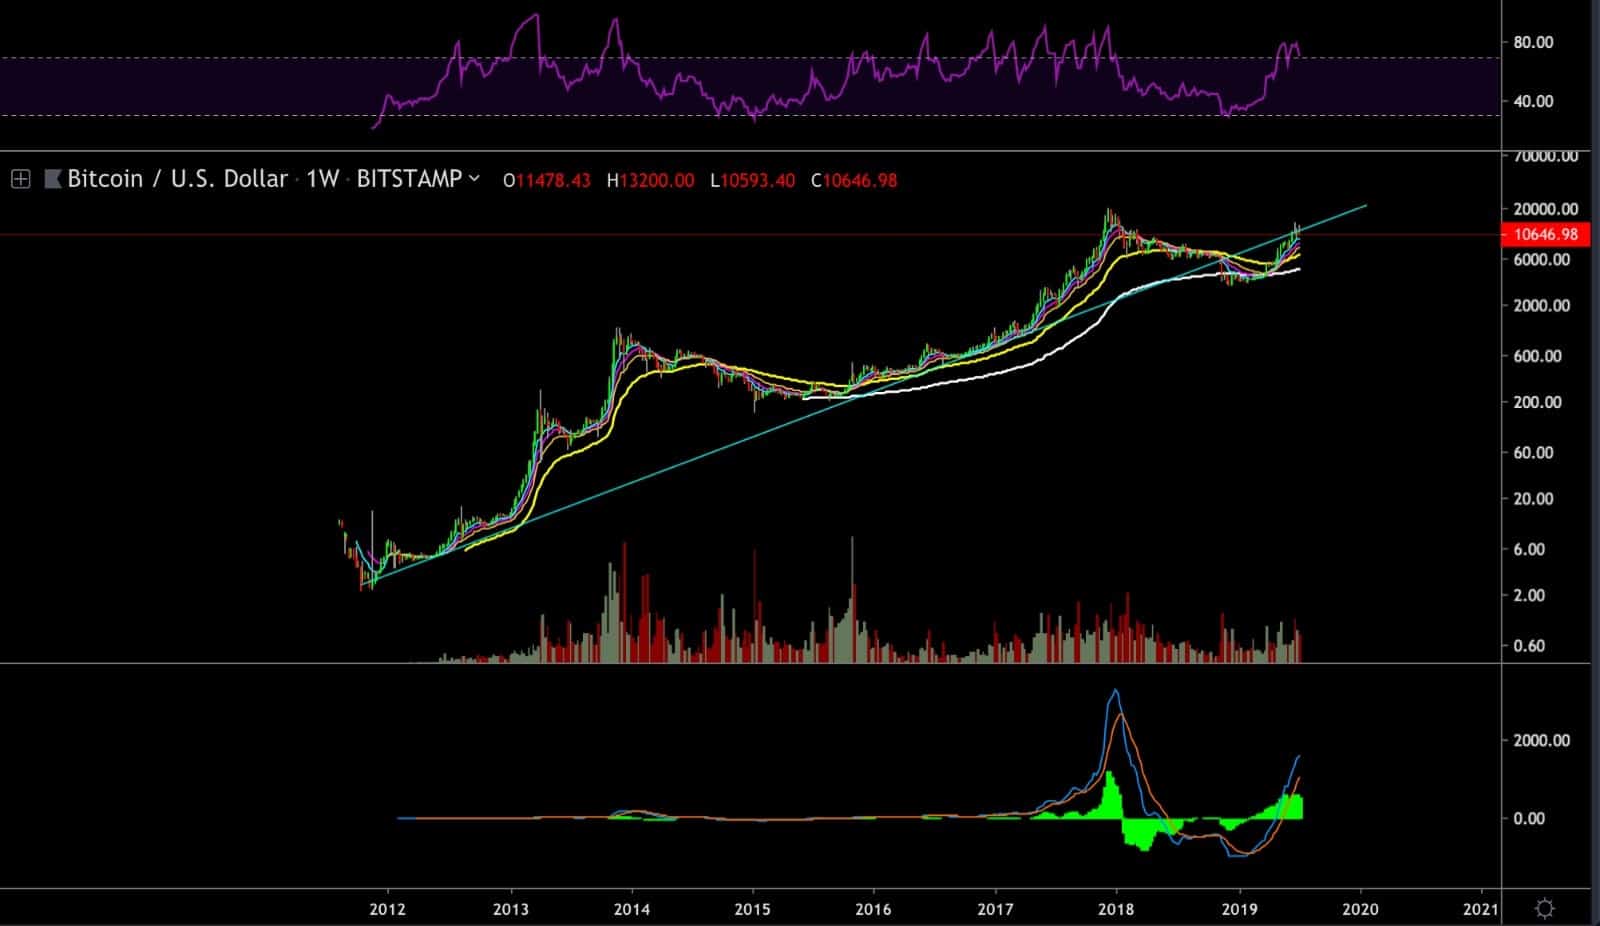
Looking at the logarithmic weekly chart, we note the blue trend line which has supported the Bitcoin price ever since.
This trend line started forming seven years ago, after BTC began trading on Bitstamp in November 2011.
The line was broken for the first time in November 2018 during the “crypto bubble burst” (as the mainstream ignorants like calling it) and the price remained below it for more than eight months. Last month, the BTC price met the famous trend line again, but this time as resistance rather than support. (It is well known that previous support often becomes resistance and vice versa.)
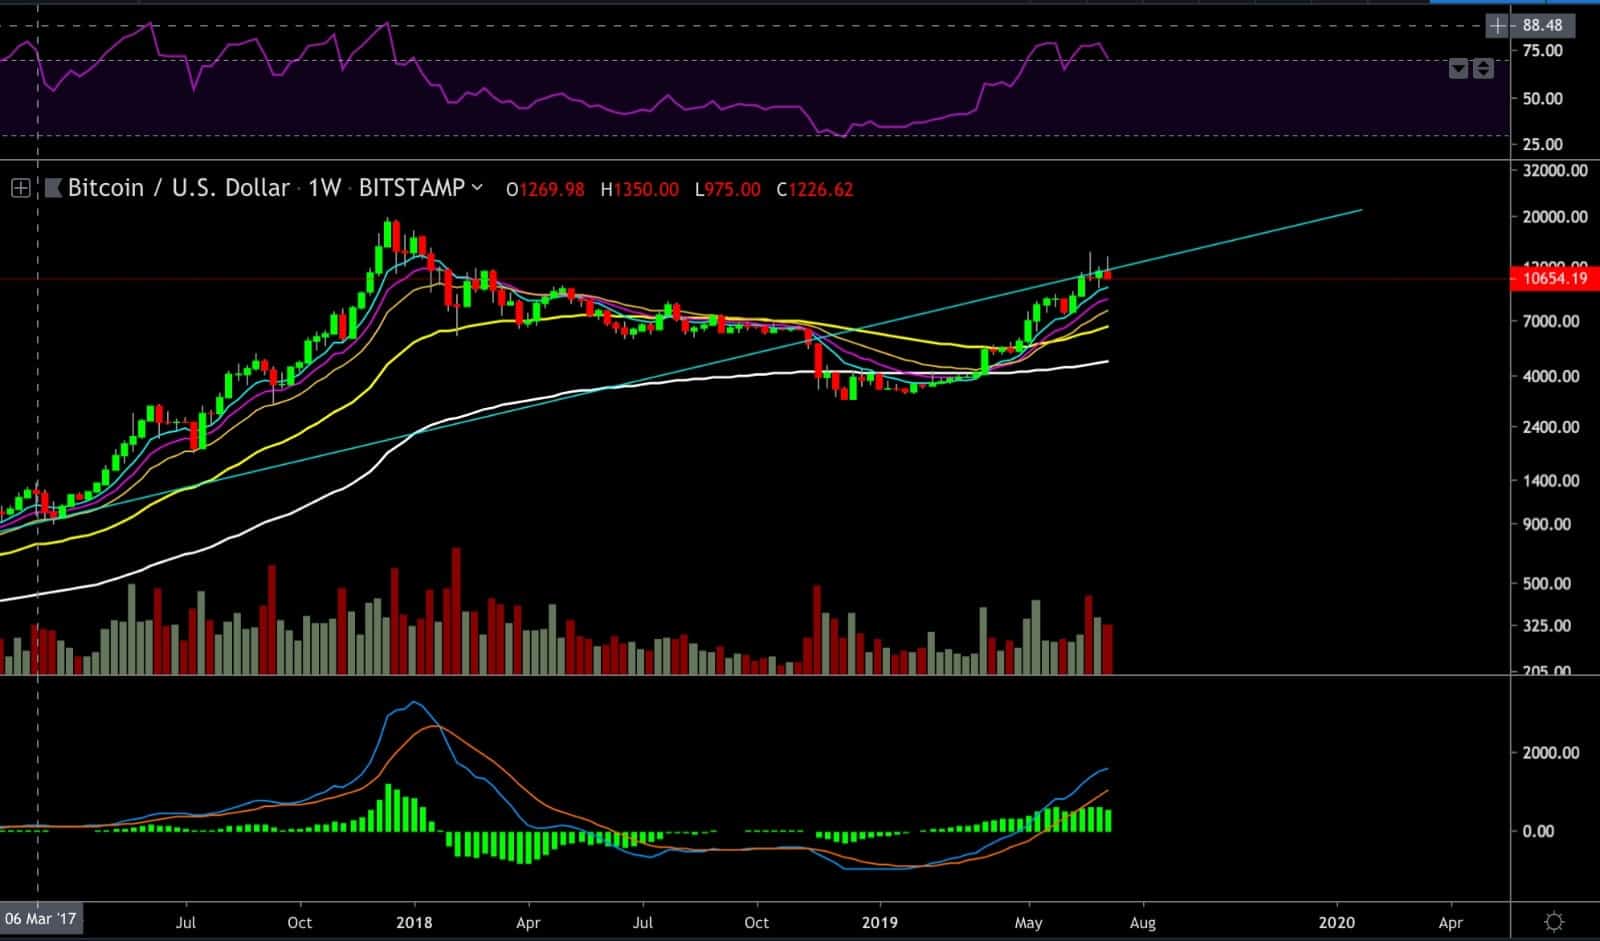
Also, notice on the following weekly chart that BTC might be experiencing a double top scenario with two shooting star candles/hanging man-type candles located exactly at the aforementioned resistance level.
The latter is a significant signal for a potential trend reversal and could mark the top of the recent 250% rally.
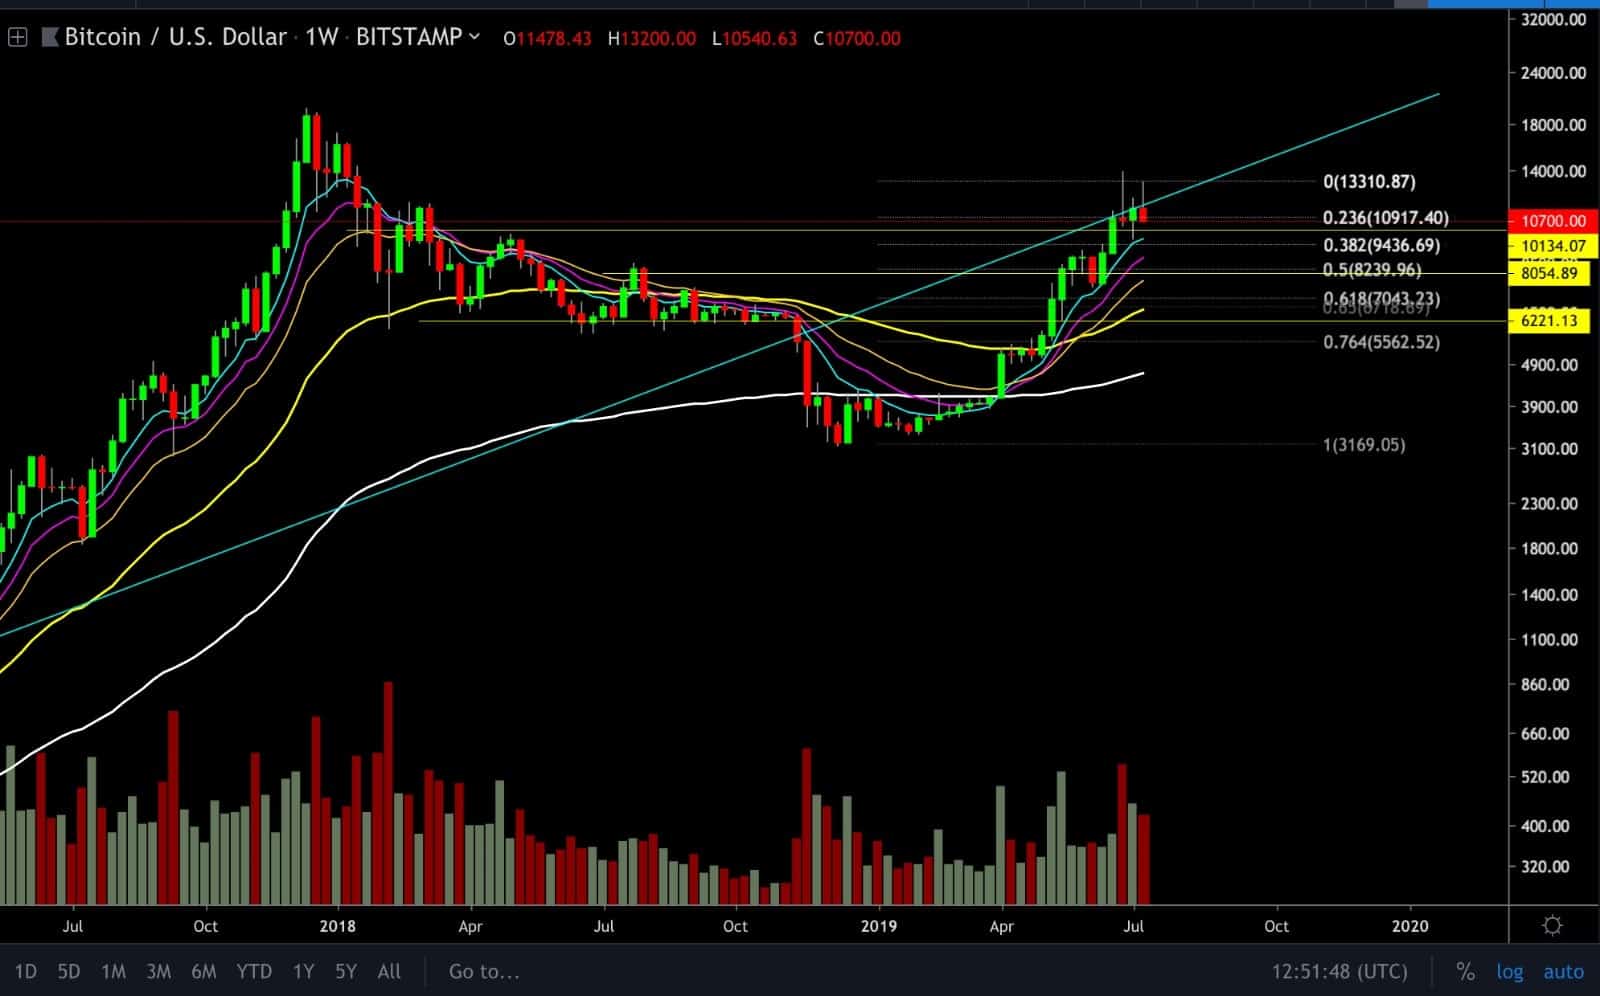
BTC could quickly retest the $10,000 price level and, if this mental support level were broken, continue declining to $8,300, $7,000 or even $6,200. Time will tell.
The 0.618 Fibonacci retracement level of the last rally is waiting at $7,000.
We note as well that the red volume candles are getting larger, which is another bearish signal.
On the other hand, if the BTC price breached the $13,880 resistance level, then it would very likely run to $16,000 or even retest the ATH of $19,700. This scenario is less likely, based on the technical signs which lay before us.
These are exciting times for crypto and Bitcoin in particular, but we must remember that assets move in waves, as no asset moves straight up or down forever. A correction is a healthy part of any asset’s life span, especially after a 250% rally.