Binance Coin saw a slight decrease of around 1% over the past 24 hours and it currently trades at $20.31. Despite the recent decline, BNB is still up by a total of 21% over the past two weeks and a 60% increase over the past 30 days.
The cryptocurrency struggles despite the constant announcements that come from Binance. In fact, just recently, the CEO of the exchange, Changpeng Zhao, shared a tweet that outlines the accomplishments of the company in the past 24 hours alone.
Binance Coin is the eighth-largest cryptocurrency with a market cap of $3.19 billion.
Looking at the BNB/USD 1-Day Chart:
- Since our previous BNB analysis, Binance Coin continued to struggle to break above the resistance at $20.92. This resistance is bolstered by the 100-days EMA and has proven difficult for BNB to overcome over the past 5 attempts. BNB still remains heavily supported at $19.80.
- From above: The nearest level of resistance lies directly at $20.92. Above $21, resistance lies at $21.94 which is reinforced by the 200-days EMA. If the bulls manage to overcome this level, resistance can be expected at $22.74, $23.47, $24.16, and $24.52.
- From below: The nearest level of support lies at $19.80. Beneath this, support is found at $18.86, $18.16, $18.00, $17.30, $16.11, and $15.54.
- The trading volume has started to decline during November.
- The RSI has recently dipped lower but remains above the 50 level which shows that the bulls still remain in charge over the market momentum.
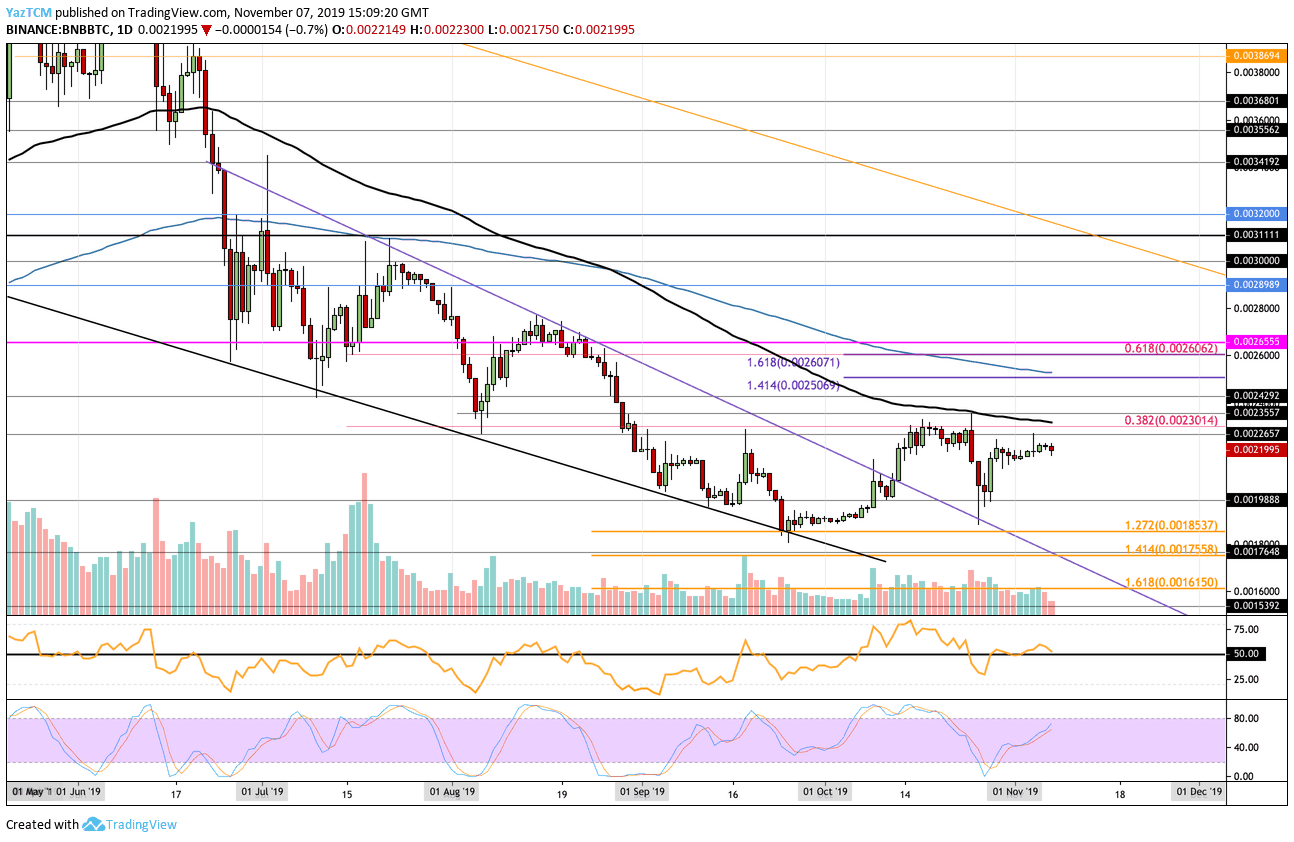
Looking at the BNB/BTC 1-Day Chart:
- Against Bitcoin, BNB rolled over from the resistance at 0.0023 BTC (provided by a bearish .382 Fib Retracement) but managed to find support at 0.001988 BTC. From there, the cryptocurrency rebounded higher as it trades at 0.0021995 BTC.
- From above: The nearest level of resistance lies at 0.0022 BTC. Above this, resistance is found at 0.0023 BTC (100-days EMA) 0.002355 BTC, 0.002492 BTC, and 0.00251 BTC (200-days EMA).
- From below: The nearest levels of support lie at 0.0021 BTC and 0.0020 BTC. Beneath this, support can be expected at 0.001988 BTC, 0.0019 BTC, 0.001853 BTC, and 0.0018 BTC.
- The trading volume remains high but is slowly diminishing.
- The RSI is trading at the 50 level which shows indecision within the market. For a bullish press, we must see the RSI rise above the 50 level to show that the bulls are in charge of the market momentum.
SPECIAL OFFER (Sponsored)
LIMITED OFFER 2024 for CryptoPotato readers at Bybit: Use this link to register and open a $500 BTC-USDT position on Bybit Exchange for free!
Disclaimer: Information found on CryptoPotato is those of writers quoted. It does not represent the opinions of CryptoPotato on whether to buy, sell, or hold any investments. You are advised to conduct your own research before making any investment decisions. Use provided information at your own risk. See Disclaimer for more information.
Cryptocurrency charts by TradingView.