Binance Coin saw a notable increase of around 4.5% over the past 24 hours and it currently trades at $21.26. This caused BNB to be the best performing top-10 altcoin over the past 24 hours. BNB is also up 16.25% over the past month.
Binance Coin remains the seventh-largest cryptocurrency with a market cap of $3.30 billion.
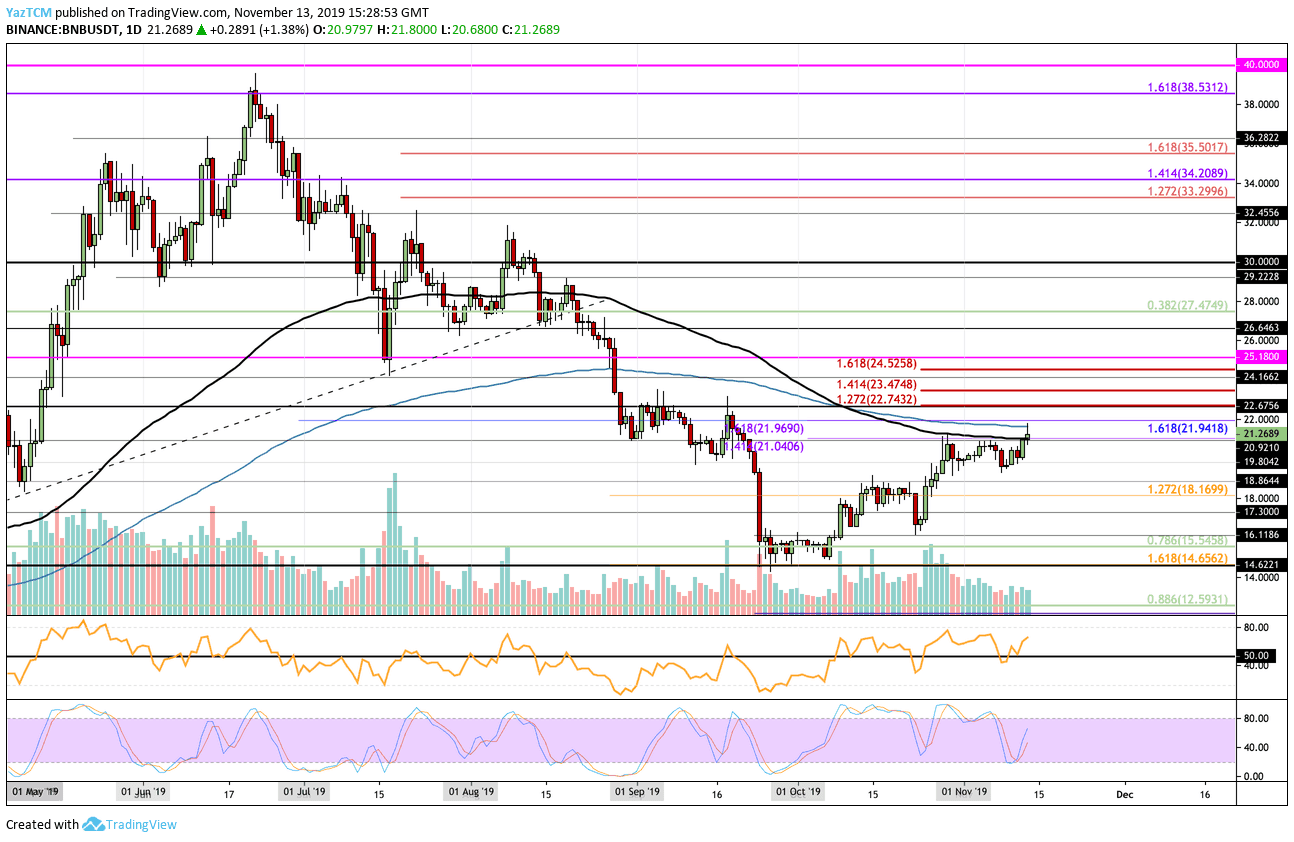
Looking at the BNB/USD 1-Day Chart:
- Since our previous BNB analysis, Binance Coin finally climbed above the resistance at $21.04 which is provided by the 100-days EMA. BNB now faces immediate resistance at the 200-days EMA which lies directly above.
- From above: The nearest level of resistance is at the 200-days EMA. Above this, resistance lies at $22, $22.74, $23.47, $24.16, and $24.52. If the bulls continue above $25, resistance is located at $25.18, $26, $26.64, and $27.47.
- From below: The nearest level of support lies at $21. Beneath this, support can be expected at $20.92, $20, $19.80, $18.86, and $18.16. If the selling continues beneath $18, support lies at $17.30, $16.11, and $15.54.
- The trading volume has remained pretty high during November.
- The RSI is above the 50 level to show that the bulls remain in control over the market momentum. The Stochastic RSI has recently produced a bullish crossover signal which is a strong positive signal.
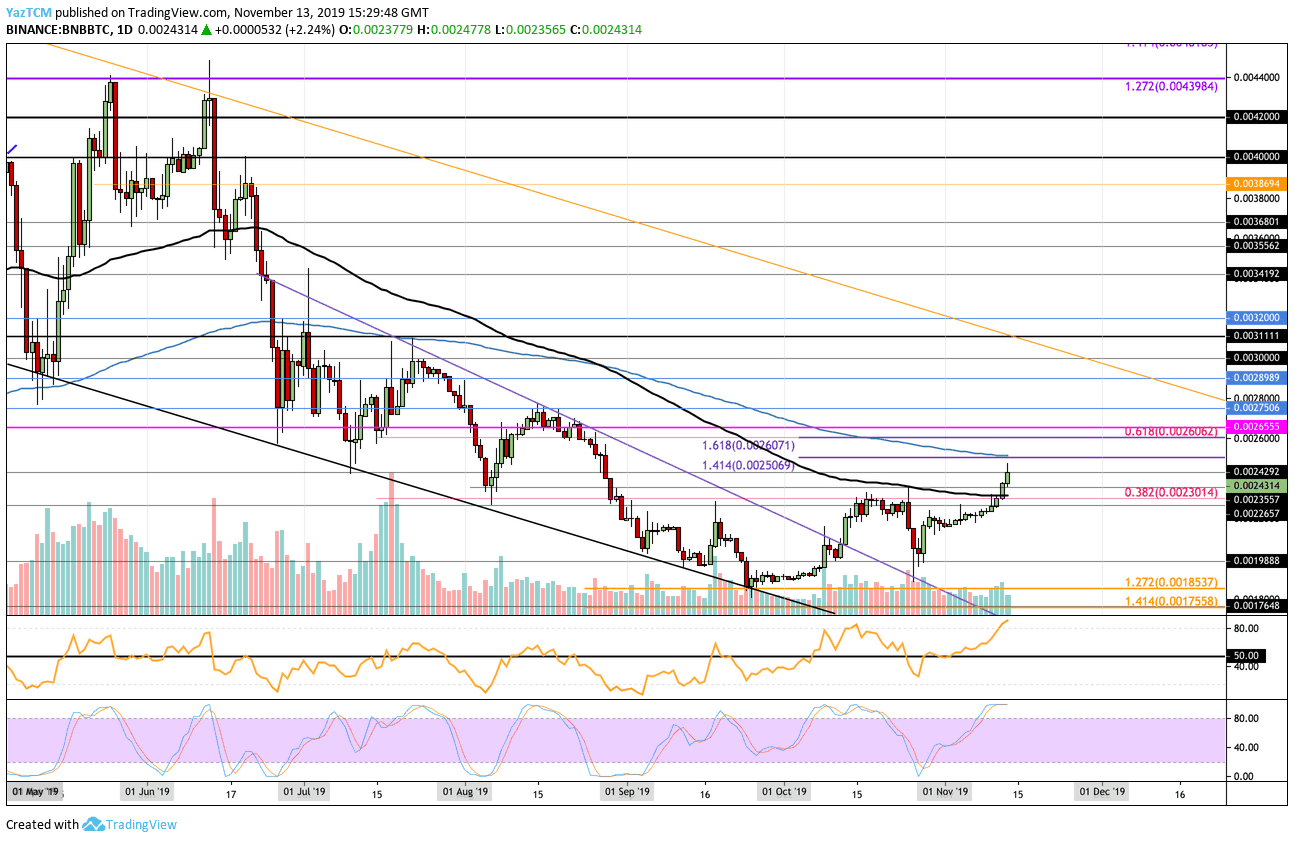
Looking at the BNB/BTC 1-Day Chart:
- Against Bitcoin, BNB managed to break above the resistance at 0.002265 BTC and continued higher above the 100-days EMA to reach the current resistance level of 0.002492 BTC.
- From above: The nearest level of resistance lies at 0.002492 BTC. Above this, resistance lies at 0.0025 BTC and 0.002607 BTC which is bolstered by a bearish .618 Fibonacci Retracement level. Higher resistance is found at 0.002655 BTC, 0.00275 BTC, 0.0028 BTC, and 0.0029 BTC.
- From below: The nearest level of support lies at 0.002355. Beneath this, support is located at 0.0023 BTC (100-days EMA), 0.002265 BTC, 0.0022 BTC, 0.002155 BTC, and 0.0021 BTC.
- The trading volume has remained at an average level during November.
- The RSI is well above the 50 level to show the bulls dominate the market momentum. The Stochastic RSI is warning traders to remain cautious as it trades in overbought conditions and is primed for a bearish crossover signal.
SPECIAL OFFER (Sponsored)
LIMITED OFFER 2024 for CryptoPotato readers at Bybit: Use this link to register and open a $500 BTC-USDT position on Bybit Exchange for free!
Disclaimer: Information found on CryptoPotato is those of writers quoted. It does not represent the opinions of CryptoPotato on whether to buy, sell, or hold any investments. You are advised to conduct your own research before making any investment decisions. Use provided information at your own risk. See Disclaimer for more information.
Cryptocurrency charts by TradingView.