Binance Coin saw a slight increase of around 1.11% over the past 24 hours and it currently trades at $18.21. This small growth follows a much larger 14.55% surge over the past 2 weeks. Despite the recent rebound, BNB still faces a long road to recovery after suffering a 35% plummet over the last 3 months.
Binance Coin remains the seventh-largest cryptocurrency with a market cap of $2.85 billion.
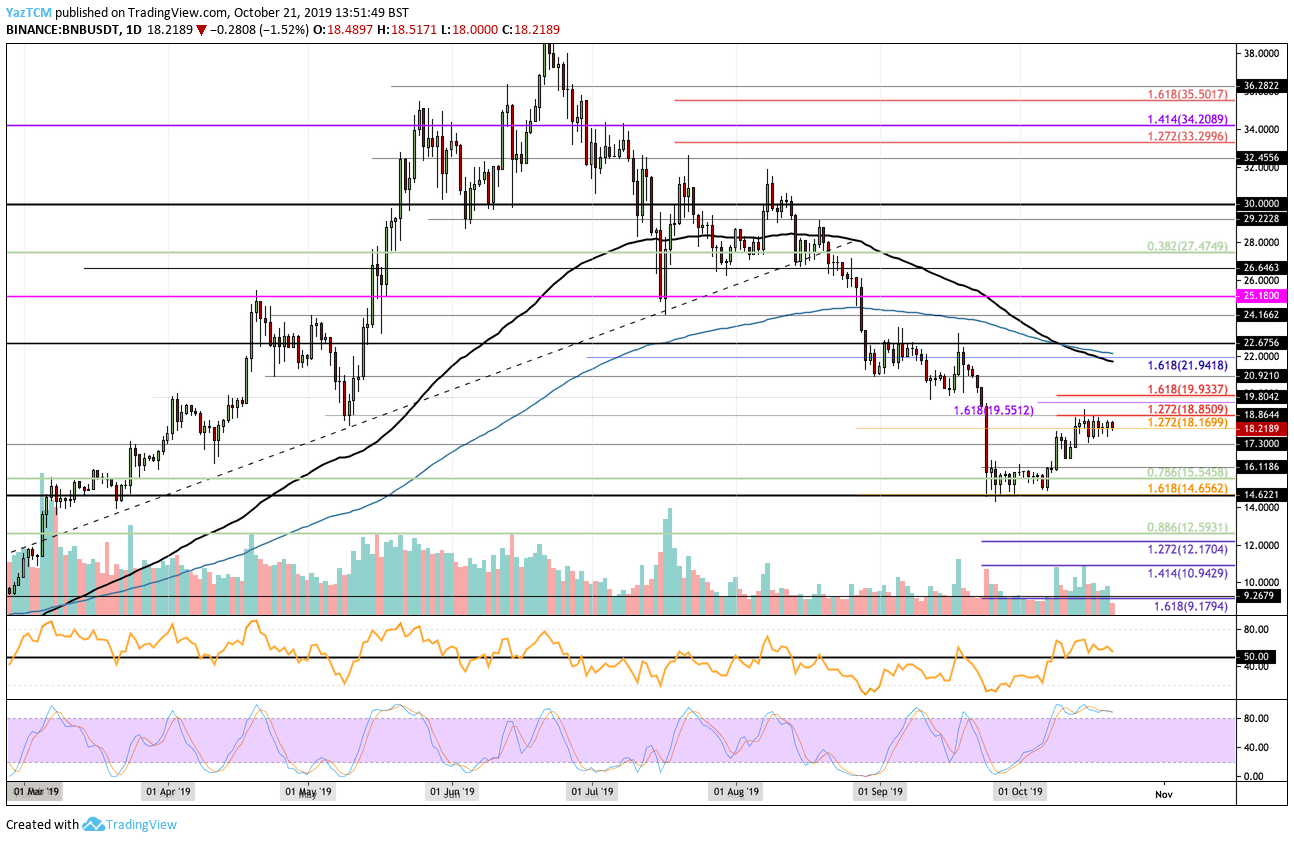
Looking at the BNB/USD 1-Day Chart:
- Since our previous BNB analysis, Binance Coin continued to trade sideways, unable to break above the resistance at $18.85. The bulls continue to hold strong but the market is indicating that it may roll-over and fall soon.
- From above: The nearest level of resistance lies at $18.85 (1.272 Fib Extension). Above this, resistance lies at $19.55 and $19.93 (1.618 Fib Extension). If the bulls break above $20, resistance is located at $21.73 (100-days EMA), $22, and $22.25 (200-days EMA).
- From below: The nearest level of support lies at $18.16. Beneath this, support is found at $18, $17.30, $17, $16.11, and $15.54. If the sellers continue to drive the price lower, support can be expected at $14.65 (September support), $14, and $12.59.
- The trading volume has been increasing during October.
- The RSI is above the 50 level but is diminishing which shows that the buyers are losing control over the market momentum. Furthermore, the Stochastic RSI is primed for a bearish crossover signal which should sen the market lower.
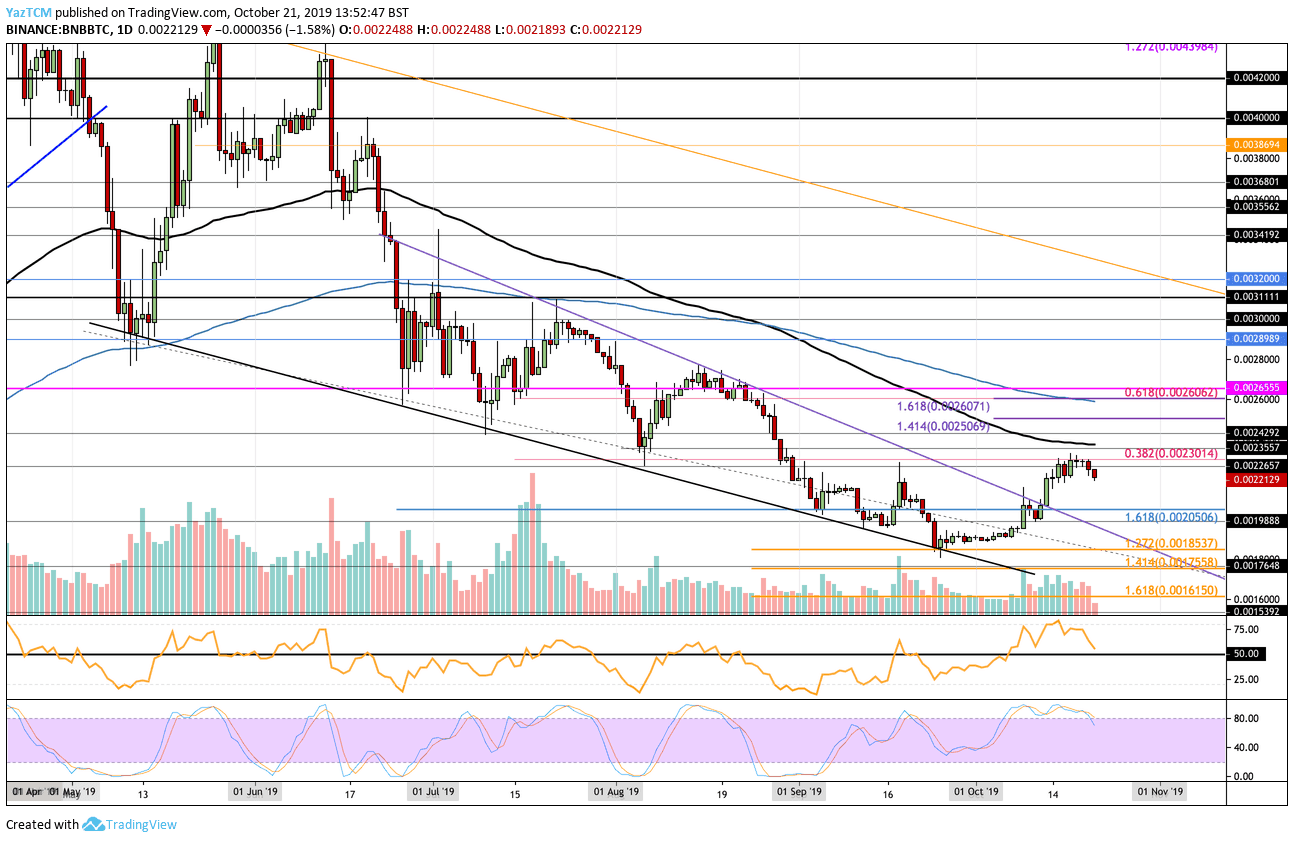
Looking at the BNB/BTC 1-Day Chart:
- Against Bitcoin, the resistance at 0.0023 BTC (provided by bearish .382 Fib Retracement) proved to be too strong for the bulls, causing BNBBTC to drop to the current price of 0.002212 BTC.
- From above: The nearest level of resistance lies directly at 0.0023 BTC. Above this, resistance can be found at 0.002360 BTC (100-days EMA), 0.002492 BTC, 0.002509 BTC (1.414 Fib Extension), and 0.002607 BTC (1.618 Fib Extension). The resistance at 0.0026 is bolstered by the bearish .618 Fib Retracement.
- From below: The nearest levels of support lie at 0.0022 BTC and 0.0021 BTC. Beneath this, support is located at 0.002 BTC, 0.00195 BTC, and 0.0019 BTC. If the selling continues lower, support can be expected at 0.001853 BTC and 0.001755 BTC.
- The trading volume has increased in October but is starting to fall.
- The RSI has returned back toward the 50 level which shows indecision between the bulls and the bears. Additionally, the Stochastic RSI has produced a bearish crossover signal which should send the market lower.
SPECIAL OFFER (Sponsored)
LIMITED OFFER 2024 for CryptoPotato readers at Bybit: Use this link to register and open a $500 BTC-USDT position on Bybit Exchange for free!
Disclaimer: Information found on CryptoPotato is those of writers quoted. It does not represent the opinions of CryptoPotato on whether to buy, sell, or hold any investments. You are advised to conduct your own research before making any investment decisions. Use provided information at your own risk. See Disclaimer for more information.
Cryptocurrency charts by TradingView.