Binance Coin saw a 3.20% price decline over the past 24 hours and it currently trades at around $15.08. BNB suffered heavily over the past month after falling below $22 and losing a total of 31%. Furthermore, over the past 3 months, Binance Coin has lost a precipitous 55%. If BNB breaks beneath the support at $14.50, we could see the coin head toward $12.
BNB is the eighth-largest cryptocurrency with a market cap of $2.36 billion.
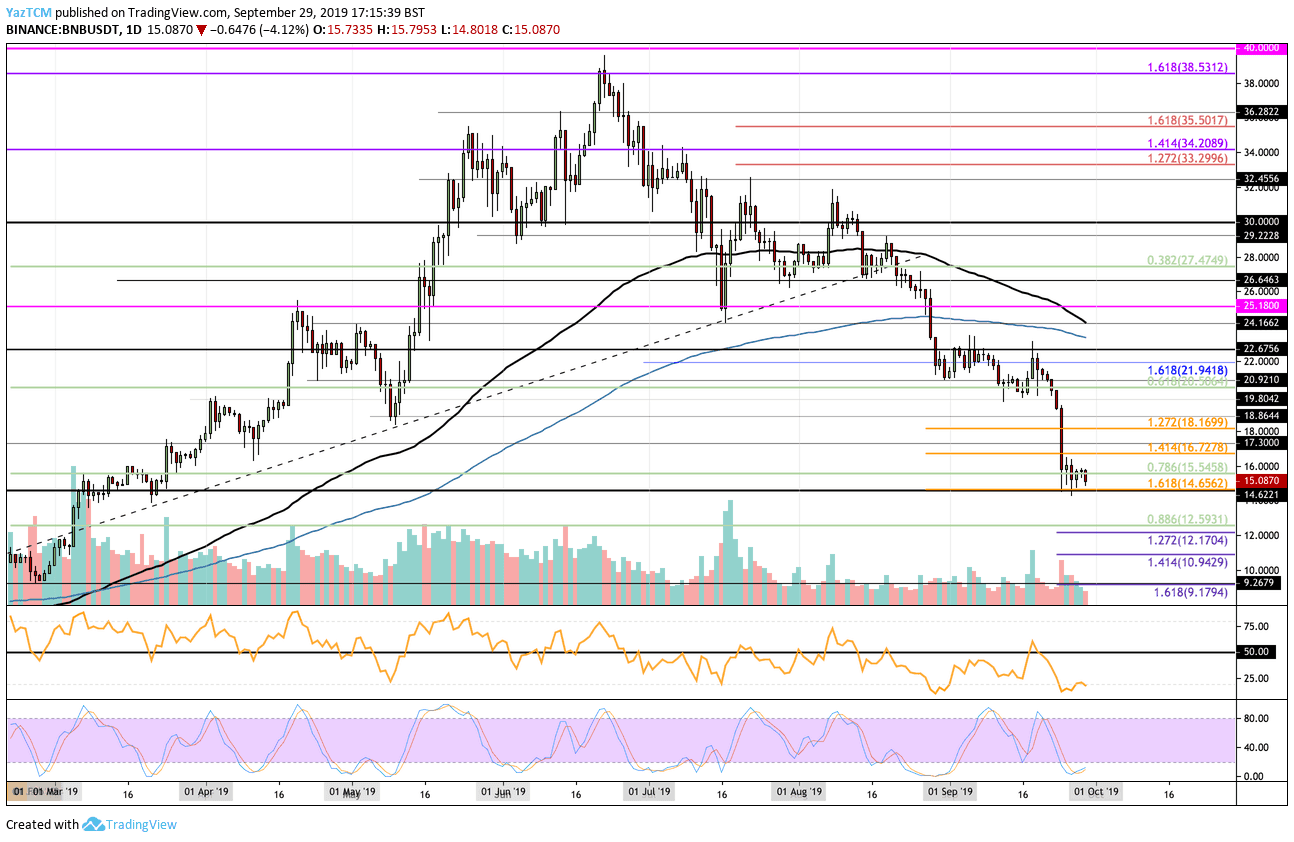
Looking at the BNB/USD 1-Day Chart:
- Since our previous BNB analysis, BNB rebounded from the support at $14.62 but was unable to go above $16. BNB has rolled-over as it looks to re-test the support at $14.65.
- From above: The nearest levels of resistance lie at $15.54 and $16.00. Above $16, higher resistance is expected at $16.72, $17.30, $18.16, $19, $19.80, and $20.
- From below: The nearest level of support lies at $14.65. If the sellers break beneath this, we will be heading much lower. Beneath $14.65, support is expected at $14, $13.50, and $13.00. Lower support is located at $12.17 (downside 1.272 Fib Extension), $12.00, $11.50, and $10.92 (downside 1.414 Fib Extension).
- The trading volume remains at the average level for the past few months.
- The RSI has plummetted to oversold conditions which shows the sellers are in complete control over the market momentum. The Stochastic RSI is also in extremely oversold conditions and is primed for a bullish crossover signal to push the market higher.
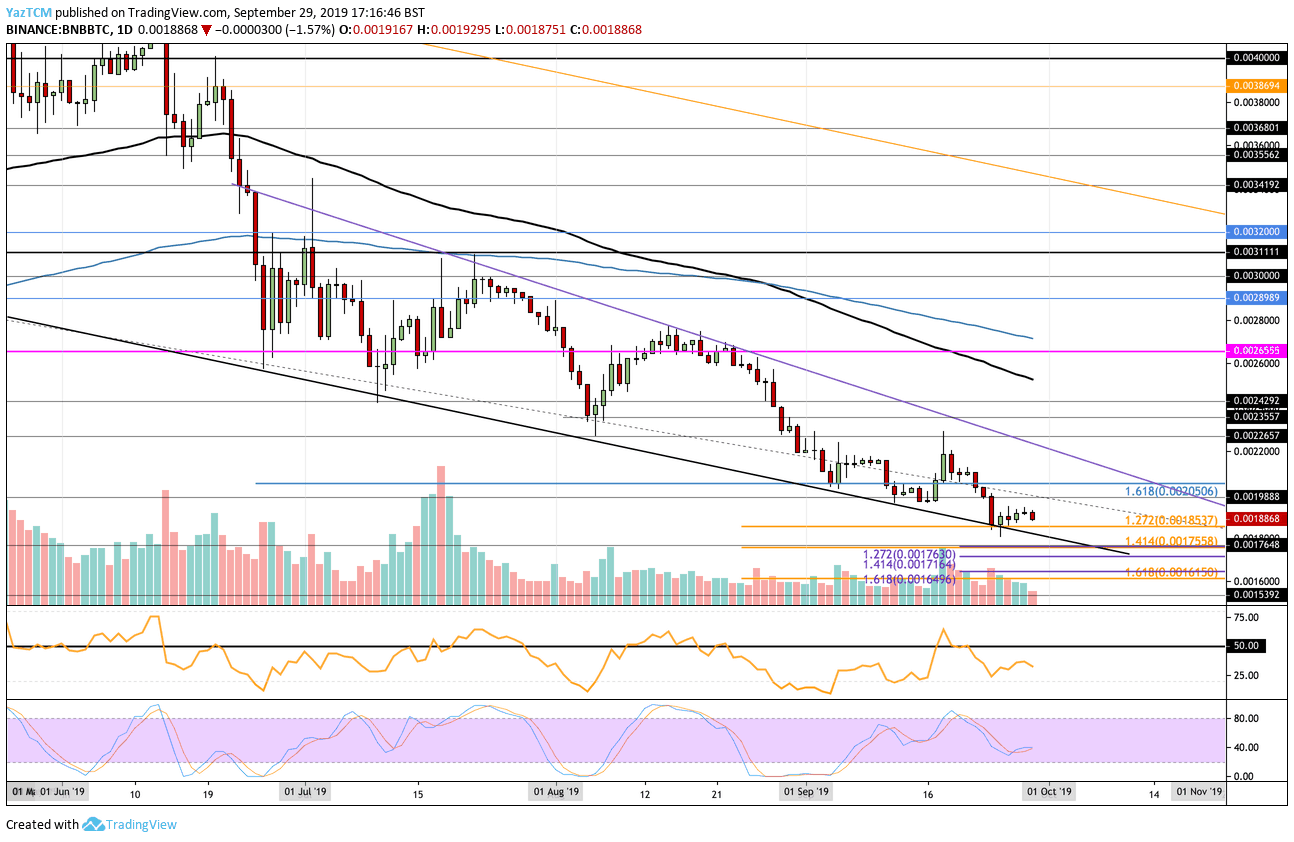
Looking at the BNB/BTC 1-Day Chart:
- Against Bitcoin, BNB is looking to retest the support at 0.001853 BTC. BNB had rebounded here but failed to make any movement above 0.0019 BTC before rolling over. BNB has been trapped within a steep descending price channel for the past few months.
- From above: The nearest level of resistance lies at 0.0019 BTC. Above this, higher resistance lies at 0.001988 BTC, 0.0020 BTC, 0.00215 BTC, and 0.0022 BTC.
- From below: The nearest level of support lies at 0.001853 BTC. Beneath this, support lies at the lower boundary of the descending trading channel at around 0.001815 BTC. Lower support is found at 0.0017588 BTC (downside 1.414 Fib Extension), 0.001716 BTC, and 0.0017 BTC.
- The trading volume remains at a steady average level.
- The RSI is beneath the 50 level which shows that the sellers are in control over the market momentum. To recover, we will need to see the RSI rise and break above the 50 level.
SPECIAL OFFER (Sponsored)
LIMITED OFFER 2024 for CryptoPotato readers at Bybit: Use this link to register and open a $500 BTC-USDT position on Bybit Exchange for free!
Disclaimer: Information found on CryptoPotato is those of writers quoted. It does not represent the opinions of CryptoPotato on whether to buy, sell, or hold any investments. You are advised to conduct your own research before making any investment decisions. Use provided information at your own risk. See Disclaimer for more information.
Cryptocurrency charts by TradingView.