Binance Coin saw a small price decline of around 0.48% over the past 24 hours and it currently trades at $18.34. However, the cryptocurrency is now down by about 13% over the past week and by 30% over the past 90 days, making it the weakest performing altcoin out of the top 10 projects.
Binance Coin is now the eighth-largest cryptocurrency with a market cap of $2.88 billion.
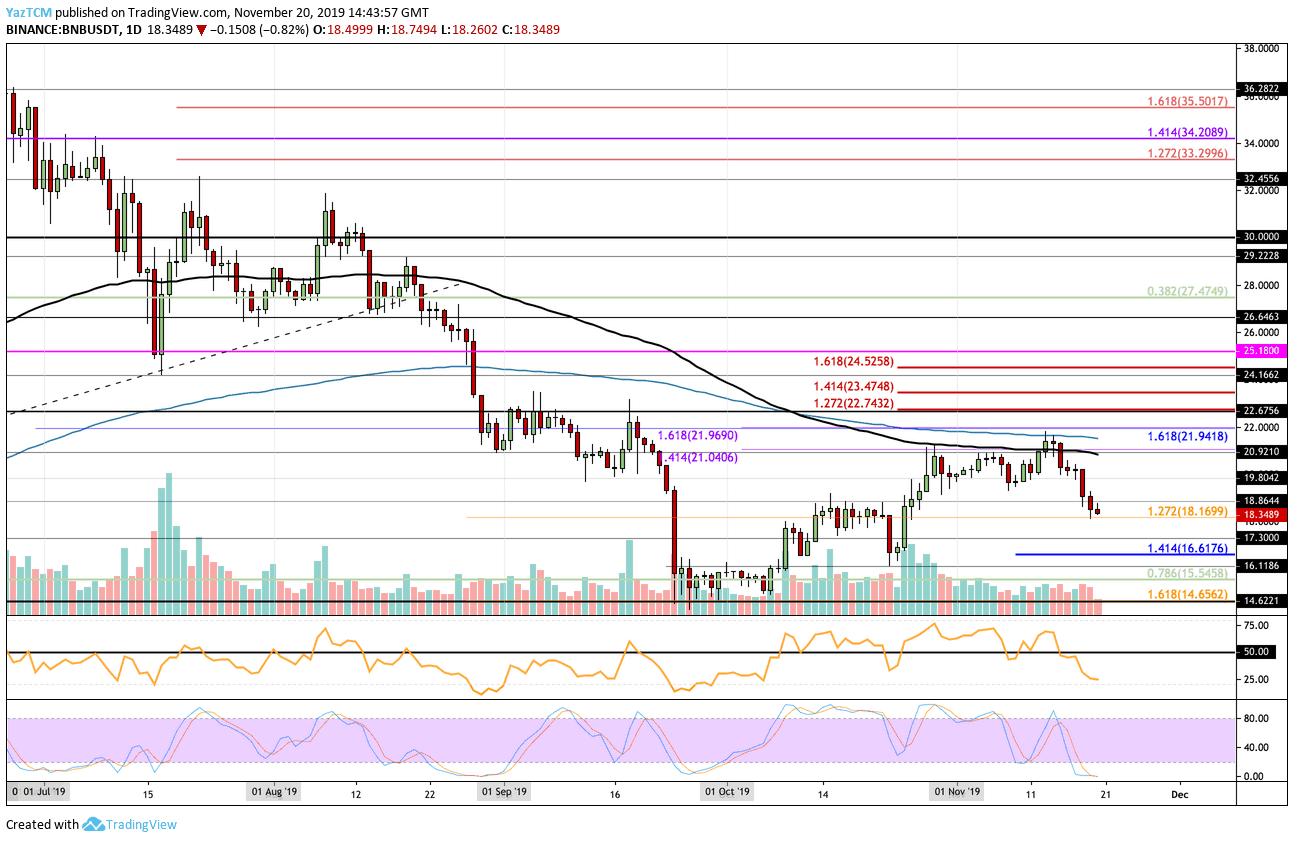
Looking at the BNB/USD 1-Day Chart:
- Since our previous analysis, BNB rolled over at the resistance provided by the 200-days EMA and started to fall. It continued to drop beneath $20 until finding the current support at $18.16.
- From above: The nearest level of resistance lies at $18.64 and $19. Above this, resistance is at $19.80 and $20. If the bulls can climb above $20, resistance is located at $20.92 (100-day EMA) and $21.80 (200-days EMA).
- From below: The nearest levels of support lie at $18.16 and $18. Beneath $18, support is expected at $17.30, $17, $16.61, $16.11, and $16. If the selling proceeds beneath $16, support is found at $15.54, $15, and $14.65.
- The trading volume remains at the average level for the month.
- The RSI is in oversold territory which shows that the bulls control the market momentum. However, the Stochastic RSI is shaping up for a bullish crossover which should send the market higher.
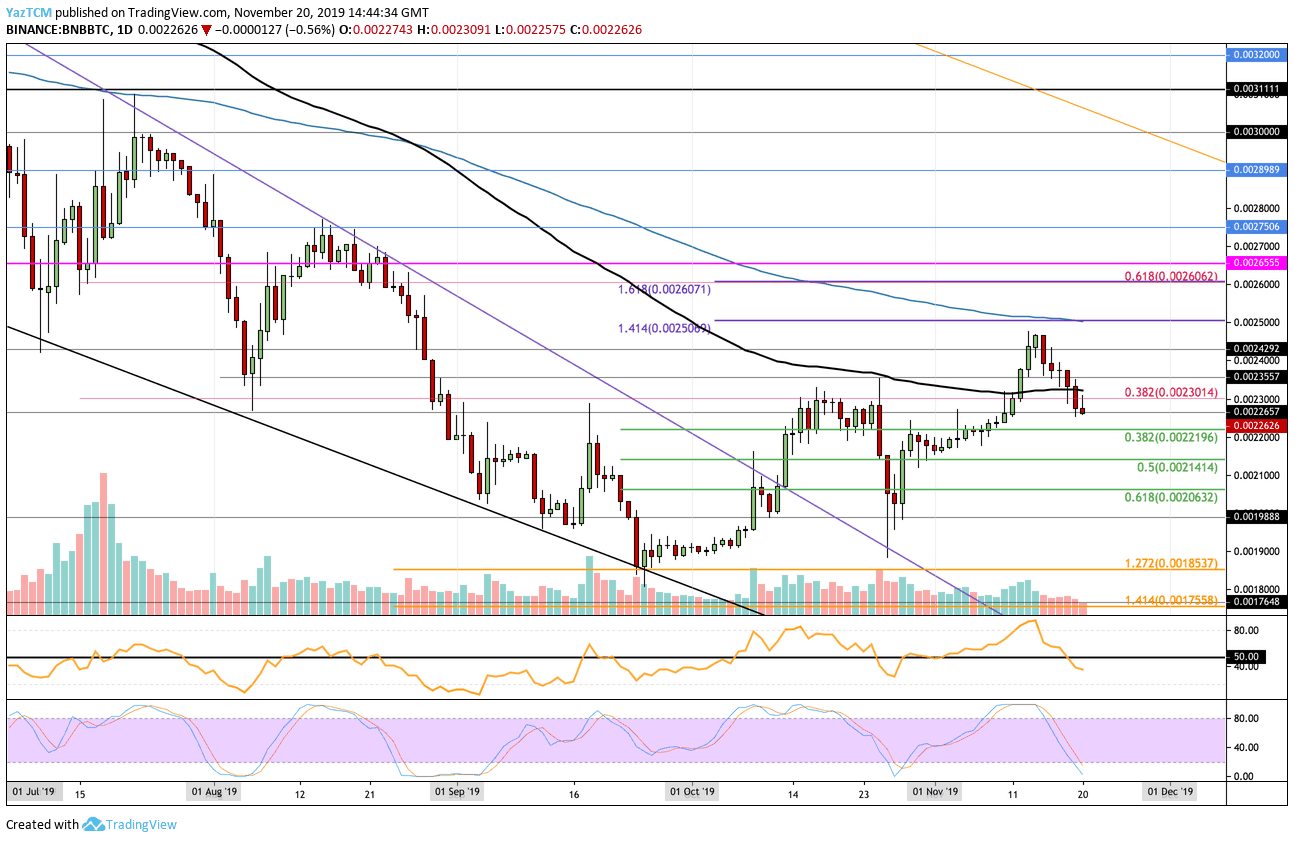
Looking at the BNB/BTC 1-Day Chart:
- Against Bitcoin, BNB failed to make it anywhere near the 0.0025 BTC level. It dropped beneath the support at 0.0023 BTC (provided by the 100-days EMA) and continued to decrease towards the current support at 0.002261 BTC.
- From above: The nearest level of resistance lies at 0.0023 BTC. Above this, resistance is found at 0.002355 BTC, 0.0024 BTC, 0.002429 BTC, and 0.0025 BTC (200-days EMA).
- From below: The nearest level of support is located at 0.002219 BTC (.382 Fib Retracement). Beneath this, support lies at 0.0022 BTC, 0.002141 BTC, and 0.0020 BTC.
- The trading volume remains at an average level.
- The RSI recently broke beneath the 50 level to show that the sellers have started to take control over the market momentum. For a recovery to be seen, we would need to see the RSI rise back above the 50 level.
SPECIAL OFFER (Sponsored)
LIMITED OFFER 2024 for CryptoPotato readers at Bybit: Use this link to register and open a $500 BTC-USDT position on Bybit Exchange for free!
Disclaimer: Information found on CryptoPotato is those of writers quoted. It does not represent the opinions of CryptoPotato on whether to buy, sell, or hold any investments. You are advised to conduct your own research before making any investment decisions. Use provided information at your own risk. See Disclaimer for more information.
Cryptocurrency charts by TradingView.