Binance Coin has seen a period of relative inactivity over the past 30 days, as the coin’s price increased by a meager 4.5% to around $33.23. It reached a fresh ATH last month, nearly hitting $40. BNB has since rolled over but has been holding strong at $32.50 since the beginning of this month.
Binance Coin is currently the seventh-largest cryptocurrency by market value, with a market cap of $4.69 billion. BNB is still up by 460% on the year.
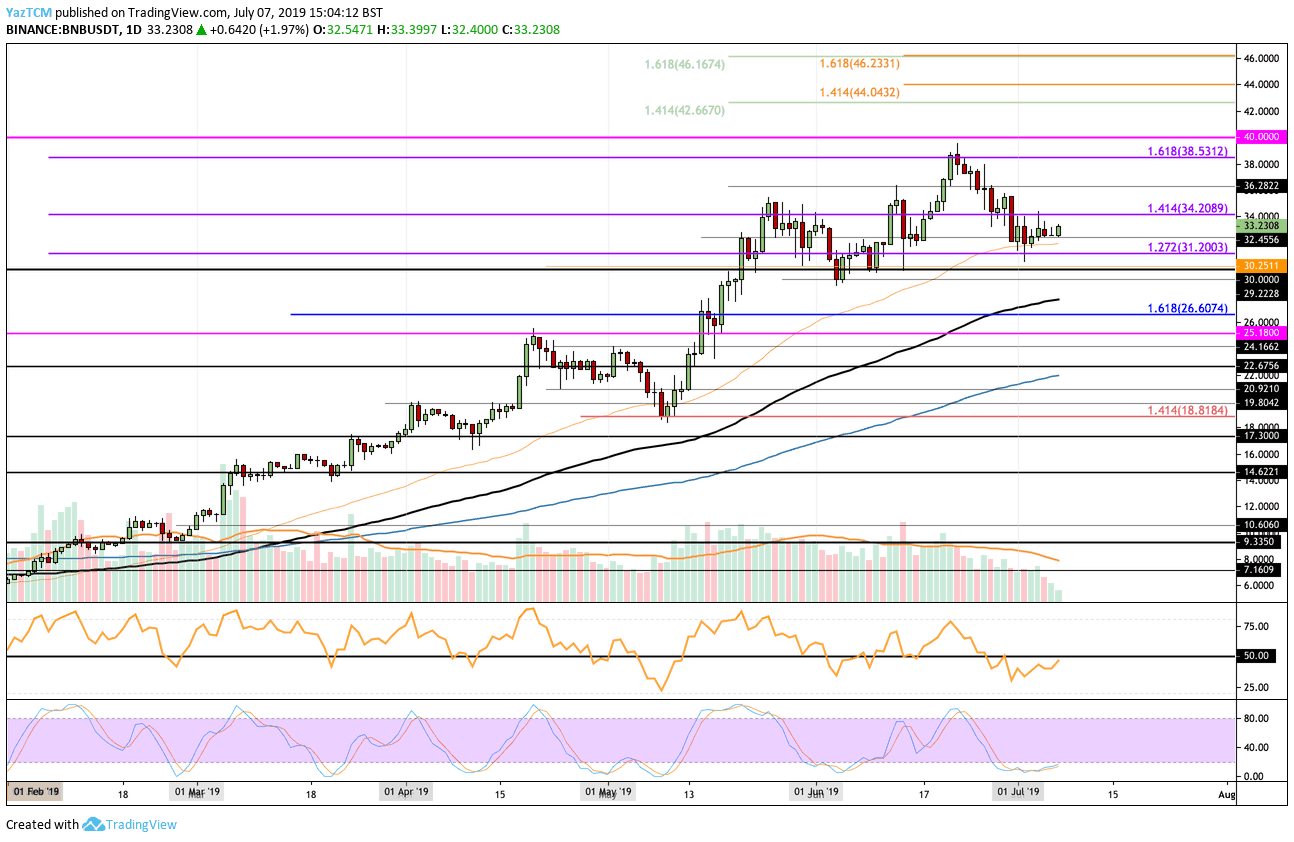
Looking at the BNB/USD 1-day chart:
- Binance Coin found strong support at $32.45 in June. This area of support is further bolstered by the 50-day EMA level, which hovers nearby.
- From above: The nearest levels of resistance lie at $34.20 and $35. Above $35, the next levels of resistance lie at $36.28, $38, $38.53, and at $39.59 – the previous ATH. If the bulls continue above $39.59 and push the price above $40, higher resistance can be found at $42, $42.66, $44.04, and $46.16.
- From below: The nearest levels of support lie at $32.45 and $31.20. Beneath this, the next levels of support are $31 and $30. If the sellers break below $30, lower support lies at $29.22 and $27.91, which contains the 100-day EMA.
- The trading volume has been diminishing in July.
- The Stochastic RSI has been in oversold territory for quite some time now as we wait for the bullish crossover signal to mark a push higher. The RSI itself has also approached the 50 level again, as we wait for a break above to signal that the bulls are in control of the market.
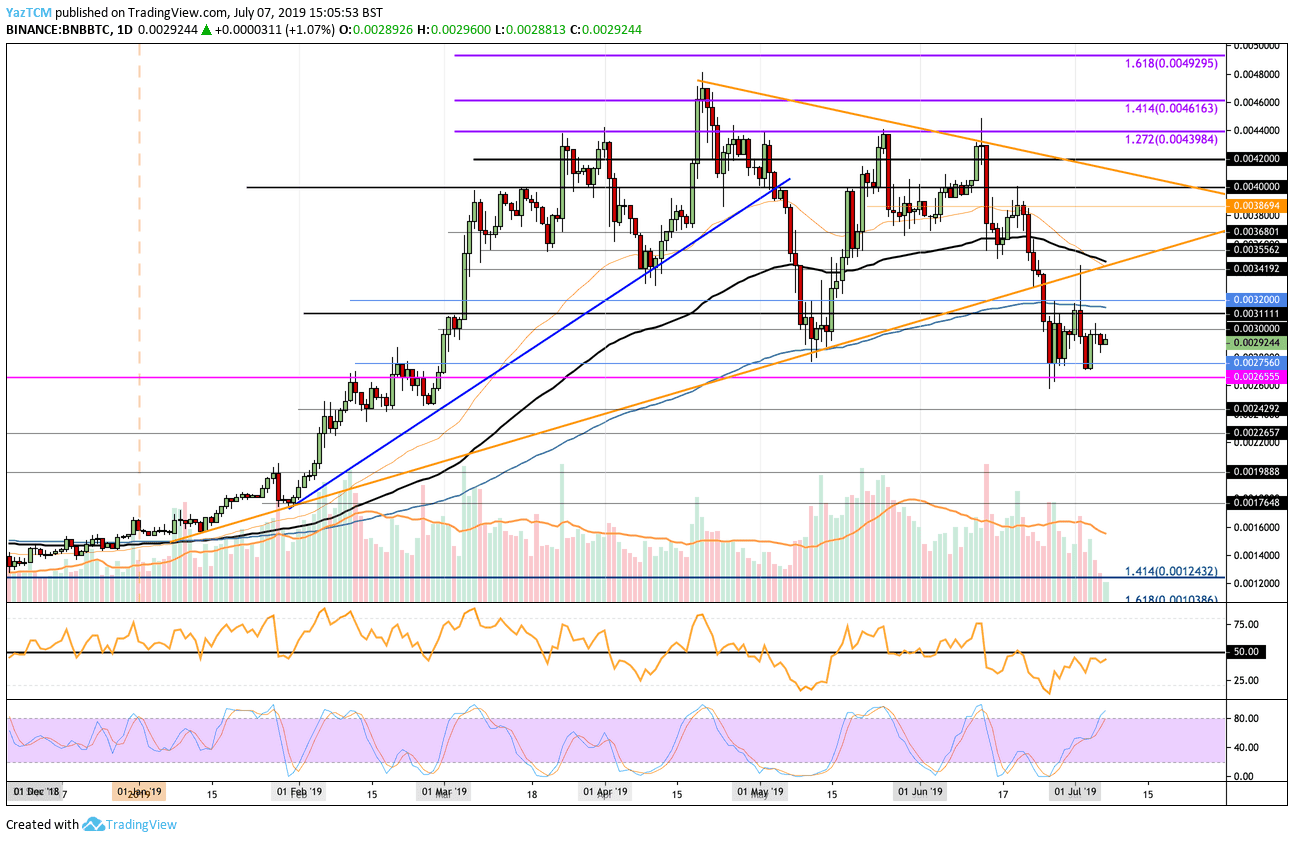
Looking at the BNB/BTC 1-day chart:
- Toward the end of June, the coin’s price fell below a very long-term consolidation pattern. BNB continued falling against BTC until strong support was found at 0.002756 BTC. It has since rebounded from this area and is trading at 0.002924 BTC.
- From above: The nearest level of resistance lies at 0.0030 BTC. Above this, higher resistance is located at 0.00311 BTC (contains the 200-day EMA) and 0.0032 BTC. If the bulls continue above 0.0032 BTC the next levels of resistance lie at 0.003420 BTC, 0.003556 BTC, 0.003680 BTC, and 0.0040 BTC.
- From below: The nearest level of support now lies at 0.002756 BTC. Beneath this, further support is located at 0.002655 BTC, 0.0026 BTC, 0.0025 BTC, and 0.002265 BTC.
- The trading volume has been slowly falling in this market throughout July.
- The RSI has returned to 50 from oversold. However, for a bullish signal, we will need to wait for the RSI to rise above 50.
SPECIAL OFFER (Sponsored)
LIMITED OFFER 2024 for CryptoPotato readers at Bybit: Use this link to register and open a $500 BTC-USDT position on Bybit Exchange for free!
Disclaimer: Information found on CryptoPotato is those of writers quoted. It does not represent the opinions of CryptoPotato on whether to buy, sell, or hold any investments. You are advised to conduct your own research before making any investment decisions. Use provided information at your own risk. See Disclaimer for more information.
Cryptocurrency charts by TradingView.