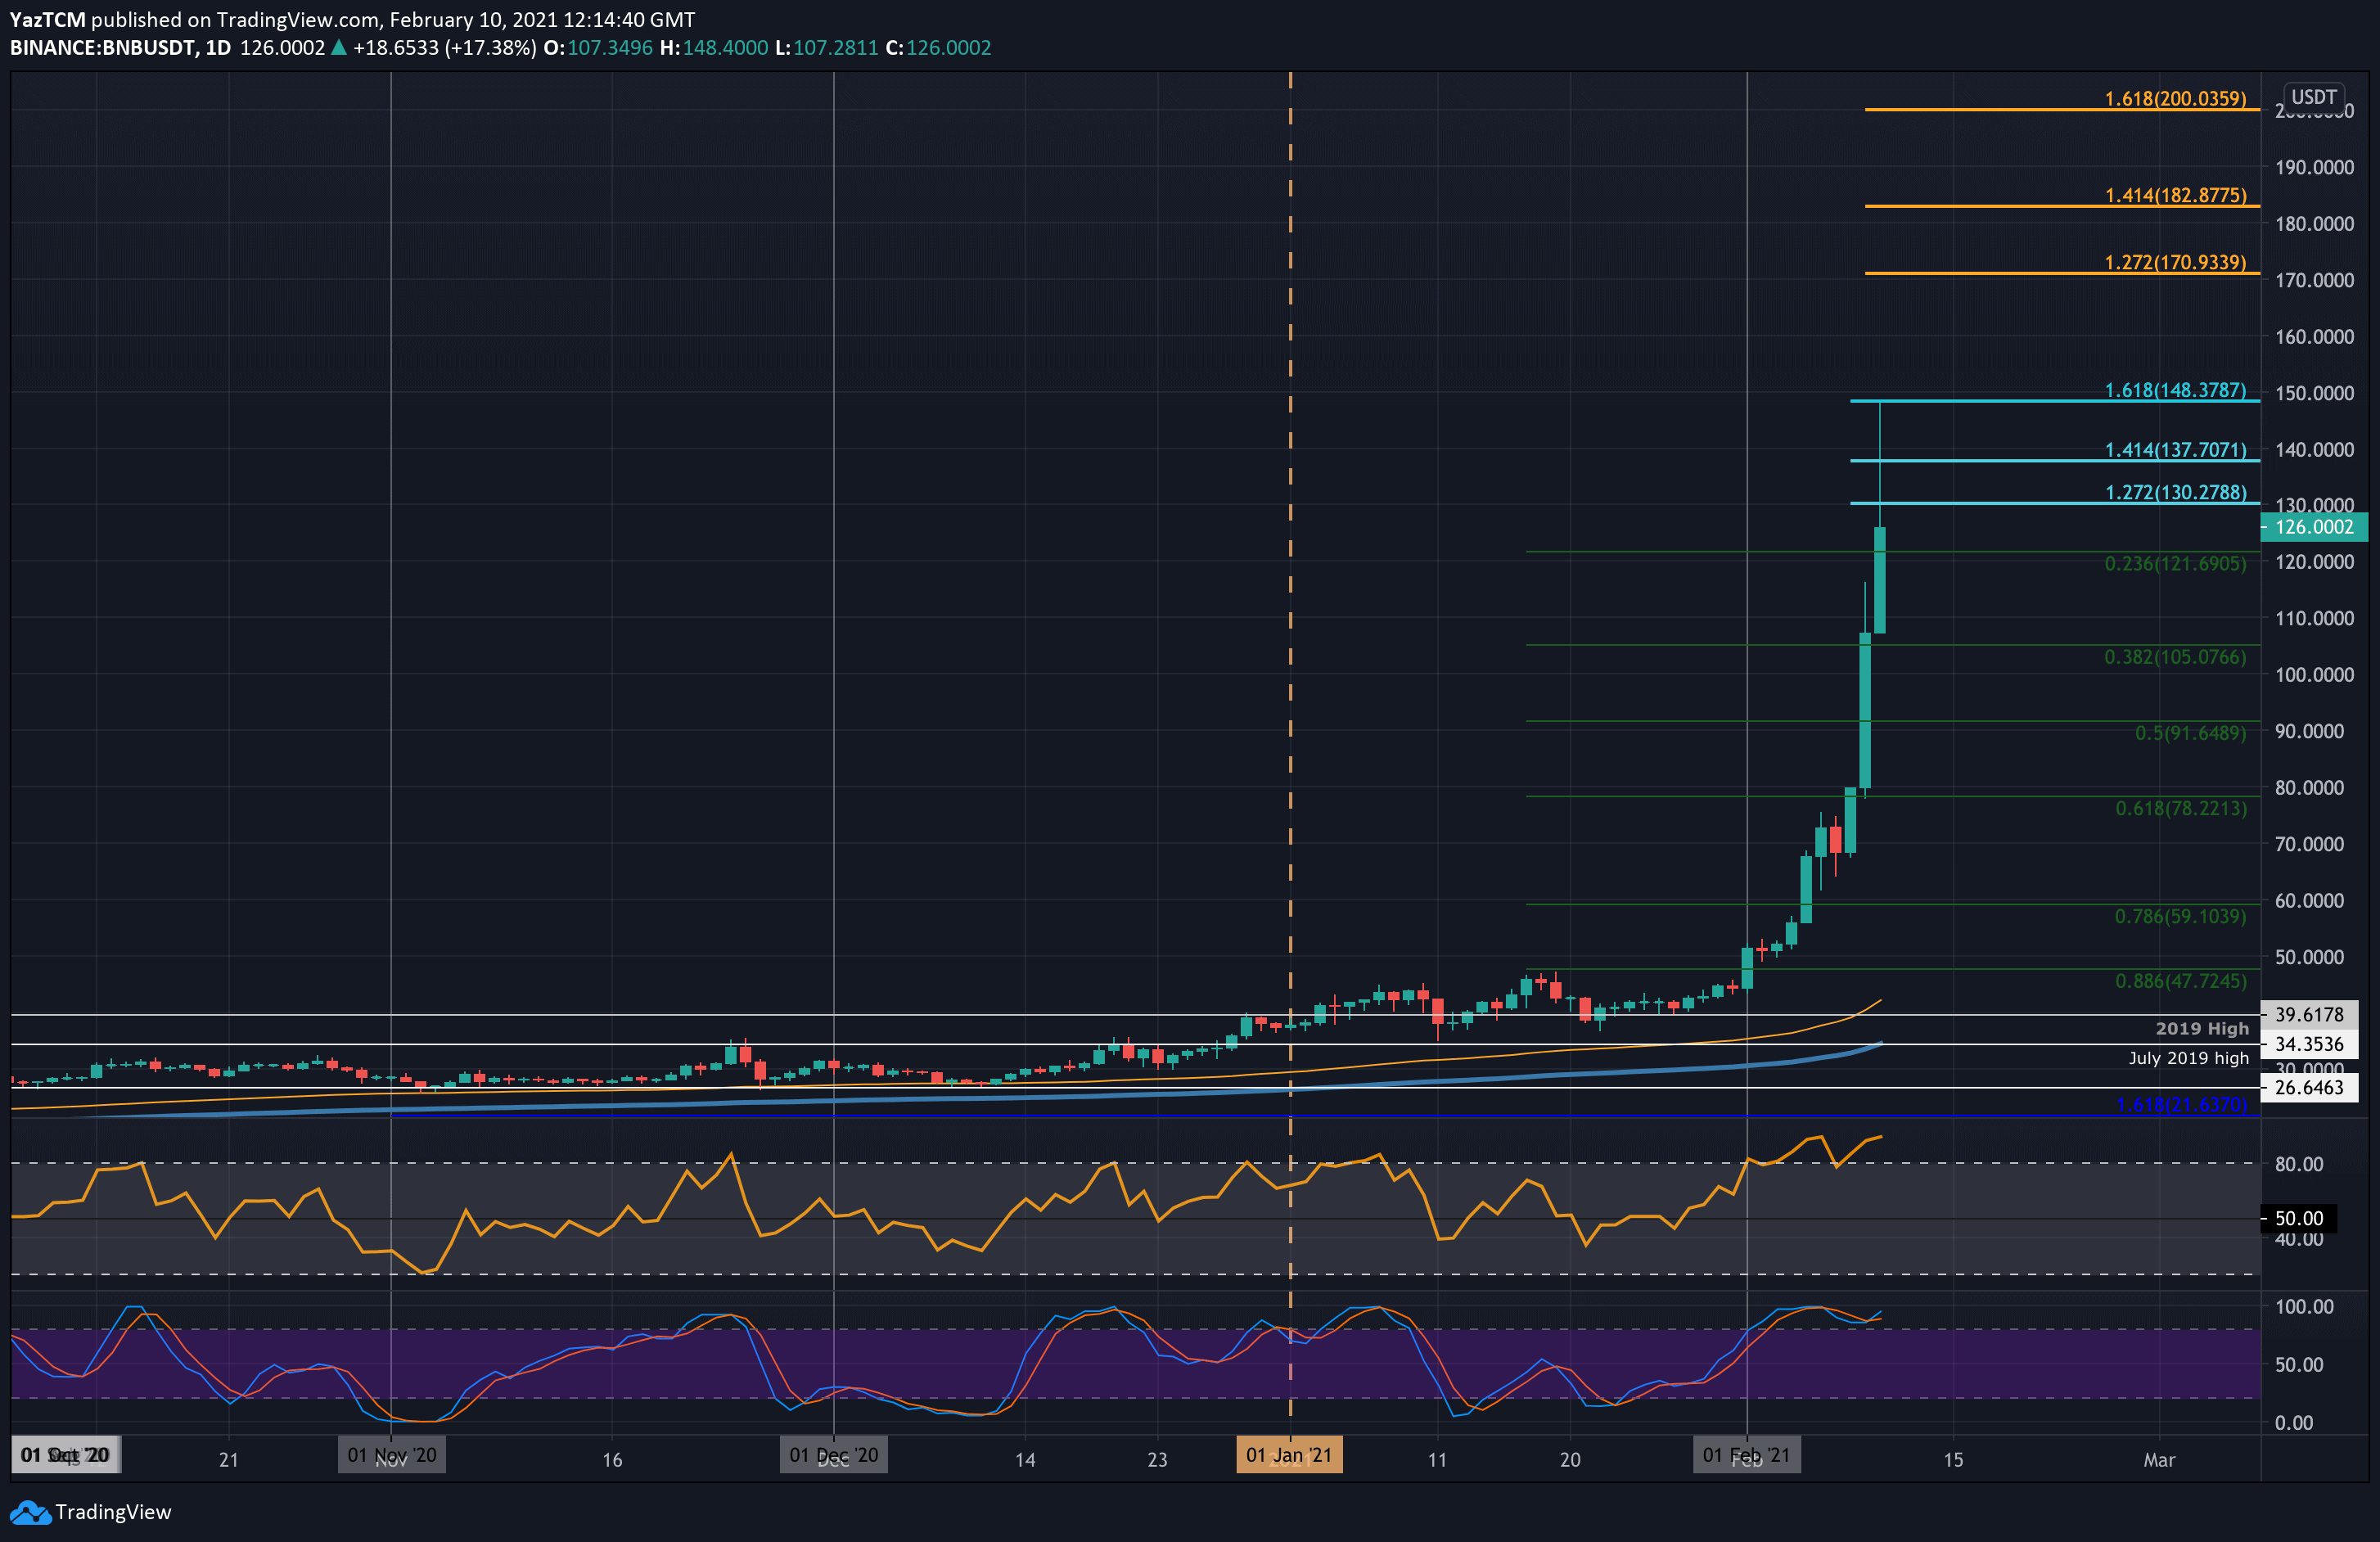
BNB/USD Daily Chart. Source: TradingView
Key Support Levels: $110, $105, $100.
Key Resistance Levels: $130, $137.70, $148.37.
Binance Coin has absolutely exploded this week after surging by a total of 149%. The coin was trading at just $50 a few days ago as it started to push higher to reach $80 on Monday.
From there, it started to turn extremely parabolic as it broke past $100 yesterday and continued higher today to set a new ATH price at $148.37 (1.618 Fib Extension).
This type of growth for a top-20 ranked cryptocurrency is truly remarkable. The cryptocurrency has now climbed into the 7th position as it holds an $8.5 billion market cap.
Moving forward, the first level of resistance lies at $130. This is followed by $137.70 (1.414 Fib Extension) and $148.37 (1.618 Fib Extension). Beyond $150, additional resistance lies at $160, $170.94 (1.272 Fib Extension – orange), and $182.87 (1.414 Fib Extension – orange).
On the other side, the first support lies at $110. This is followed by $105 (.382 Fib), $100, and $91.65 (.5 Fib). Additional support lies at $78.22 (.618 Fib).
The RSI is now in extremely overbought conditions above 80, indicating the bulls might be a little overextended right now.
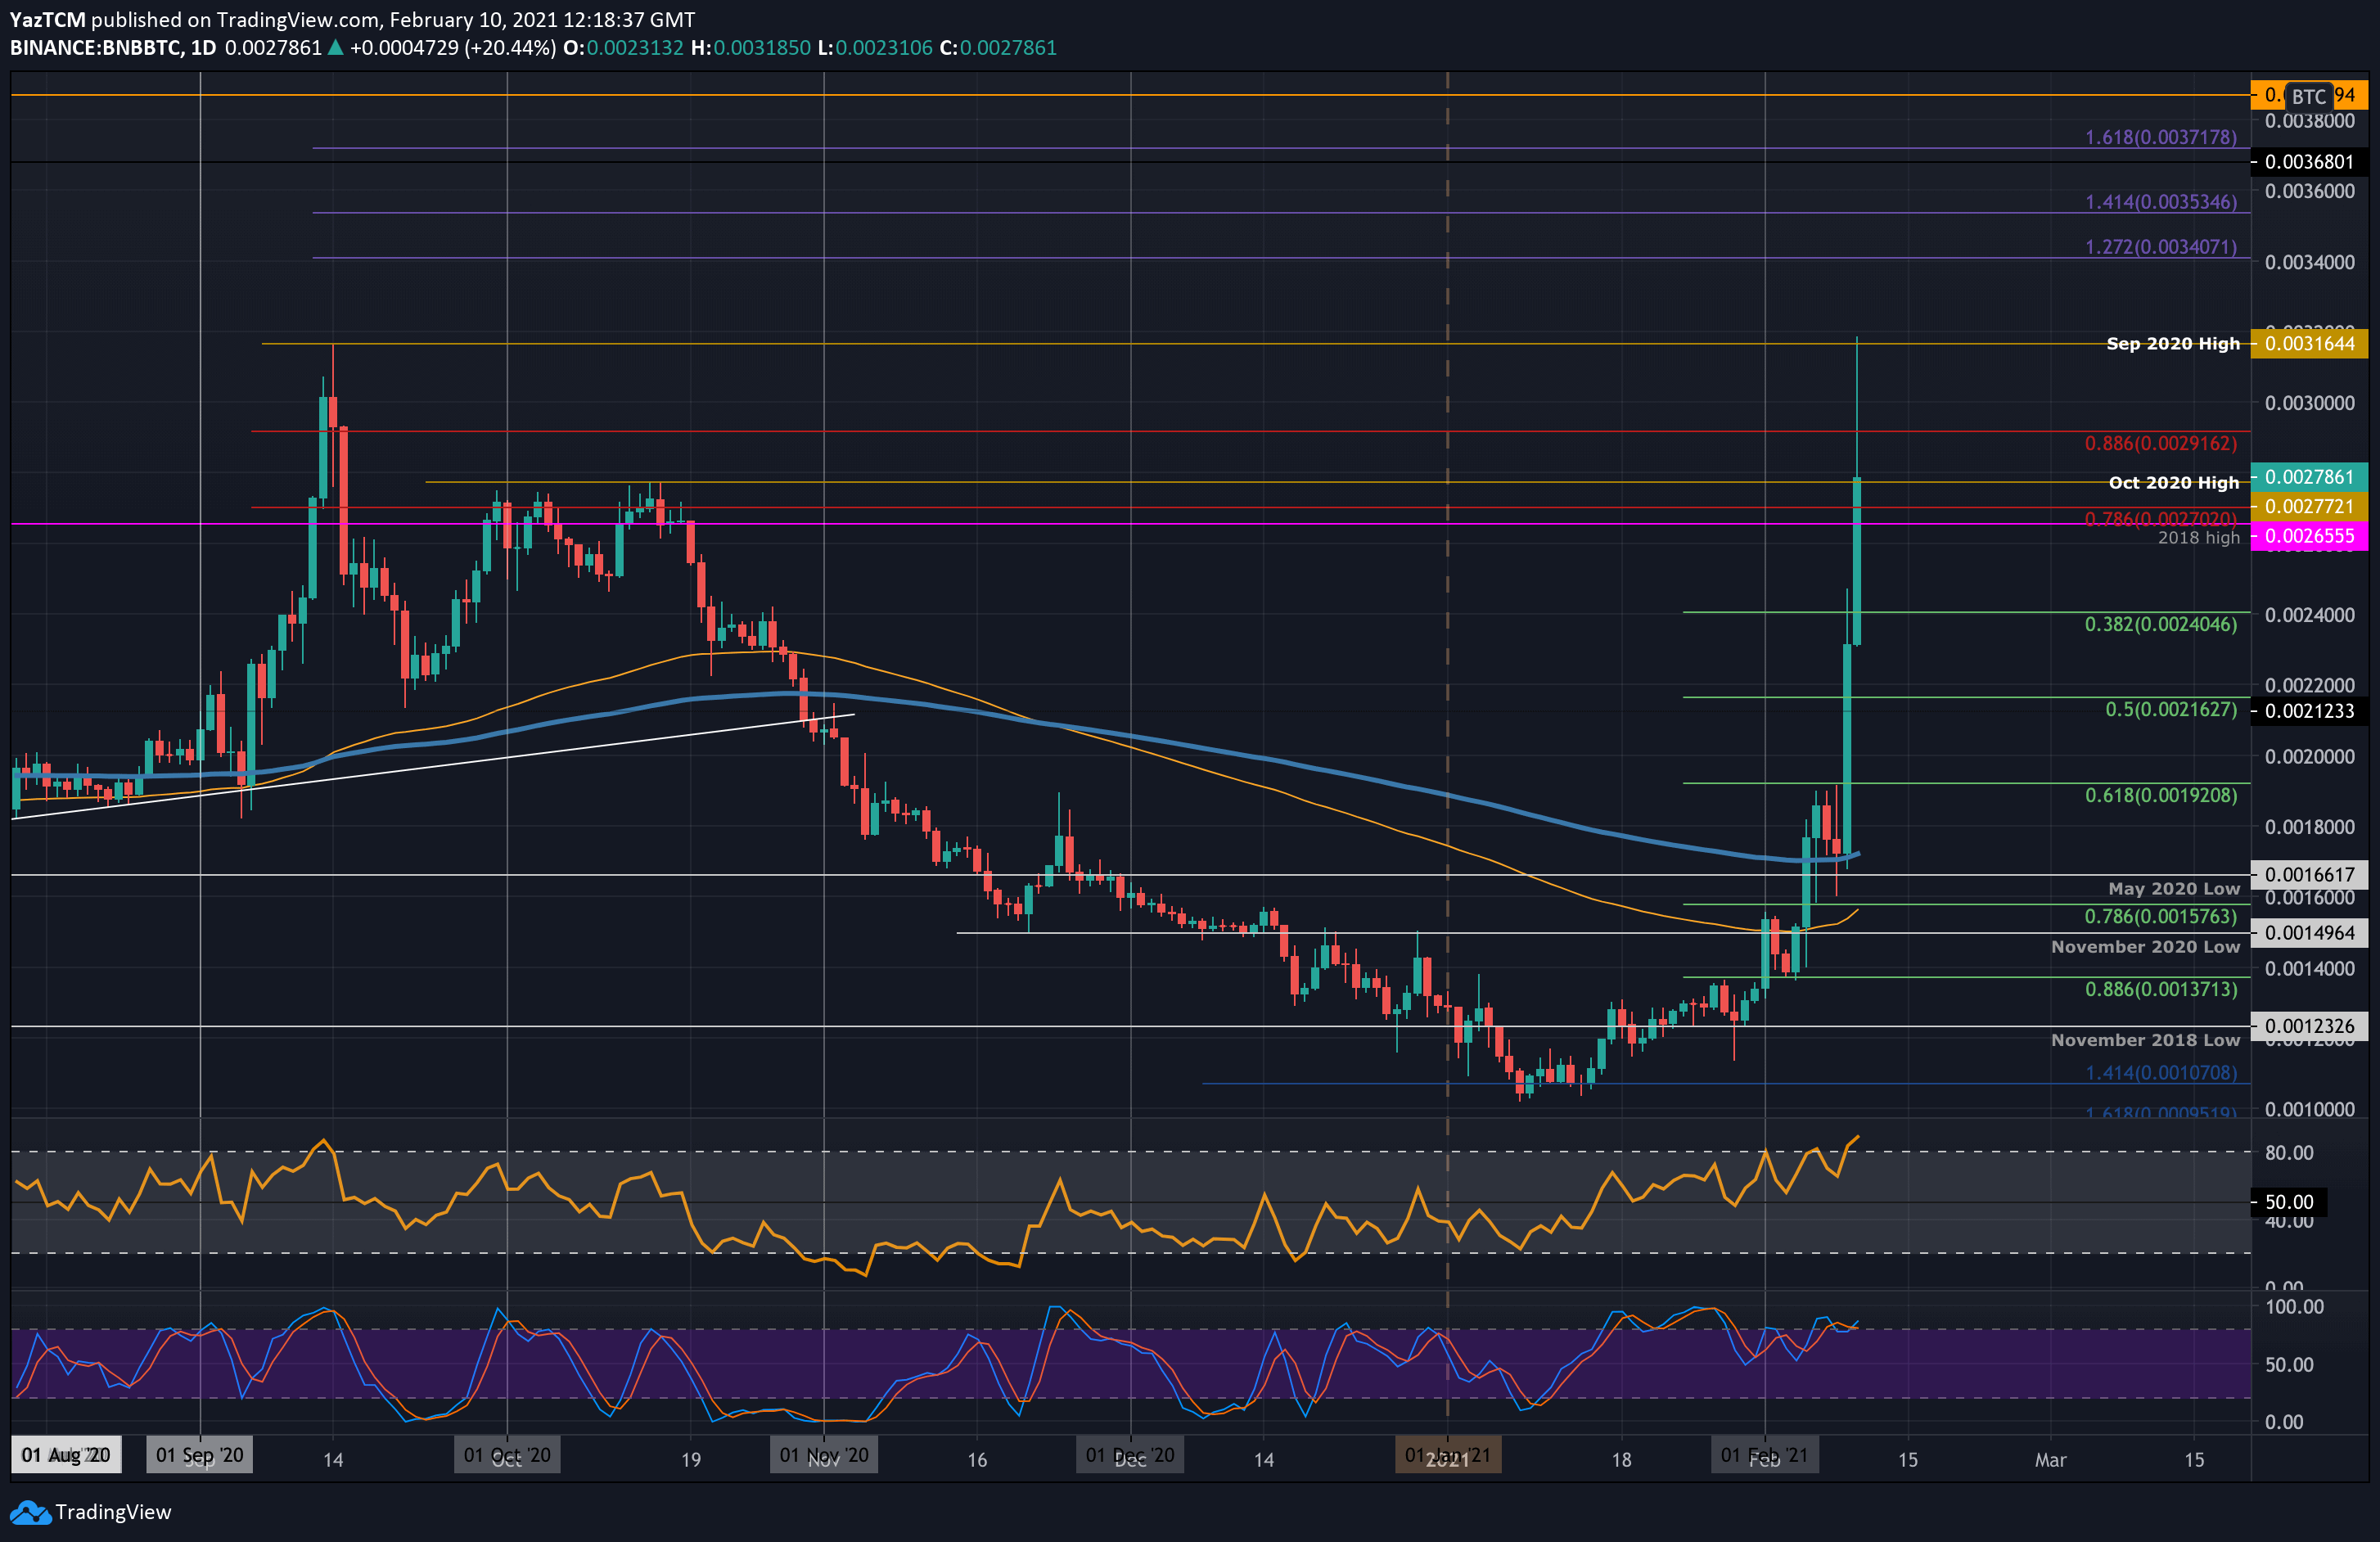
Key Support Levels: 0.00265 BTC, 0.0024 BTC, 0.00216 BTC.
Key Resistance Levels: 0.003 BTC, 0.000316 BTC, 0.00034 BTC.
BNB is also performing very well against Bitcoin. During Q4 2020, BNB was in a constant decline as it fell from 0.0022 BTC to reach as low as 0.00123 BTC by the years’ end. It continued to dip lower in January until support was found at 0.00107 BTC.
At the start of February, BNB was trading at around 0.0015 BTC. Yesterday, it surged higher to break above the 200-days EMA and 0.002 BTC to reach as high as 0.0025 BTC. Today, the price surge continued further as BNB drove past the 2018 highs at 0.00265 BTC to reach the September 2020 highs at 0.00316 BTC.
It has since dropped lower and is trading around 0.00278 BTC.
Looking ahead, the first level of resistance is located at 0.003 BTC. This is followed by 0.00316 BTC (September 2020 high), 0.0034 BTC (1.272 Fib Extension), 0.00353 (1.414 Fib Extension), and 0.00371 BTC (1.618 Fib Extension).
On the other side, the first support lies at 0.00265 BTC (2018 High). This is followed by 0.0024 BTC (.382 Fib), 0.00216 BTC (.5 Fib), and 0.002 BTC.
The RSI has also entered the extremely overbought territory, indicating the bulls might be a little overextended right now.