Binance Coin struggled this week after dropping by 8.51% to around $26.31. The cryptocurrency’s price fell beneath the 100-day EMA and a long-term rising support trend line. BNB has dropped by a whopping 21% over the past 3 months.
BNB remains the sixth largest cryptocurrency by market value with a market cap of $4.09 billion.
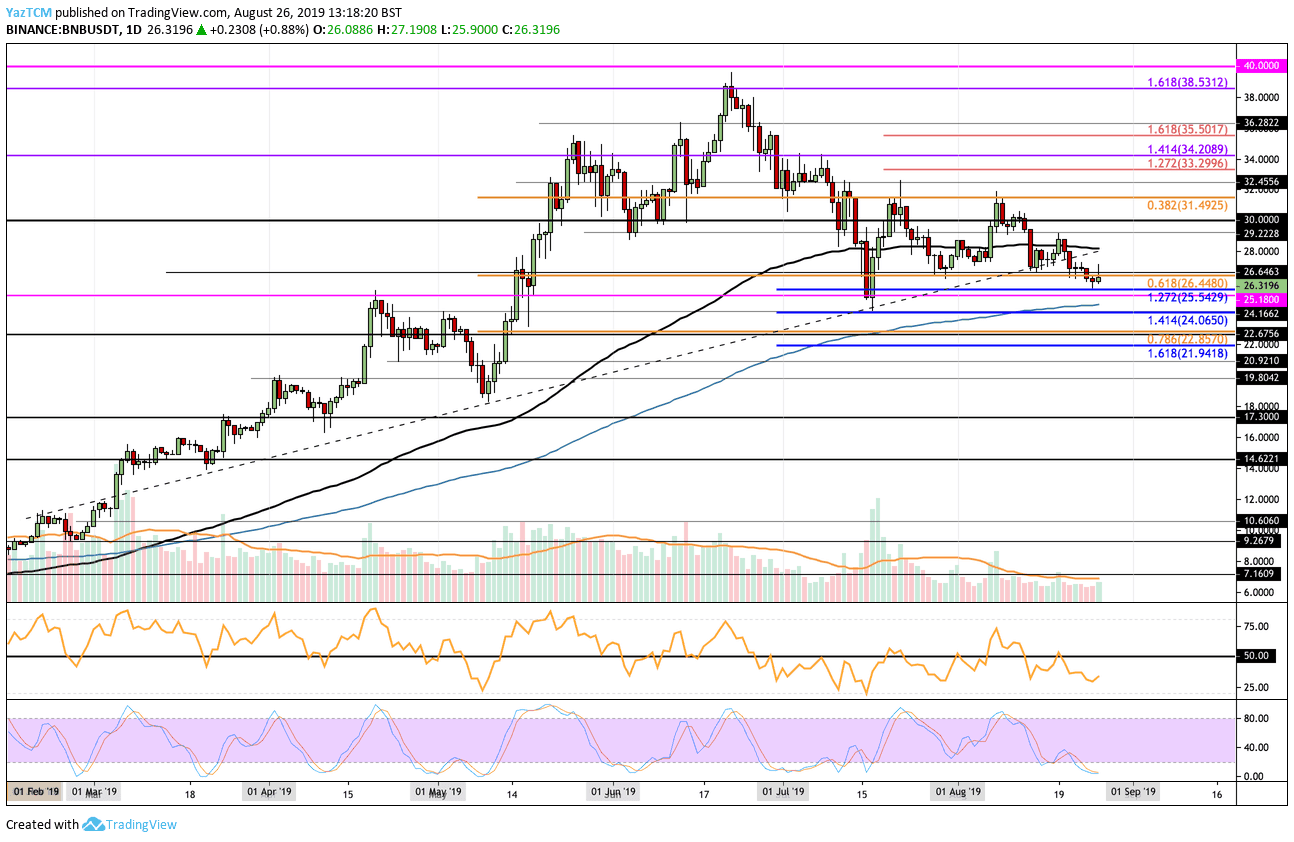
Looking at the BNB/USD 1-day chart:
- Since our previous BNB analysis, the BNB price fell beneath the 100-day EMA and the rising support line. It subsequently dropped beneath the .618 Fib retracement at $26.44 but managed to find support at $25.51 (the downside 1.272 Fib extension).
- From above: The nearest level of resistance is $27. Higher resistance is located at the 100-day EMA at around $28. Above this, resistance is located at $29.22, $30, $31.49, and $32.45.
- From below: The nearest level of support is $25.54. This is followed by support at $25.18, $25, $24.67 (the 200-day EMA), and $24. If the selling continues beneath $24, further support lies at $22.85 and $21.94.
- The trading volume has held steady at average.
- The RSI has dipped beneath 50, showing that the bears are in control. However, the Stochastic RSI is in oversold territory as we await a bullish crossover signal.
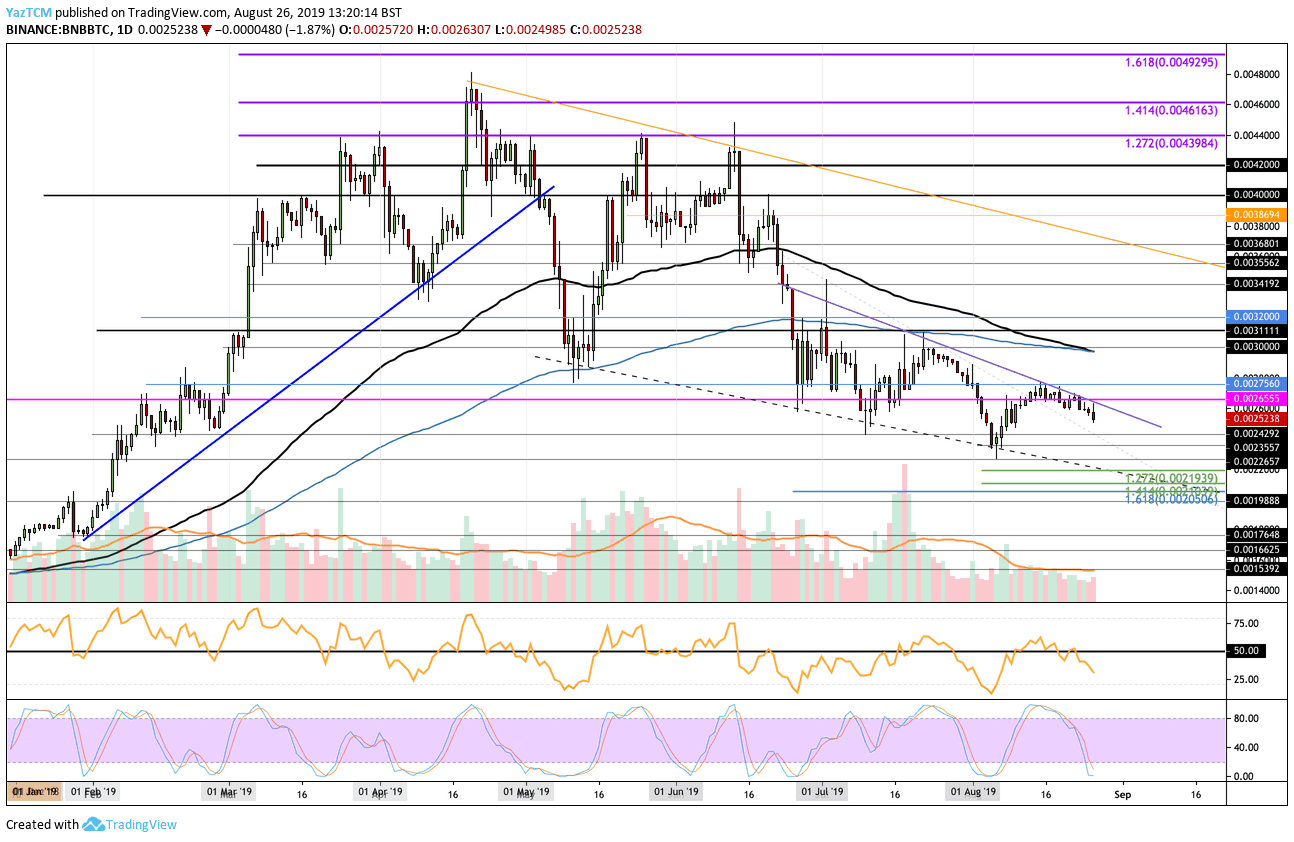
Looking at the BNB/BTC 1-day chart:
- Trading against Bitcoin, BNB broke above our previous descending resistance line, but the market found higher resistance at the falling (purple) resistance line. The cryptocurrency is still unable to break above this trend line, which is a bad sign for the BNB bulls.
- From above: The nearest level of resistance is 0.002655 BTC. Higher resistance lies at 0.002756 BTC, 0.0029 BTC, and 0.0030 BTC. The resistance at 0.0030 BTC is bolstered by both the 100- and 200-day EMA, which converge at this price. If the buyers continue above 0.003 BTC, higher resistance is expected at 0.003111 BTC and 0.0032 BTC.
- From below: The nearest level of support is 0.0025 BTC. Beneath this, support is found at 0.00242 BTC, 0.0024 BTC, 0.003255 BTC, and 0.002265 BTC.
- The trading volume remains steady but below average.
- The Stochastic RSI is also in extreme oversold territory as we await a bullish crossover signal to show that the bulls are ready to attempt a push higher.
SPECIAL OFFER (Sponsored)
LIMITED OFFER 2024 for CryptoPotato readers at Bybit: Use this link to register and open a $500 BTC-USDT position on Bybit Exchange for free!
Disclaimer: Information found on CryptoPotato is those of writers quoted. It does not represent the opinions of CryptoPotato on whether to buy, sell, or hold any investments. You are advised to conduct your own research before making any investment decisions. Use provided information at your own risk. See Disclaimer for more information.
Cryptocurrency charts by TradingView.