Binance Coin saw a slight increase of around 2.14% over the past 24 hours and it currently trades at $18.50. This price increase follows a 6.62% price rise over the past week.
The latest price increase could be attributed to the fact that Binance recently conducted its 9th quarterly burn for BNB. This time, over 2 million BNB was burned which is estimated to be around $36 million. The reduction in supply usually helps to bolster the price, however, the reaction is typically delayed. Alternatively, this latest price increase could also be attributed to the fact that BNB has been rising against BTC as of late, meaning we are in a short term bullish run anyway.
Binance Coin remains the seventh-largest cryptocurrency with a market cap of $2.88 billion.
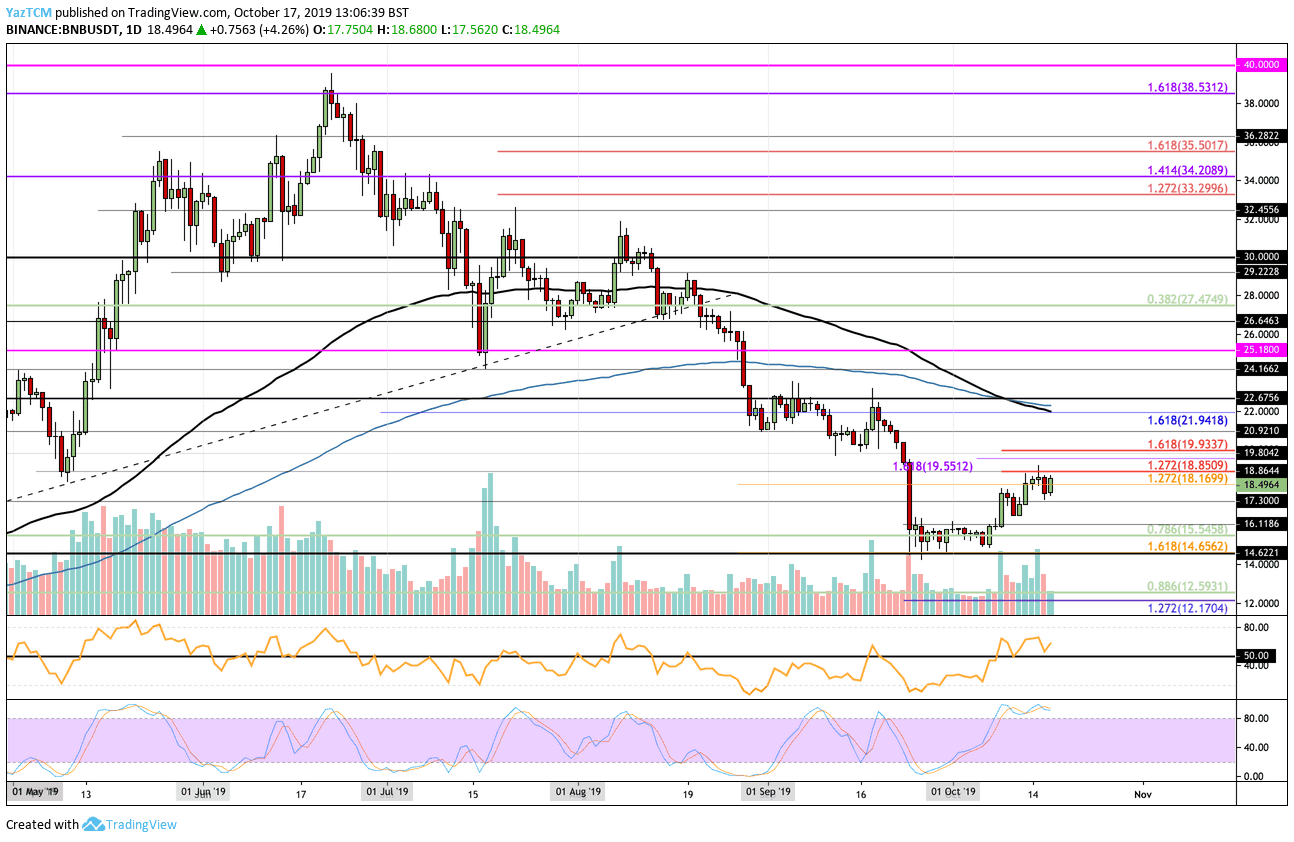
Looking at the BNB/USD 1-Day Chart:
- Since our previous BNB analysis, Binance Coin continued to rise higher, reaching the resistance at the short term 1.272 Fib Extension at $18.85. BNB went on to drop into support at $17.30, but the coin burn helped the market rebound higher back toward the previous level.
- From above: Initial resistance is expected directly at $18.85. Above this, resistance is located at $19.55, $19.93 (1.618 Fib Extension), and $20. Above $20, resistance lies at $20.92 and then between $21.94 and $22.50, where lies the 100-days and 200-days EMAs.
- From below: The nearest levels of support lie at $18 and $17.30. Further support is located at $17, $16.11, $15.54, and $14.65.
- The trading volume has been increasing during October.
- The RSI is in the strong favor of the bulls as it is above the 50 level. However, the Stocahstic RSI warns us to remain cautious as it trades in overbought conditions. A bearish crossover signal here would send the market lower.
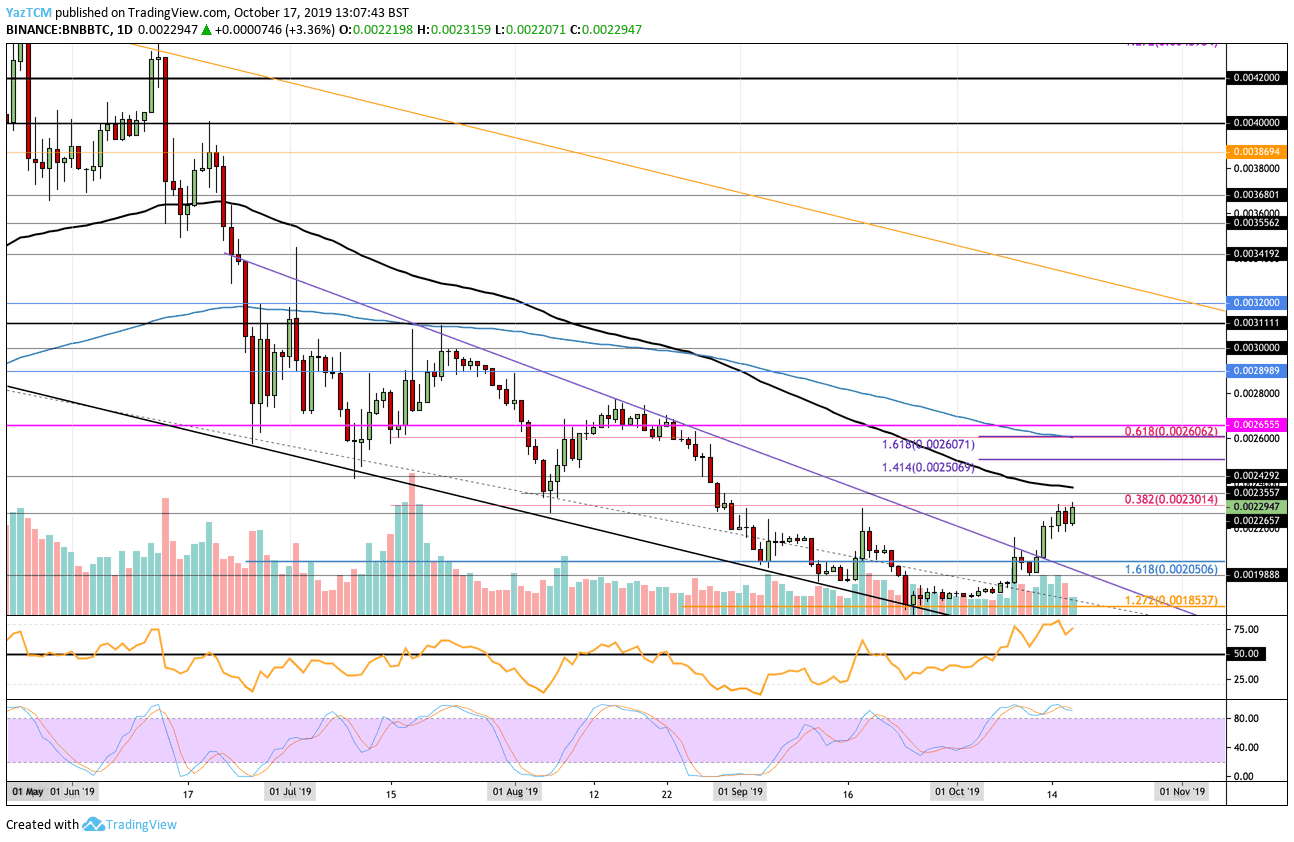
Looking at the BNB/BTC 1-Day Chart:
- Against Bitcoin, BNB also went higher. It managed to break above the resistance at 0.002265 BTC to bump into the current resistance at 0.0023 BTC provided by a short term bearish .382 Fib Retracement.
- From above: The nearest levels of resistance lie at 0.002357 BTC and 0.002385 BTC (100-days EMA). Above this, resistance is expected at 0.002492 BTC, 0.0025 BTC (1.414 Fib Extension), and 0.002607 BTC (1.618 Fib Extension). The resistance at 0.002607 BTC is supposed to be significant due to the confluence of the 200-days EMA and the bearish .618 Fib Retracement also being located here.
- The trading volume has been rising in October.
- The RSI is well above the 50 level which shows that the bulls are strongly in control over the market momentum. However, similar to BNBUSD, the Stochastic RSI warns to remain cautious as it trades in overbought conditions.
SPECIAL OFFER (Sponsored)
LIMITED OFFER 2024 for CryptoPotato readers at Bybit: Use this link to register and open a $500 BTC-USDT position on Bybit Exchange for free!
Disclaimer: Information found on CryptoPotato is those of writers quoted. It does not represent the opinions of CryptoPotato on whether to buy, sell, or hold any investments. You are advised to conduct your own research before making any investment decisions. Use provided information at your own risk. See Disclaimer for more information.
Cryptocurrency charts by TradingView.