Binance Coin saw a slight increase of around 1.58% over the past 24 hours and it currently trades at $18.17. The cryptocurrency has surged significantly by 16% this past week after managing to break above a long term descending wedge against BTC. This latest price hike has rendered the market bullish as it makes its way back toward $20.
Binance Coin is the eighth-largest cryptocurrency with a market cap of $2.83 billion.
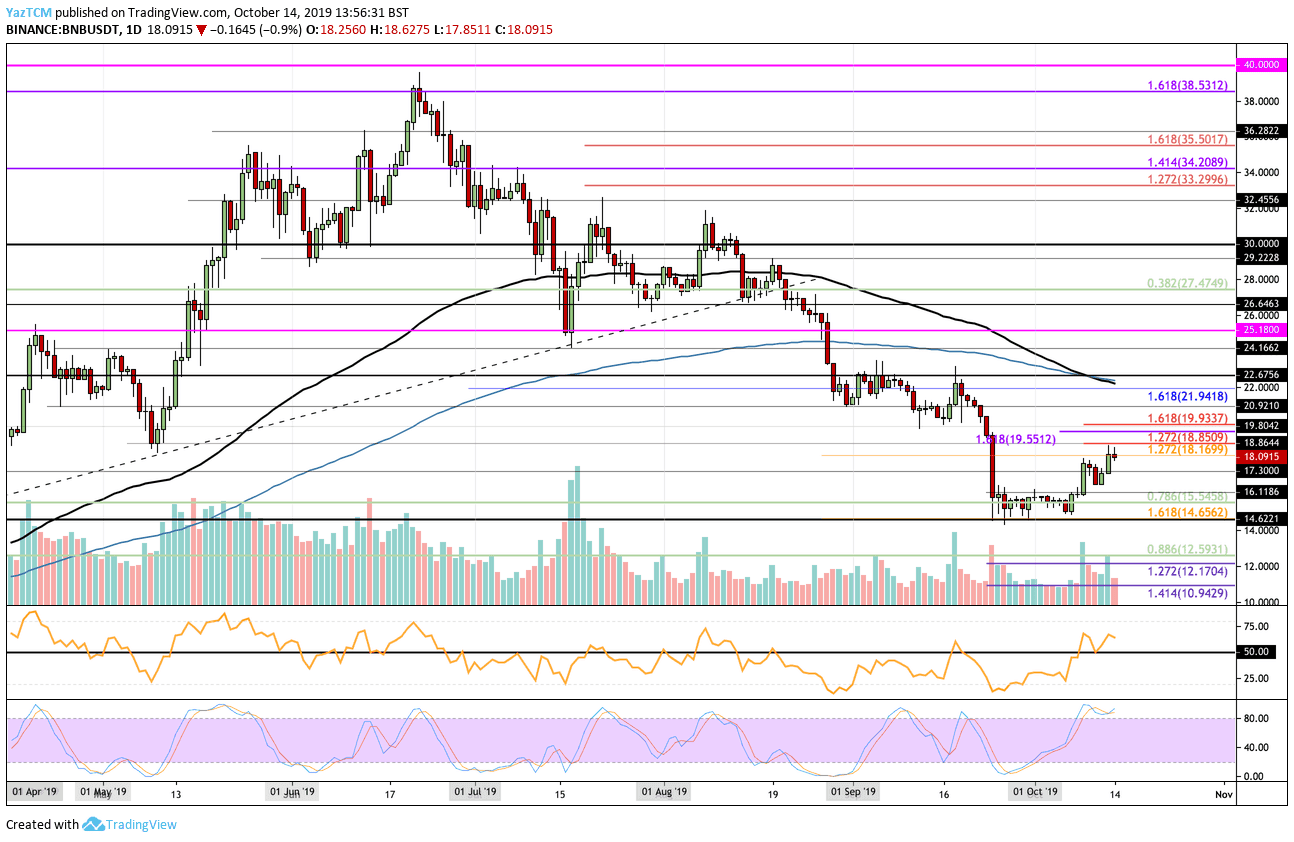
Looking at the BNB/USD 1-Day Chart:
- Since our previous BNB analysis, the cryptocurrency continued to increase from the support found at $16.80, reaching the resistance at $18.16. It even spiked to $18.85 where the short term 1.272 Fib Extension was and failed to break above it.
- From above: If the surge past $18.16 the nearest level of resistance lies at $18.85. Above this, resistance lies at $19, $19.55, and $19.93 (Short term 1.618 Fib Extension). If the bulls can break $20, higher resistance is expected at $20.92 and $22 (bolstered by 100-days and 200-days EMA’s).
- From below: The nearest level of support lies at $18. Beneath this, support lies at $17.30, $16.11, $15.54, and $14.65.
- The trading volume remains at an average level.
- The RSI has recently broken above the 50 level and has managed to remain above which is a strong sign for the bulls as they continue to control the market momentum.
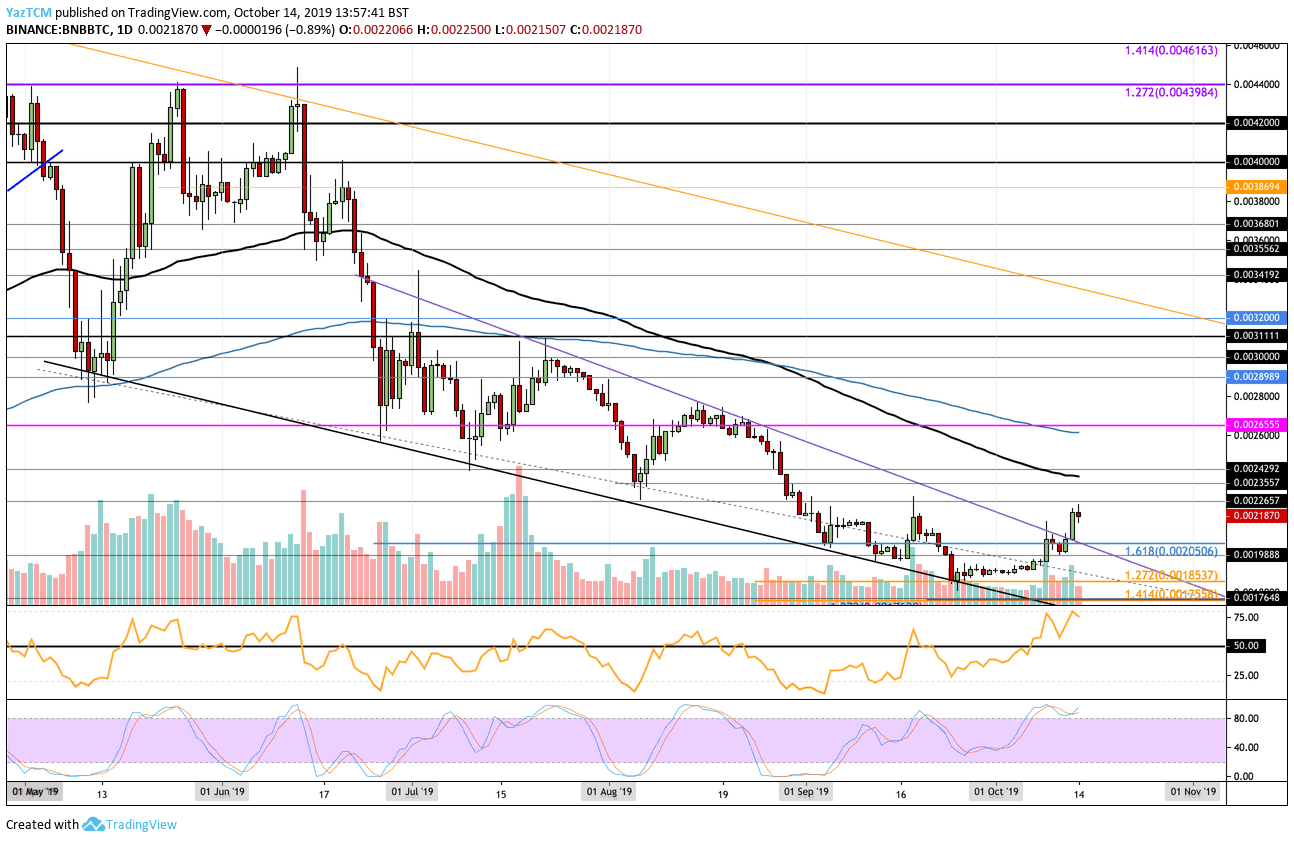
Looking at the BNB/BTC 1-Day Chart:
- Against Bitcoin, BNB managed to smash above the resistance 0.002 BTC, provided by the upper boundary of a descending wedge formation. BNB continued to climb further higher until meeting resistance at 0.022 BTC.
- From above: The nearest levels of resistance lie at 0.002 BTC and 0.002265 BTC. Above this, higher resistance is expected at 0.002360 BTC (100-days EMA) and 0.0025 BTC. Significant resistance above lies at 0.0026 BTC which is strengthened by the 200-days EMA.
- From below: The nearest level of support lies at 0.002 BTC. Beneath this, support lies at 0.001988 BTC, 0.0019 BTC, and 0.001853 BTC.
- The trading volume has seen a small increase during October.
- The RSI is well above the 50 level which shows that the bulls are in strong control over the market momentum. However, the Stochastic RSI is shaping up for a bearish crossover signal which tells us we must remain cautious and expect a small pullback.
SPECIAL OFFER (Sponsored)
Binance Free $600 (CryptoPotato Exclusive): Use this link to register new account and receive $600 exclusive welcome offer on Binance (
full details).
LIMITED OFFER 2024 for CryptoPotato readers at Bybit: Use this link to register and open a $500 BTC-USDT position on Bybit Exchange for free!
Disclaimer: Information found on CryptoPotato is those of writers quoted. It does not represent the opinions of CryptoPotato on whether to buy, sell, or hold any investments. You are advised to conduct your own research before making any investment decisions. Use provided information at your own risk. See Disclaimer for more information.
Cryptocurrency charts by TradingView.