Binance Coin saw a sharp increase of around 8% over the past 24 hours and it currently trades at $17.39. BNB managed to find strong support at $14.65, which gave legs to the latest spike. This price hike pushed Binance Coin to be the highest performing cryptocurrency in the top 10 projects.
Binance Coin is the eighth-largest cryptocurrency with a total market cap of $2.69 billion. The latest price rebound is largely due to BNB making some strong gains against BTC.
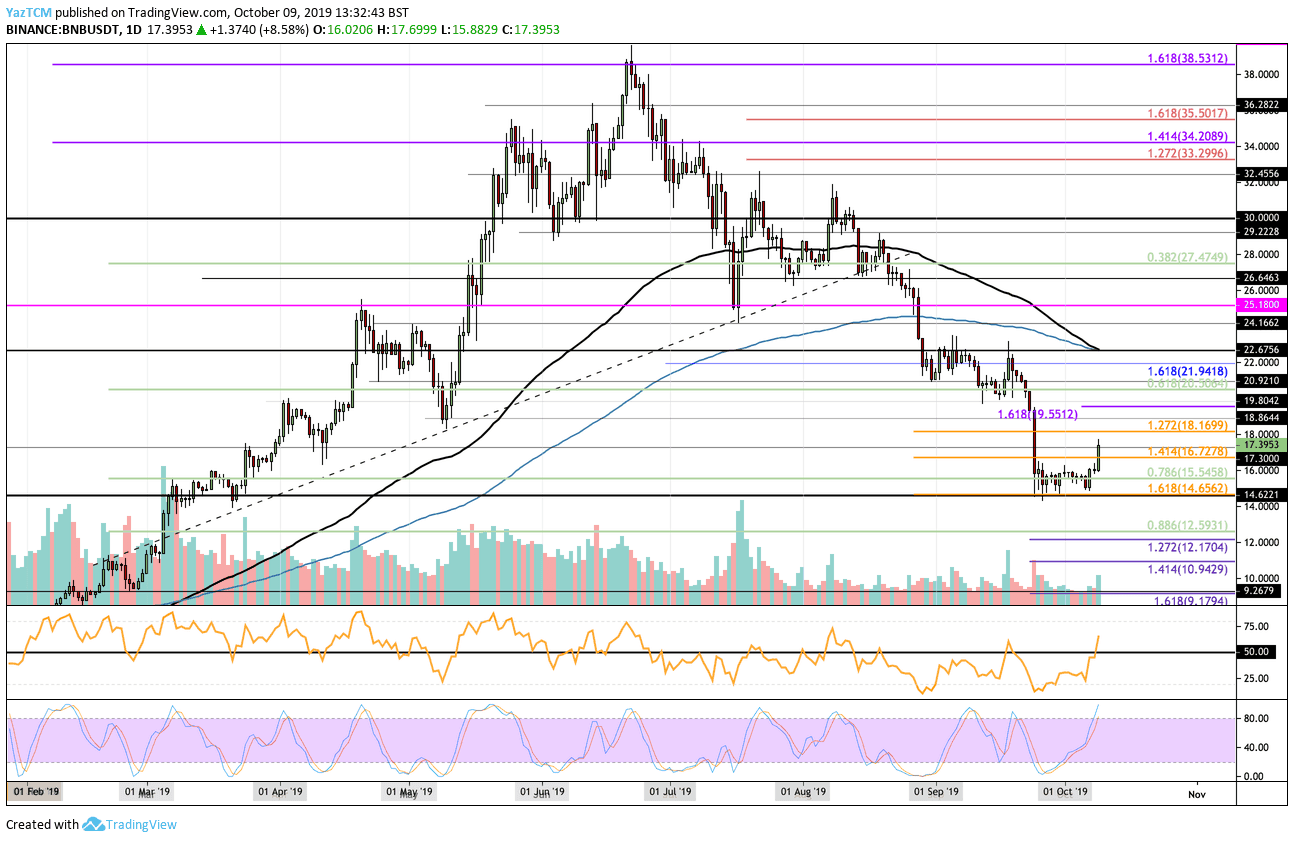
Looking at the BNB/USD 1-Day Chart:
- Since our previous BNB analysis, the support at the $14.65 level (provided by the downside 1.618 Fib Extension) continued to hold very well during the first week of October. This provided grounds for the market to rebound higher over the past few days. Binance Coin is now facing resistance at the $17.30 level, which had displayed strong resistance previously during March 2019.
- From above: If the bulls break the resistance at $17.30, higher resistance is found at $18, $18.16, $18.84, $19.55, and $20. Above $20, resistance is located at $20.56, $22, and $22.67. The resistance at $22.67 is considered significant due to the 100-days and 200-days EMA being located here.
- From below: The nearest level of support lies at $17. Beneath $17, support lies at $16.72, $16.00, $15.54, and $14.65. If the sellers break beneath the strong support at $14.65, added support can be found at $14, $13, $12.59, and $12.17.
- The trading volume has seen a slight uptick over the past couple of days.
- The RSI has recently managed to penetrate above the 50 level which shows that the bulls are in charge of the market momentum.
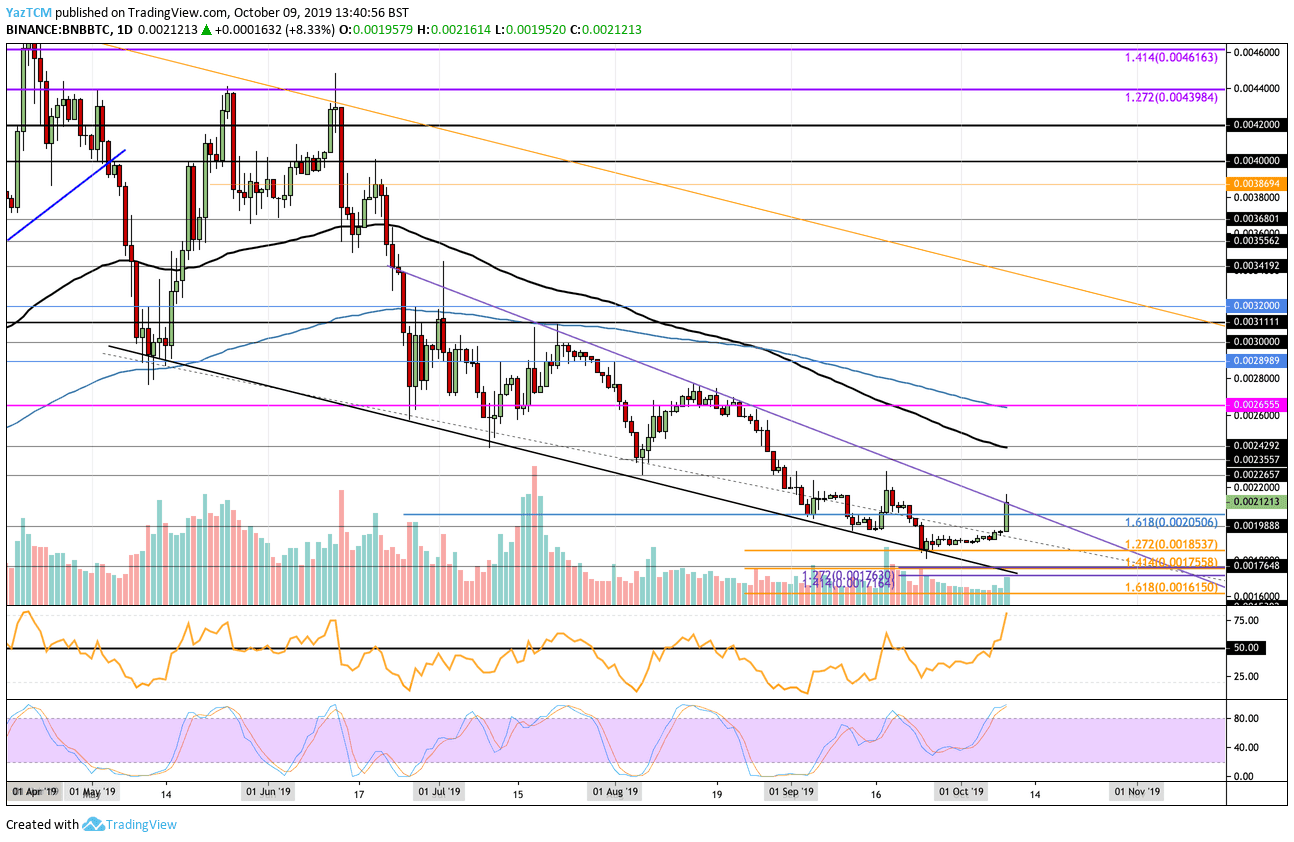
Looking at the BNB/BTC 1-Day Chart:
- Against Bitcoin, BNB managed to hold the support at the 0.001853 BTC and slowly started to grind higher from here. In today’s trading session, BNB saw a major price surge that has seen the coin rise into resistance provided by the upper boundary of a falling wedge pattern which has been active for over 3 months.
- From above: The nearest level of resistance lies at the upper boundary of the wedge formation. Above this, resistance is found at 0.0022 BTC, 0.002265 BTC, 0.002355 BTC, and 0.02492 BTC (100-days EMA). Higher resistance lies at 0.00255 BTC and 0.002655 BTC (200-days EMA).
- From below: The nearest level of support lies at 0.0020 BTC. Beneath this, support can be found at 0.001988 BT and 0.001853 BTC. Lower support is located at 0.0018 BTC, 0.001755 BTC, and 0.0017 BTC.
- The trading volume has started to increase during October.
- The RSI is well above the 50 level as the bulls dominate the market momentum. However, the Stocahstic RSI is primed for a bearish crossover signal which could suggest that the buyers may need a short break before continuing higher.
SPECIAL OFFER (Sponsored)
LIMITED OFFER 2024 for CryptoPotato readers at Bybit: Use this link to register and open a $500 BTC-USDT position on Bybit Exchange for free!
Disclaimer: Information found on CryptoPotato is those of writers quoted. It does not represent the opinions of CryptoPotato on whether to buy, sell, or hold any investments. You are advised to conduct your own research before making any investment decisions. Use provided information at your own risk. See Disclaimer for more information.
Cryptocurrency charts by TradingView.