Binance Coin enjoys a day of green, which totals 1.36% over the past 24 hours, whilst the rest of the top 10 cryptocurrency projects suffer from severe drops.
Binance Coin continues its extraordinary price increase after rising by 241% over the past 90 trading days.
BNB recently recorded its USD all time high at $25.18, and is the 7th largest crypto by market cap value holding a $3.26 billion cap valuation.
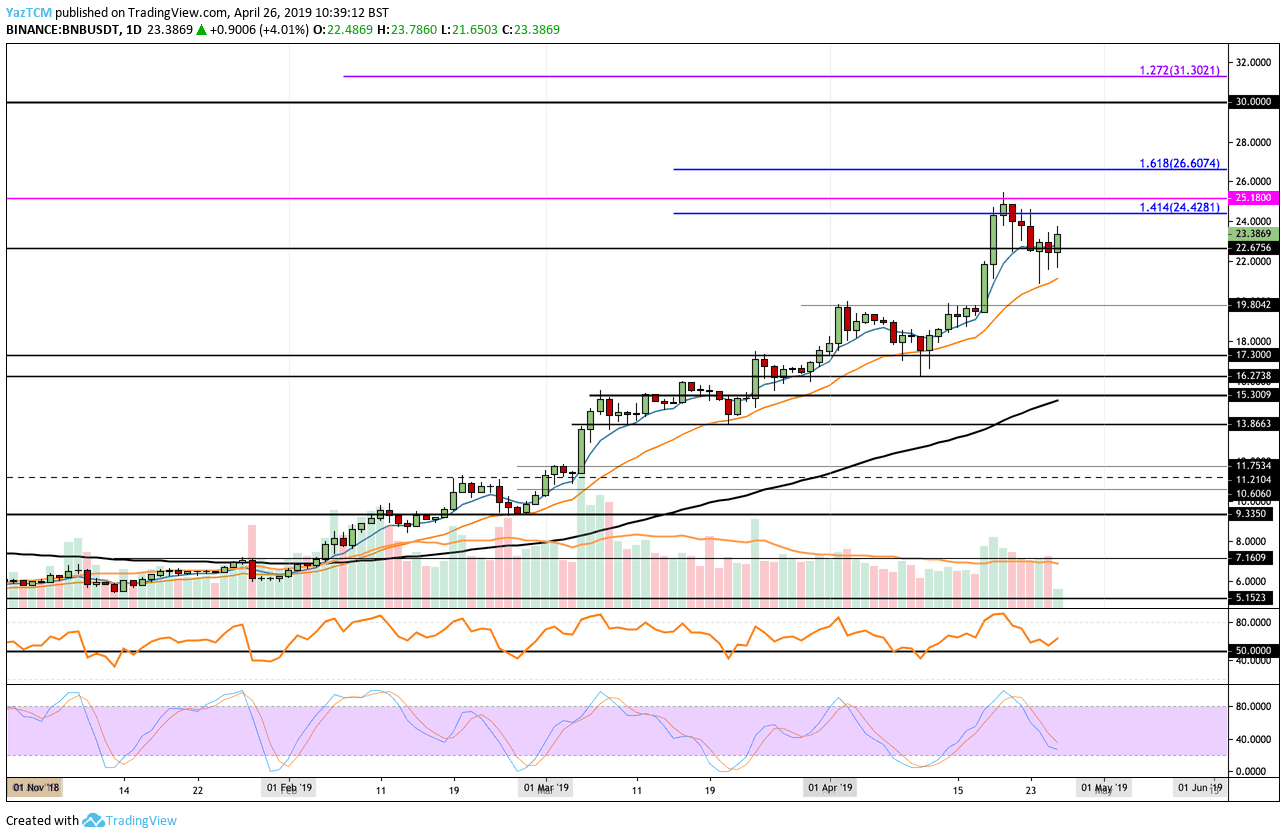
Looking at the BNB/USD 1-Day Chart:
- Since our last BNB/USD price analysis, we can see that the previous Stochastic RSI crossover below signal had seen BNB drop into support around $22.60. The coin was able to hold at this support level, except for a few brief lower spikes, and has now started to climb again.
- From above: The nearest level of resistance now lies at the previous ATH at $25.18. Above $25.18, higher resistance can be located at $26.60. If the bulls continue higher, further resistance is located at $28 and $30.
- From below: If the sellers push BNB/USD beneath $22.67, we can expect support at $22, $21 and $20. Beneath $20, more support lies at $19.80 and $17.30.
- The trading volume has remained high and has increased to a level above average over the past few days as the price started to climb.
- The RSI remains in positive territory, as it has done all year round, after bouncing close to the 50 level. Furthermore, the Stochastic RSI is now approaching oversold conditions as we look for a crossover above to signal a strong bullish move.
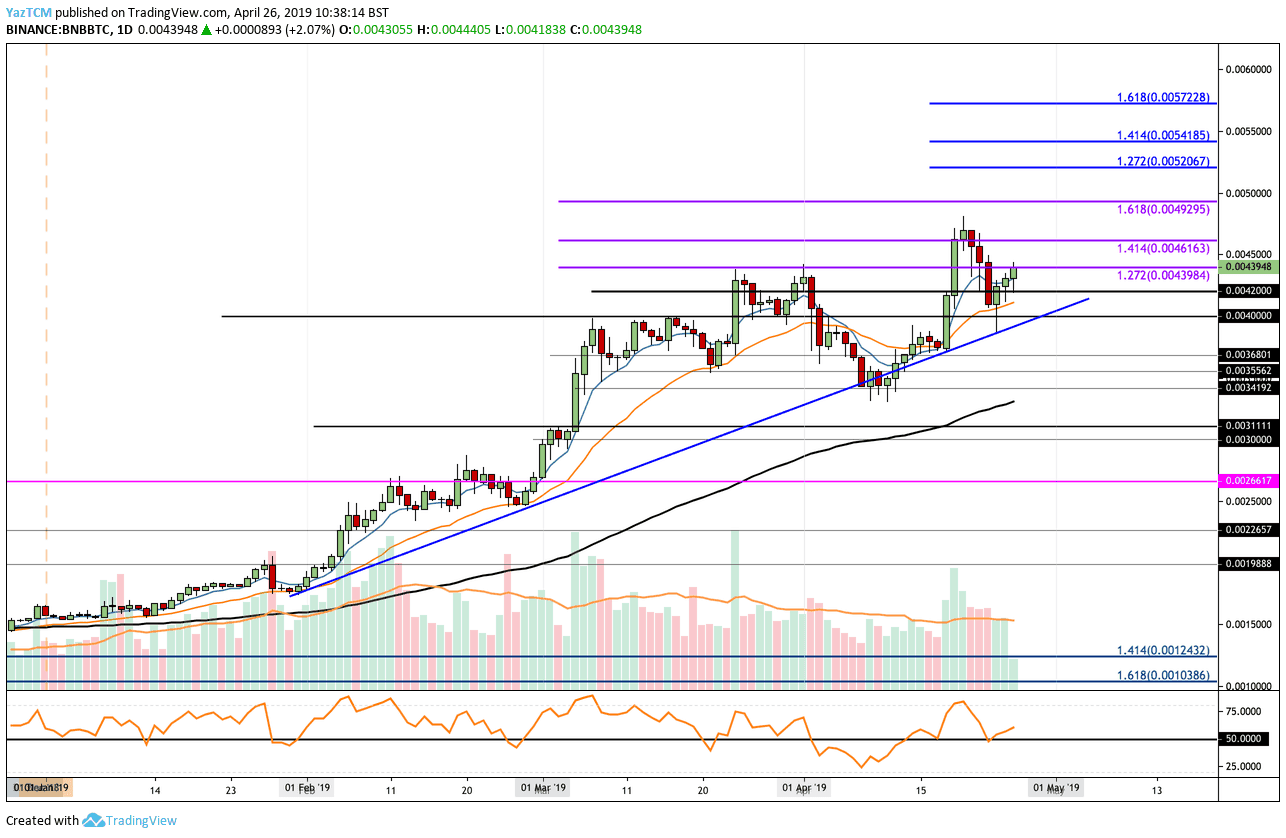
Looking at the BNB/BTC 1-Day Chart:
- Following our previous BNB/BTC analysis, we can see that the market had also fallen against BTC. Price action dropped into support at a 3-month-old rising trend line before bouncing higher. The coin is now trading at resistance around 0.004 BTC where lies a medium-term 1.272 Fibonacci Extension level.
- From above: The nearest level of resistance above 0.004 BTC lies at 0.0046 BTC and 0.0049 BTC. If the bulls break above the 0.005 BTC level, higher resistance can then be expected at 0.0052 BTC and 0.0054 BTC.
- From below: The nearest level of support now lies at 0.0042 BTC and 0.004 BTC, which is further strengthened by the rising trend line. Beneath the trend line, more support is expected at 0.0038 BTC and 0.00368 BTC.
- The trading volume has also remained consistently high for BNB against BTC.
- The RSI has managed to bounce at the 50 level which is a sign that the bulls have managed to remain in control of the market during the recent pullback.
SPECIAL OFFER (Sponsored)
LIMITED OFFER 2024 for CryptoPotato readers at Bybit: Use this link to register and open a $500 BTC-USDT position on Bybit Exchange for free!
Disclaimer: Information found on CryptoPotato is those of writers quoted. It does not represent the opinions of CryptoPotato on whether to buy, sell, or hold any investments. You are advised to conduct your own research before making any investment decisions. Use provided information at your own risk. See Disclaimer for more information.
Cryptocurrency charts by TradingView.