The recent months’ price surge of Binance Coin has started to stall over the past few days as the coin drops below $15 to where it is currently trading at $14.31. No asset can only rise with no corrections along the way.
Binance is expecting an unusual scheduled maintenance that will take place later on tonight. During periods of scheduled maintenance traders usually will liquidate their positions prior to the maintenance, in order to remove unnecessary risk. The maintenance is expected to last for 8 hours but this is just an estimated time period.
On the leading market cap table, Binance Coin has dropped to the 8th position as it currently holds a $2.04 billion market cap value.
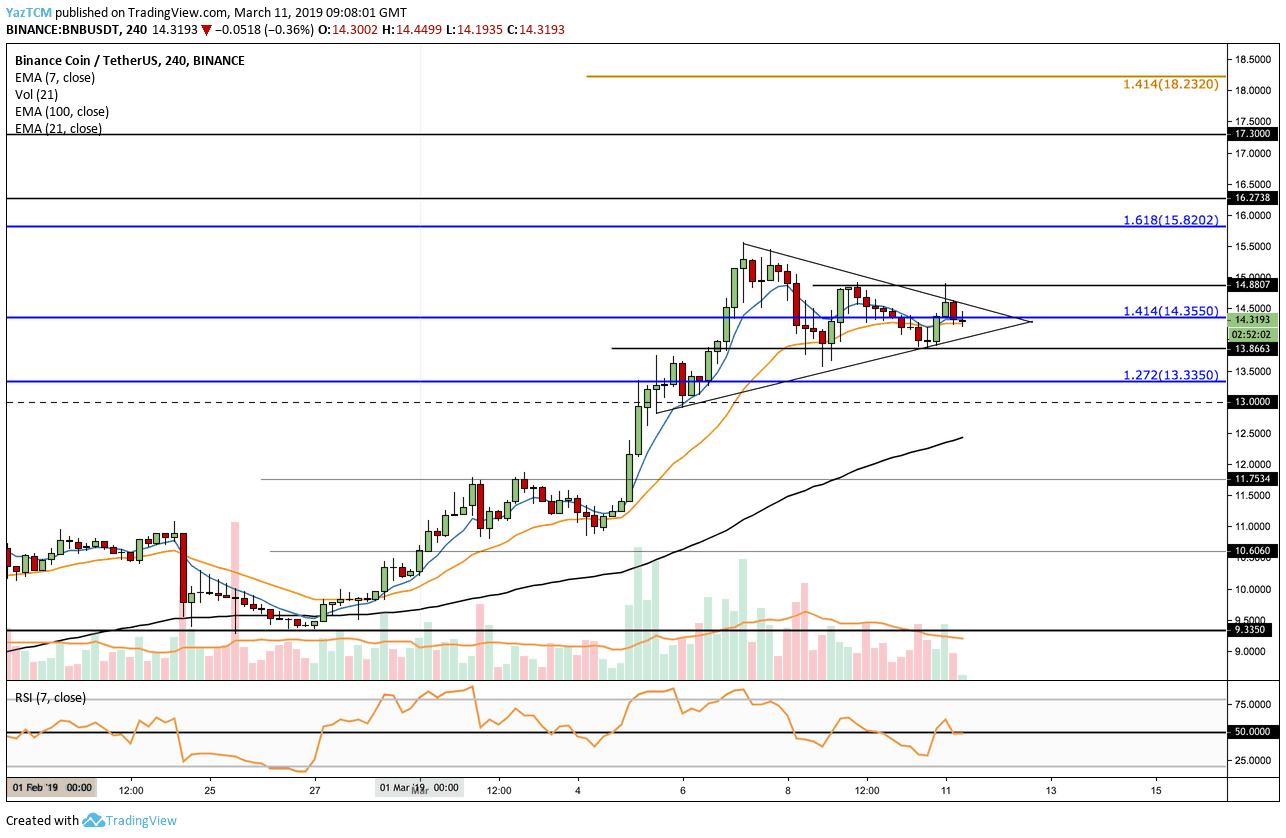
Looking at the BNB/USD 4HR Chart:
- Binance Coin had continued to surge slightly higher following our previous analysis. The market went on to reach a top around $15.50 before encountering resistance and rolling over. We can see that the market had dropped into support around the $13.86 level and has held this floor as it trades sideways.
- During this period of consolidation, we can see that the market has formed a short-term symmetrical triangle pattern and BNB is approaching the apex. At the apex, a breakout is expected either upward or downwards.
- From above: The nearest resistance above the triangle lies at the $14.88 and $15.50 levels. Higher resistance above this lies at $15.82, $16.27 and $17.30. If the buyers break above $18.00, we can expect more resistance at the $18.23 level where lies the short term 1.414 Fibonacci Extension level.
- From below: The nearest support beneath the triangle lies at $13.86. This is followed with support at $13.35 and $13.00. More support below $13.00 lies at $12.00 and $11.75.
- The RSI is currently trading on the 50 line which indicates indecision within the market.
- The trading volume is slowly decreasing.
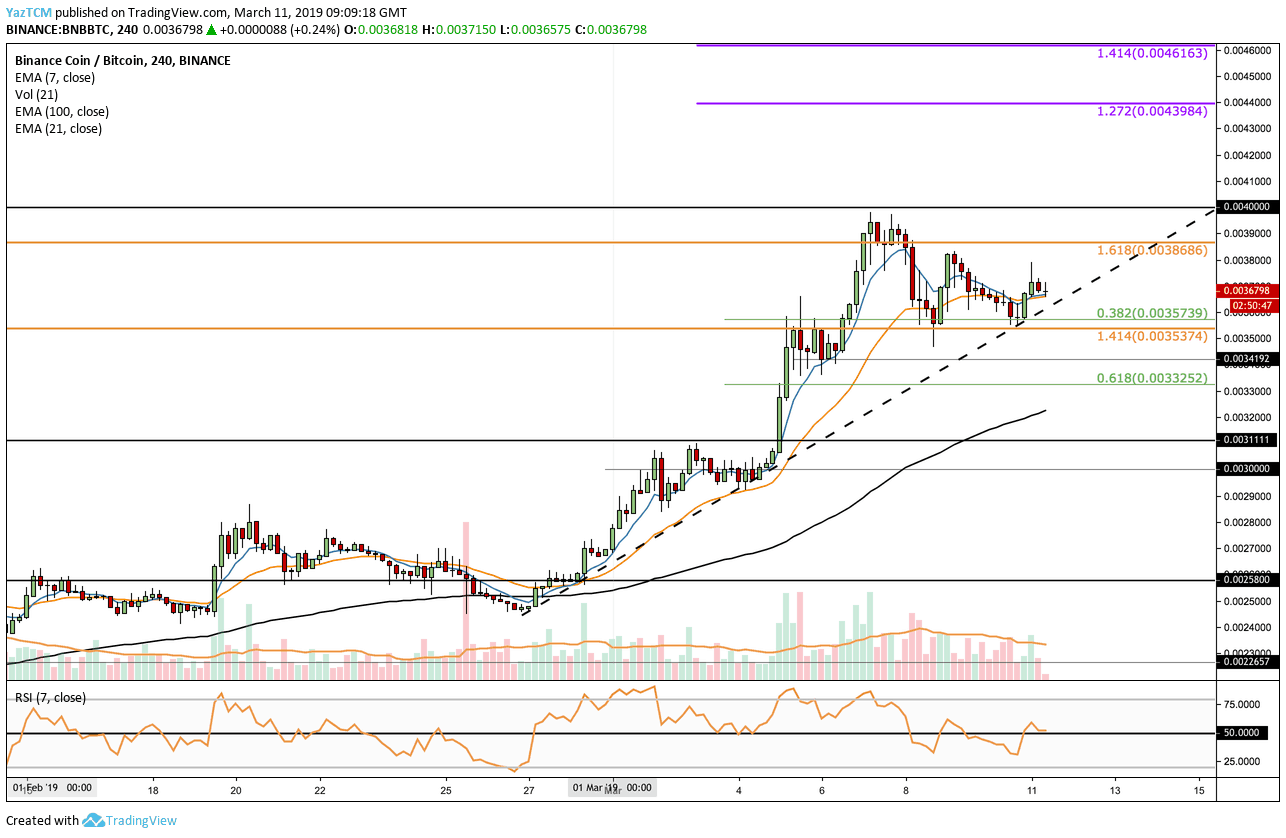
Looking at the BNB/BTC 4HR Chart:
- The price surge within BNB/BTC has also recently stalled after the coin nearly reached the 0.0040 BTC level. We can see that the market had dropped into support at the short term .382 Fibonacci Retracement level at 0.003573 BTC. Price action has also been trading above a very steep dashed ascending trend line.
- From above: The nearest resistance lies at 0.003868 BTC and 0.0040 BTC. IF the bulls can break above 0.004 BTC more resistance lies at the 1.272 (0.004398 BTC) and 1.414 (0.004616 BTC) Fibonacci Extension levels.
- From below: The nearest support lies at the steep dashed ascending trend line followed by support at 0.003573 BTC and 0.003500 BTC. Below, lies at 0.003419 BTC and 0.003325 BTC.
- The RSI is also trading along the 50 level which shows indecision in the market.
- The trading volume has also been decreasing over the past few days.
SPECIAL OFFER (Sponsored)
Binance Free $600 (CryptoPotato Exclusive): Use this link to register new account and receive $600 exclusive welcome offer on Binance (
full details).
LIMITED OFFER 2024 for CryptoPotato readers at Bybit: Use this link to register and open a $500 BTC-USDT position on Bybit Exchange for free!
Disclaimer: Information found on CryptoPotato is those of writers quoted. It does not represent the opinions of CryptoPotato on whether to buy, sell, or hold any investments. You are advised to conduct your own research before making any investment decisions. Use provided information at your own risk. See Disclaimer for more information.
Cryptocurrency charts by TradingView.