Once Bitcoin’s price had calmed down a bit, the bulls have started to wake up for Binance Coin as BNB increases by a further 4.35% over the past 24 hours, bringing the current price for the coin above $19.00. The cryptocurrency has seen a 26% increase over the past 30 days with a further, very impressive, 218% price surge over the past 90 days (and still 10% far from its all-time high).
Binance Coin remains in 7th place on the top cryptocurrencies by market-cap as it holds a $2.71 billion market cap value.
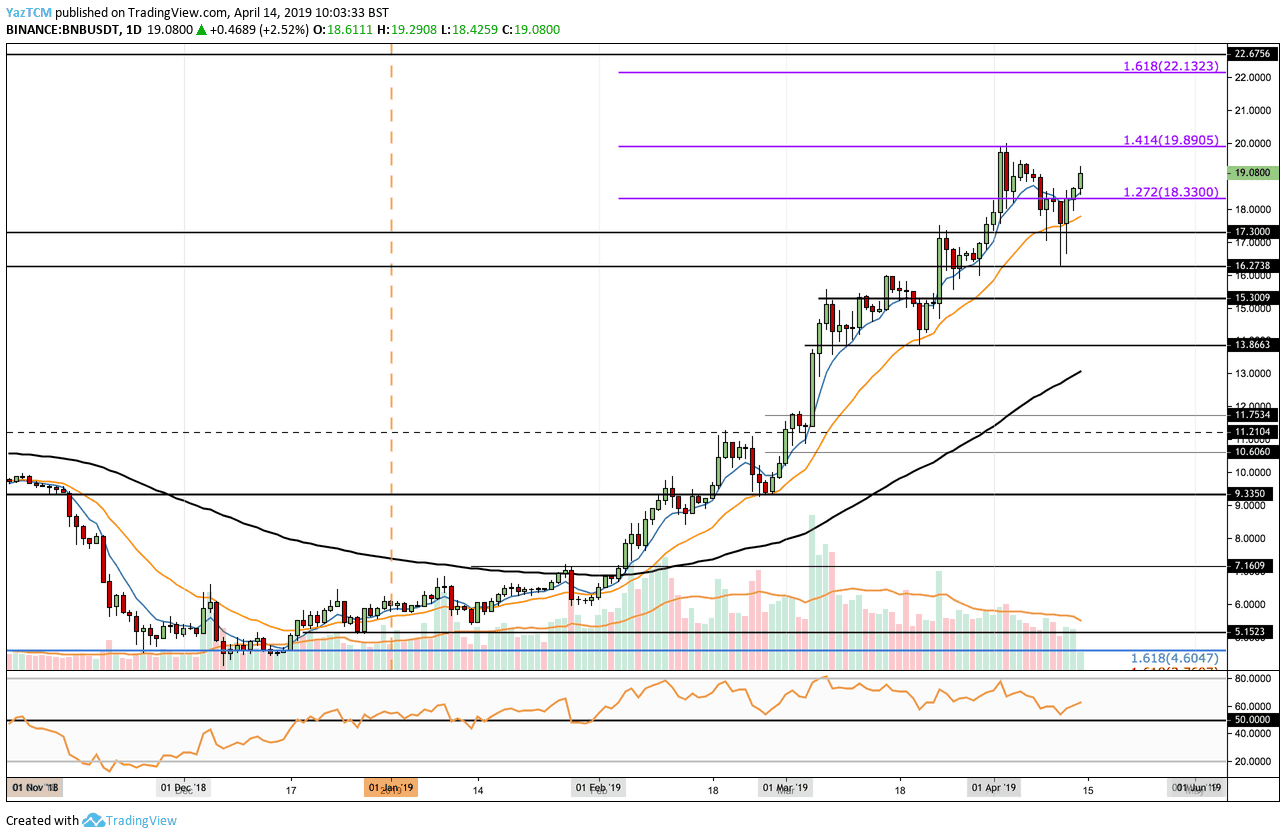
Looking at the BNB/USD 1-Day Chart:
- Since our last BNB/USD price analysis, we can see that the market had fallen right into the mentioned support at the $17.30 level. The coin had spiked lower into further support below at $16.27, but this was very short lived. Binance Coin has now risen back breaking up the $18.30 level of resistance as it is currently trading at $19.08.
- From above: The nearest level of resistance is located at the $19.90 – $20 area where lies the 1.414 Fibonacci Extension level (drawn in purple) priced at $19.89. This had marked the previous level of resistance on the beginning of April, and it’s not going to be easy to break up that zone. Higher resistance then lies at $21.00 and $22.13, where lies the 1.618 Fibonacci Extension level.
- From below: The nearest level of support now lies at $18.30. Below, further support lies at $17.30, $16.27 and $15.30.
- The trading volume remains above average but has started to show some signs of declining, might be due to the weekend.
- The RSI has recently bounced above the 50 level which indicates that the bulls are still in control of the market momentum.
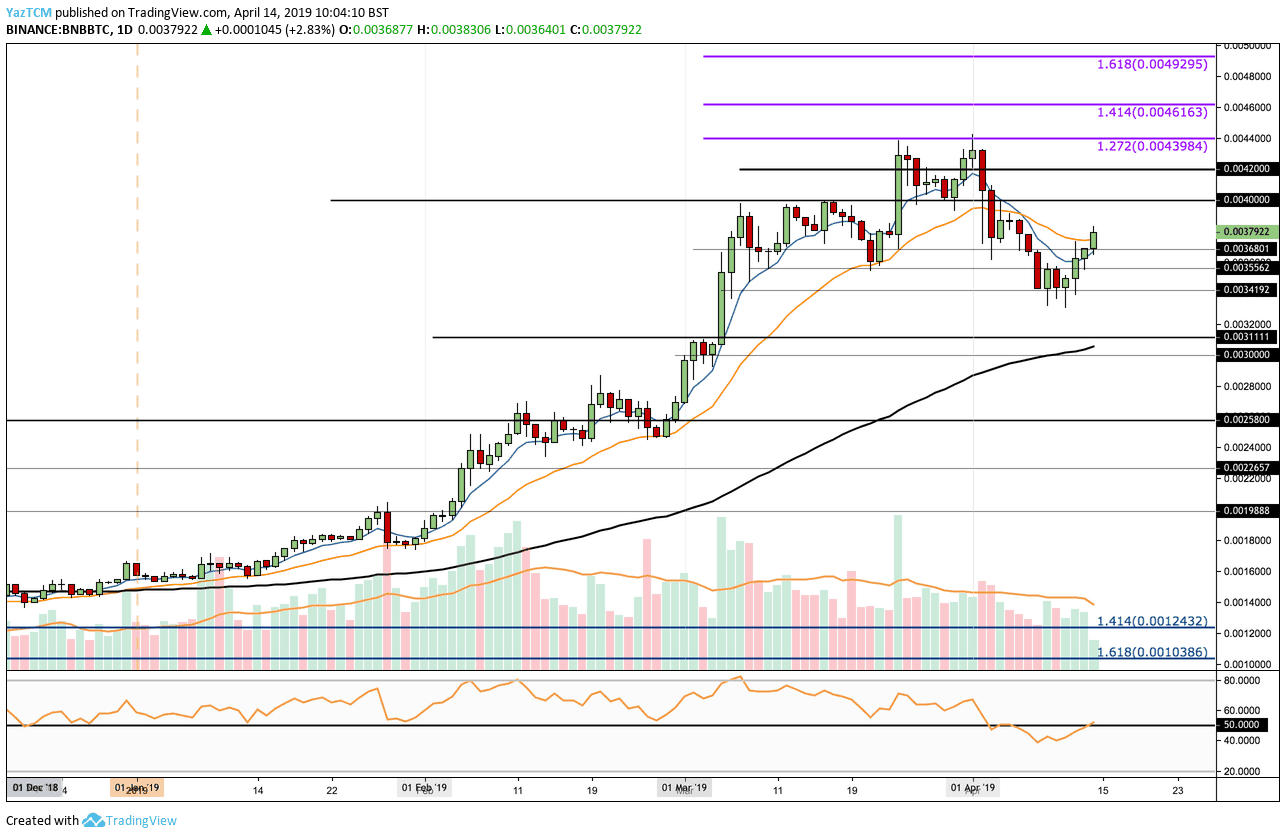
Looking at the BNB/BTC 1-Day Chart:
- Following our previous BNB/BTC analysis, we can see that BNB/BTC had also held strong at our mentioned support around the 0.00341 BTC level. The market has now rebounded and trades around 0.0038 BTC.
- From above: The nearest level of resistance now lies at 0.0040 BTC. Above this, further resistance can be expected at 0.0042 BTC and 0.0044 BTC, where lies a short term 1.272 Fibonacci Extension level. Above 0.0044 BTC, higher resistance can be expected at 0.0046 BTC (1.414 Fib Extension) and 0.004930 BTC (1.619 Fib Extension).
- From below: The nearest level of support now lies at 0.003680 BTC. Further support lies at 0.003560 BTC and 0.003420 BTC, before reaching the 0.003 – 0.003111 BTC area (along with the 100 days moving average line).
- The trading volume remains above average but has also seen some signs of decreasing over the past 4-5days.
SPECIAL OFFER (Sponsored)
LIMITED OFFER 2024 for CryptoPotato readers at Bybit: Use this link to register and open a $500 BTC-USDT position on Bybit Exchange for free!
Disclaimer: Information found on CryptoPotato is those of writers quoted. It does not represent the opinions of CryptoPotato on whether to buy, sell, or hold any investments. You are advised to conduct your own research before making any investment decisions. Use provided information at your own risk. See Disclaimer for more information.
Cryptocurrency charts by TradingView.