Binance Coin (BNB) has been on a significant surge since the beginning of February. Price action has continued its momentum over the past 24 hours rising by almost 10%. The cryptocurrency has now surged significantly by about 30% over the past seven days.
BNB has been recovering nicely since the precipitous price fall witnessed during November 2018 when price action fell from a high of $9.97 to a low of $4.12 toward the start of December 2018.
Binance Coin is now ranked in 10th position as it currently holds a market cap value of $1.23 billion. It is trading at a price of around $8.70, at the time of writing.
The coin has recently reached resistance at the bearish 0.786 Fibonacci Retracement level (marked in red) located at $8.73 which has caused the pace of the rally to slow up.
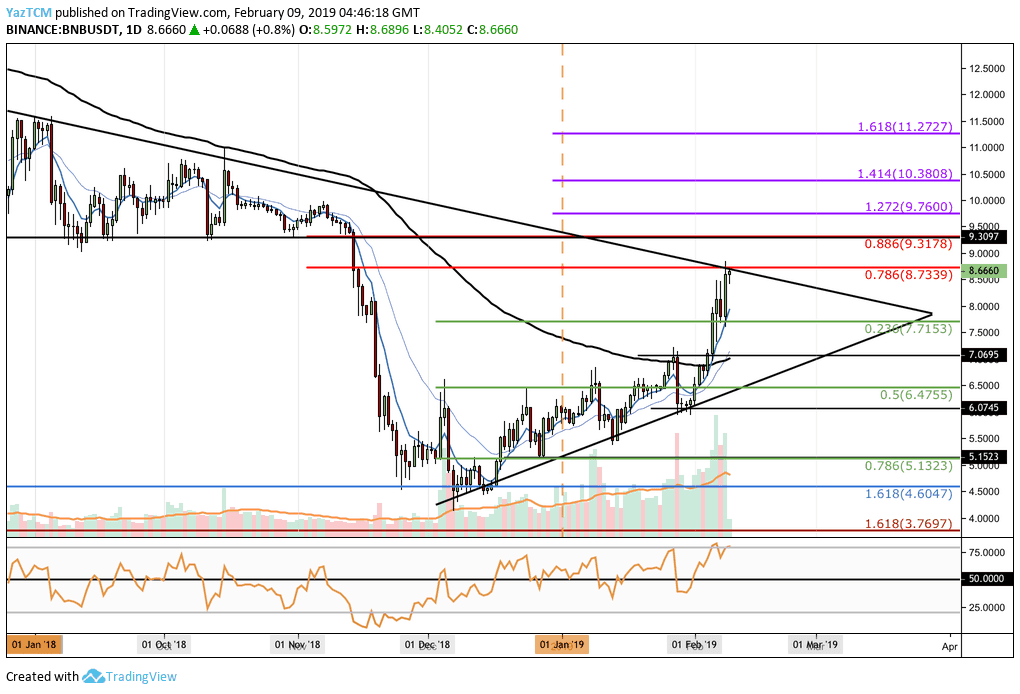
Looking at the BNB/USD 1-Day Chart:
- The market has recently reached the resistance above at the $8.73 handle. This area of resistance is also bolstered by a long term downward descending trend line which dates all the way back to August 2018.
- Support toward the downside is located at the short term 0.236 Fibonacci Retracement level (marked in green) found at $7.71.
- The further support level located at $7.06. This level had provided resistance for the market during January 2019, and is now has turned into a support The next support levels for the short term are the .5 Fibonacci Retracement (marked in green) found at $6.47, followed by the $6.07 support level.
- From above; as mentioned, if the bulls break above $8.73 along with the resistance at the upper boundary of the triangle, we can then expect higher targets located at the bearish .886 Fibonacci Retracement level (marked in red) at $9.31.
The above level had provided strong support for the market during August 2018 to mid-November 2018 and therefore is expected to become strong resistance moving forward.
- Further is expected at the short term 1.272 and 1.414 Fibonacci Extension levels (marked in purple) located at $9.76 and $10.38, respectively.
- Since the beginning of February 2019, we can see that BNB price action has now broken above the 100-day moving average (MA). The 7-days MA and the 21-days MA have also now crossed up above the 100-day MA, creating a further bullish crossover signal.
- The RSI has recently reached the overbought area and has rolled over slightly. The RSI can remain in overbought territory for extended However, it will eventually need to retrace at some point.
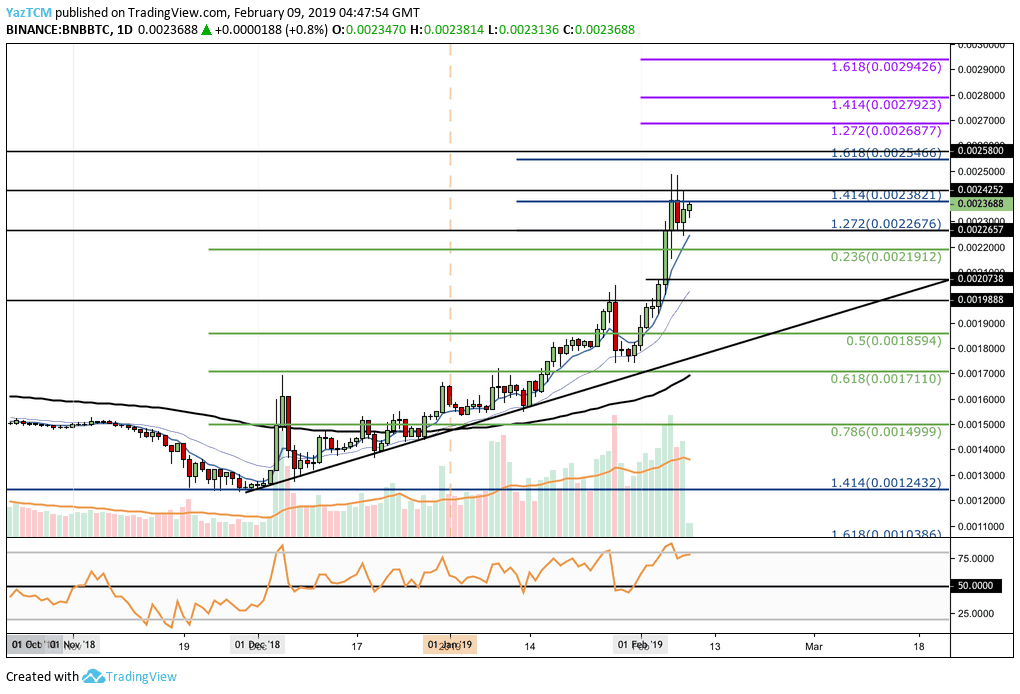
Looking at the BNB/BTC 1-Day Chart:
- We can see that price action has recently reached resistance at a medium termed 1.414 Fibonacci Extension level (marked in blue) located at 0.0023821 BTC.
- Support now toward the downside is initially located at support from June 2018 at 0.0022676 BTC. This is also the 1.272 Fibonacci Extension level (marked in blue).
- If the sellers continue to drive price action lower, support lies at .236 Fibonacci Retracement levels (marked in green) or 0.002191 BTC.
- This is followed up with a support area at the 0.0019888 BTC level. This level had provided resistance for the market during January 2019 and is expected to provide strong support then.
- Further support beneath can be located at the .5 and .618 Fibonacci Retracement levels (marked in green) at 0.001859 BTC and 0.001711 BTC, respectively.
- From above; resistance lies at 0.002382 BTC, breaking up can send BNB to retest higher resistance at the medium termed 1.618 Fibonacci Extension level (marked in blue) priced at 0.0025466 BTC.
- Further higher resistance is located at the short term 1.272 and 1.414 Fibonacci Extension levels (marked in purple) priced at 0.0026877 BTC and 0.002792 BTC, respectively.
- We can see that the 7-days MA, 21-days MA, and 100-day MA are all aligned, which proves bullishness.
- The RSI has also rolled over at the overbought conditions. This indicates the market needs a break of some sort before being able to continue with this bullish surge.
SPECIAL OFFER (Sponsored)
LIMITED OFFER 2024 for CryptoPotato readers at Bybit: Use this link to register and open a $500 BTC-USDT position on Bybit Exchange for free!
Disclaimer: Information found on CryptoPotato is those of writers quoted. It does not represent the opinions of CryptoPotato on whether to buy, sell, or hold any investments. You are advised to conduct your own research before making any investment decisions. Use provided information at your own risk. See Disclaimer for more information.
Cryptocurrency charts by TradingView.