After such an epic run for Binance Coin, BNB coin has lost 6% over the previous 24 hours of trading, which brings the current price down to around $10.30. However, it is important to mention that the market is still up by over 17% weekly gains.
It is likely that this recent price decline is due to the parabolic price increase seen throughout the past month within Binance Coin after rising by over 90% in February alone.
Binance Coin remains ranked at the 10th position as it currently holds a market cap value of $1.46 billion.
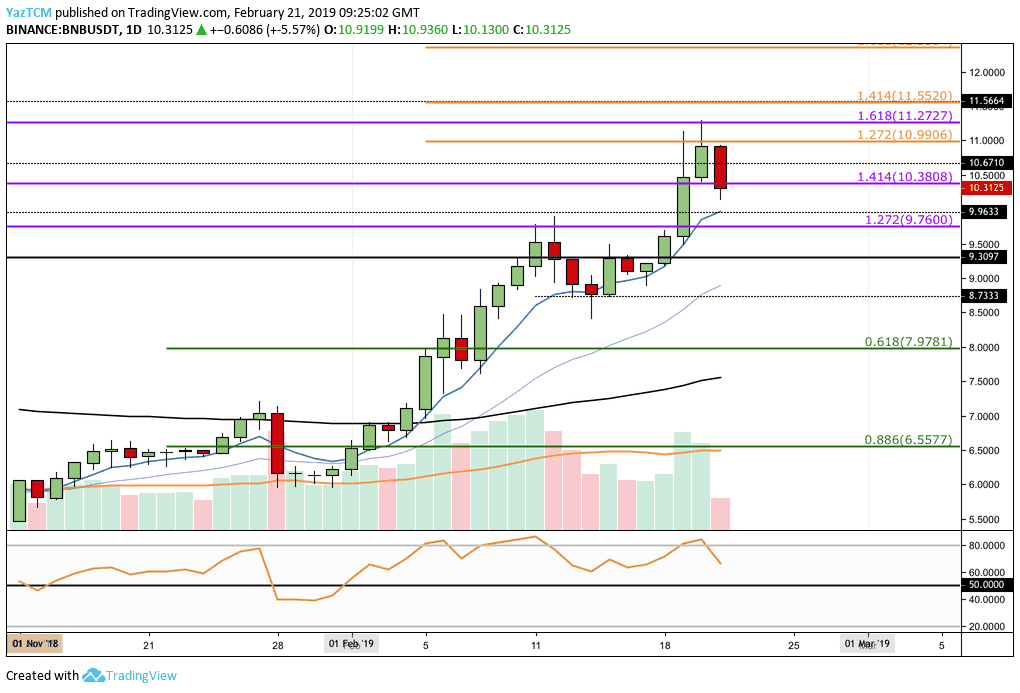
Looking at the BNB/USD 1-Day Chart:
- Binance Coin has continued to surge following our previous BNB analysis, breaking above $10.00 as it reaches resistance at the medium termed 1.618 Fibonacci Extension level around $11.27 (marked in purple) before reversing.
- Price action has fallen slightly as it now sits slightly below support at the medium-term 1.414 Fibonacci Extension level located at $10.38 (marked in purple).
- From below: The nearest level of support beneath $10.00 is located at $9.30, and $9.00. Support beneath $9.00 lies at $8.73 and then short term .618 Fibonacci Retracement level around $7.97(marked in green).
- From above: The nearest level of resistance lies at the short term 1.272 Fibonacci Extension level around $11 (marked in orange).
- Significant resistance above this lies at $11.55 (September 2018 high) and then $12.00.
- There is some divergence between RSI and price action which indicates that the bullish momentum may stall before being able to reach higher. The RSI remains above the 50 area but is currently facing down.
- The trading volume remains steady and slightly increase.
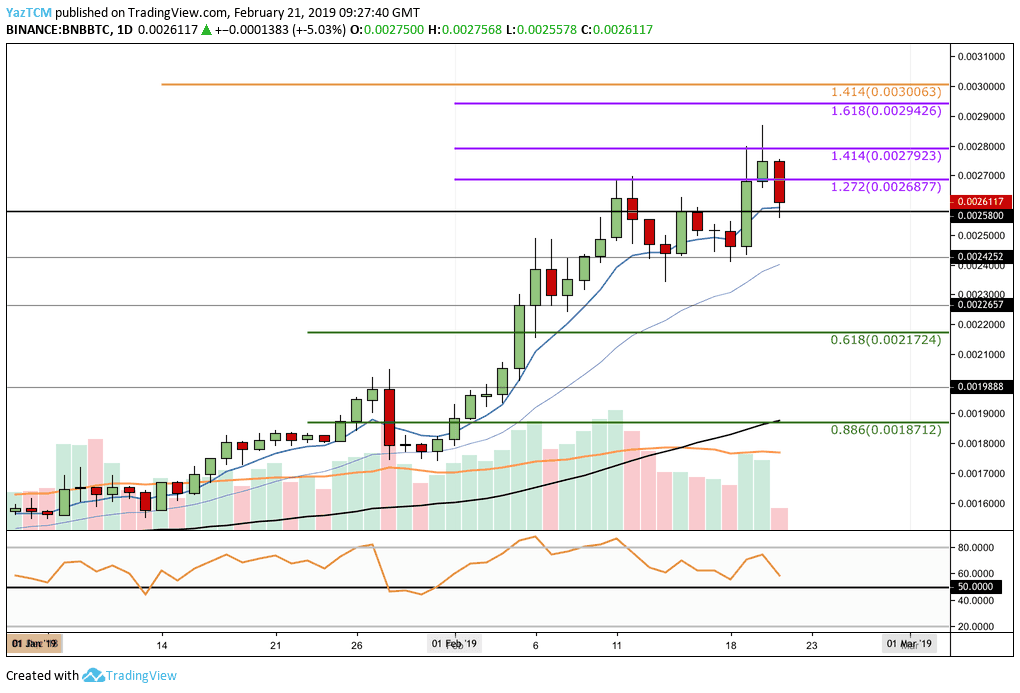
Looking at the BNB/BTC 1-Day Chart:
- BNB/BTC has also surged above the previously identified resistance at the short term 1.272 Fibonacci Extension level around 0.0026877 BTC (marked in purple). However, the price action rejected to break above the higher resistance at 0.0028 BTC and has since then reversed.
- The price action is now trading around support at the 0.00258 BTC level.
- From below: The nearest support beneath 0.002580 BTC is expected at 0.002425 BTC.
- This is followed up by the significant support level of 0.0022 BTC and the .618 Fibonacci Retracement level around 0.002172 BTC (marked in green).
- From above: The nearest significant resistance lies at 0.0028 BTC.
- If the bulls break above 0.0028 BTC, we can expect higher resistance at the 0.002942 BTC level followed by resistance at the medium termed 1.414 Fibonacci Extension level around 0.0030 BTC (marked in orange).
- There is also a divergence between price action and RSI on BNB/BTC. This indicates that the bulls may be overstretched and the short-term momentum might be changed soon.
- The trading volume seems to have declined slightly but remains above the average.
SPECIAL OFFER (Sponsored)
LIMITED OFFER 2024 for CryptoPotato readers at Bybit: Use this link to register and open a $500 BTC-USDT position on Bybit Exchange for free!
Disclaimer: Information found on CryptoPotato is those of writers quoted. It does not represent the opinions of CryptoPotato on whether to buy, sell, or hold any investments. You are advised to conduct your own research before making any investment decisions. Use provided information at your own risk. See Disclaimer for more information.
Cryptocurrency charts by TradingView.