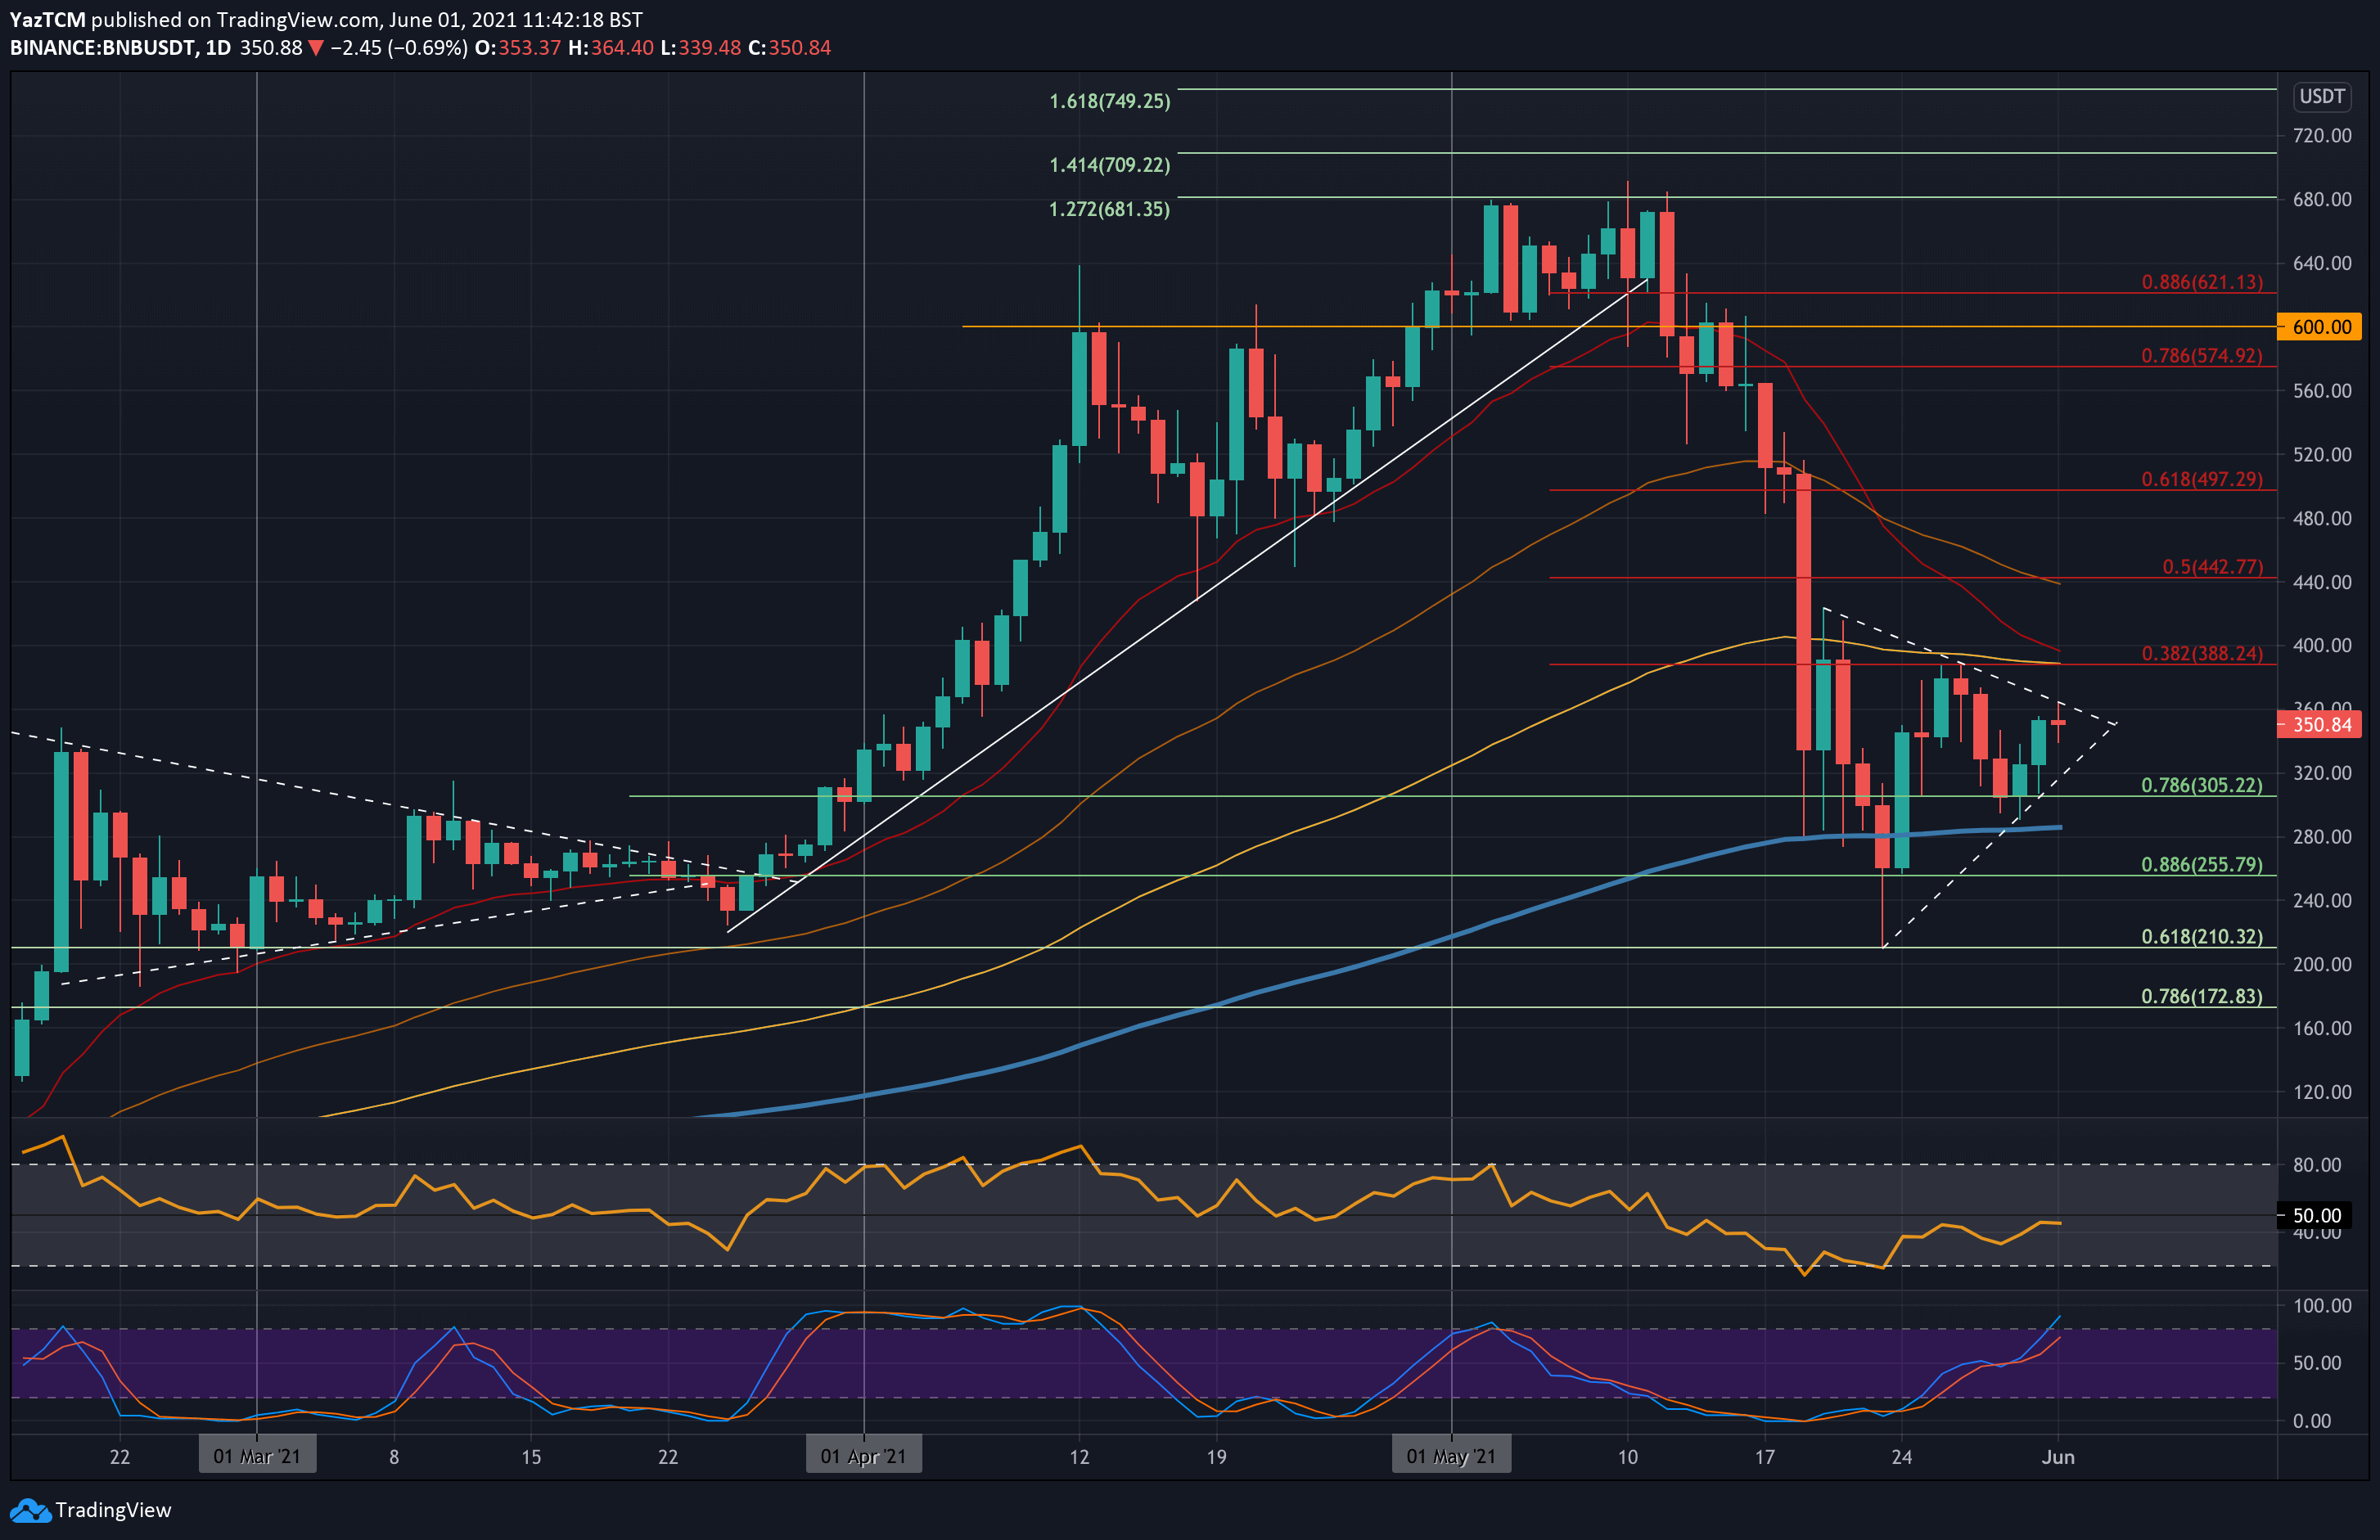
BNB/USD Daily Chart. Source: TradingView.
Key Support Levels: $320, $305, $280.
Key Resistance Levels: $360, $388, $400.
BNB is currently trading inside a short-term symmetrical triangle pattern. It had rebounded from support at $255 during the capitulation week and pushed higher to meet resistance at $388 (bearish .382 Fib) last week.
From there, it headed lower throughout the rest of last week and eventually found support at $305 (.786 Fib). This week, BNB has rebounded and is now testing the upper angle of the current symmetrical triangle that has formed at $360. A break above this would allow a test of the resistance at $388 again.
Moving forward, the first resistance above $360 lies at $388 (bearish .382 Fib & 100-day MA). This is followed by $400 (20-day MA), $442 (bearish .5 Fib & 50-day MA), and $480.
On the other side, the first support lies at $320 (lower angle of the triangle). This is followed by $305 (.786 Fib), $280 (200-day MA), and $255 (.886 Fib).
The RSI has returned to the midline to indicate the previous bearish momentum has faded. However, to break the current triangle, it must break above the midline to introduce bullish momentum into the market.
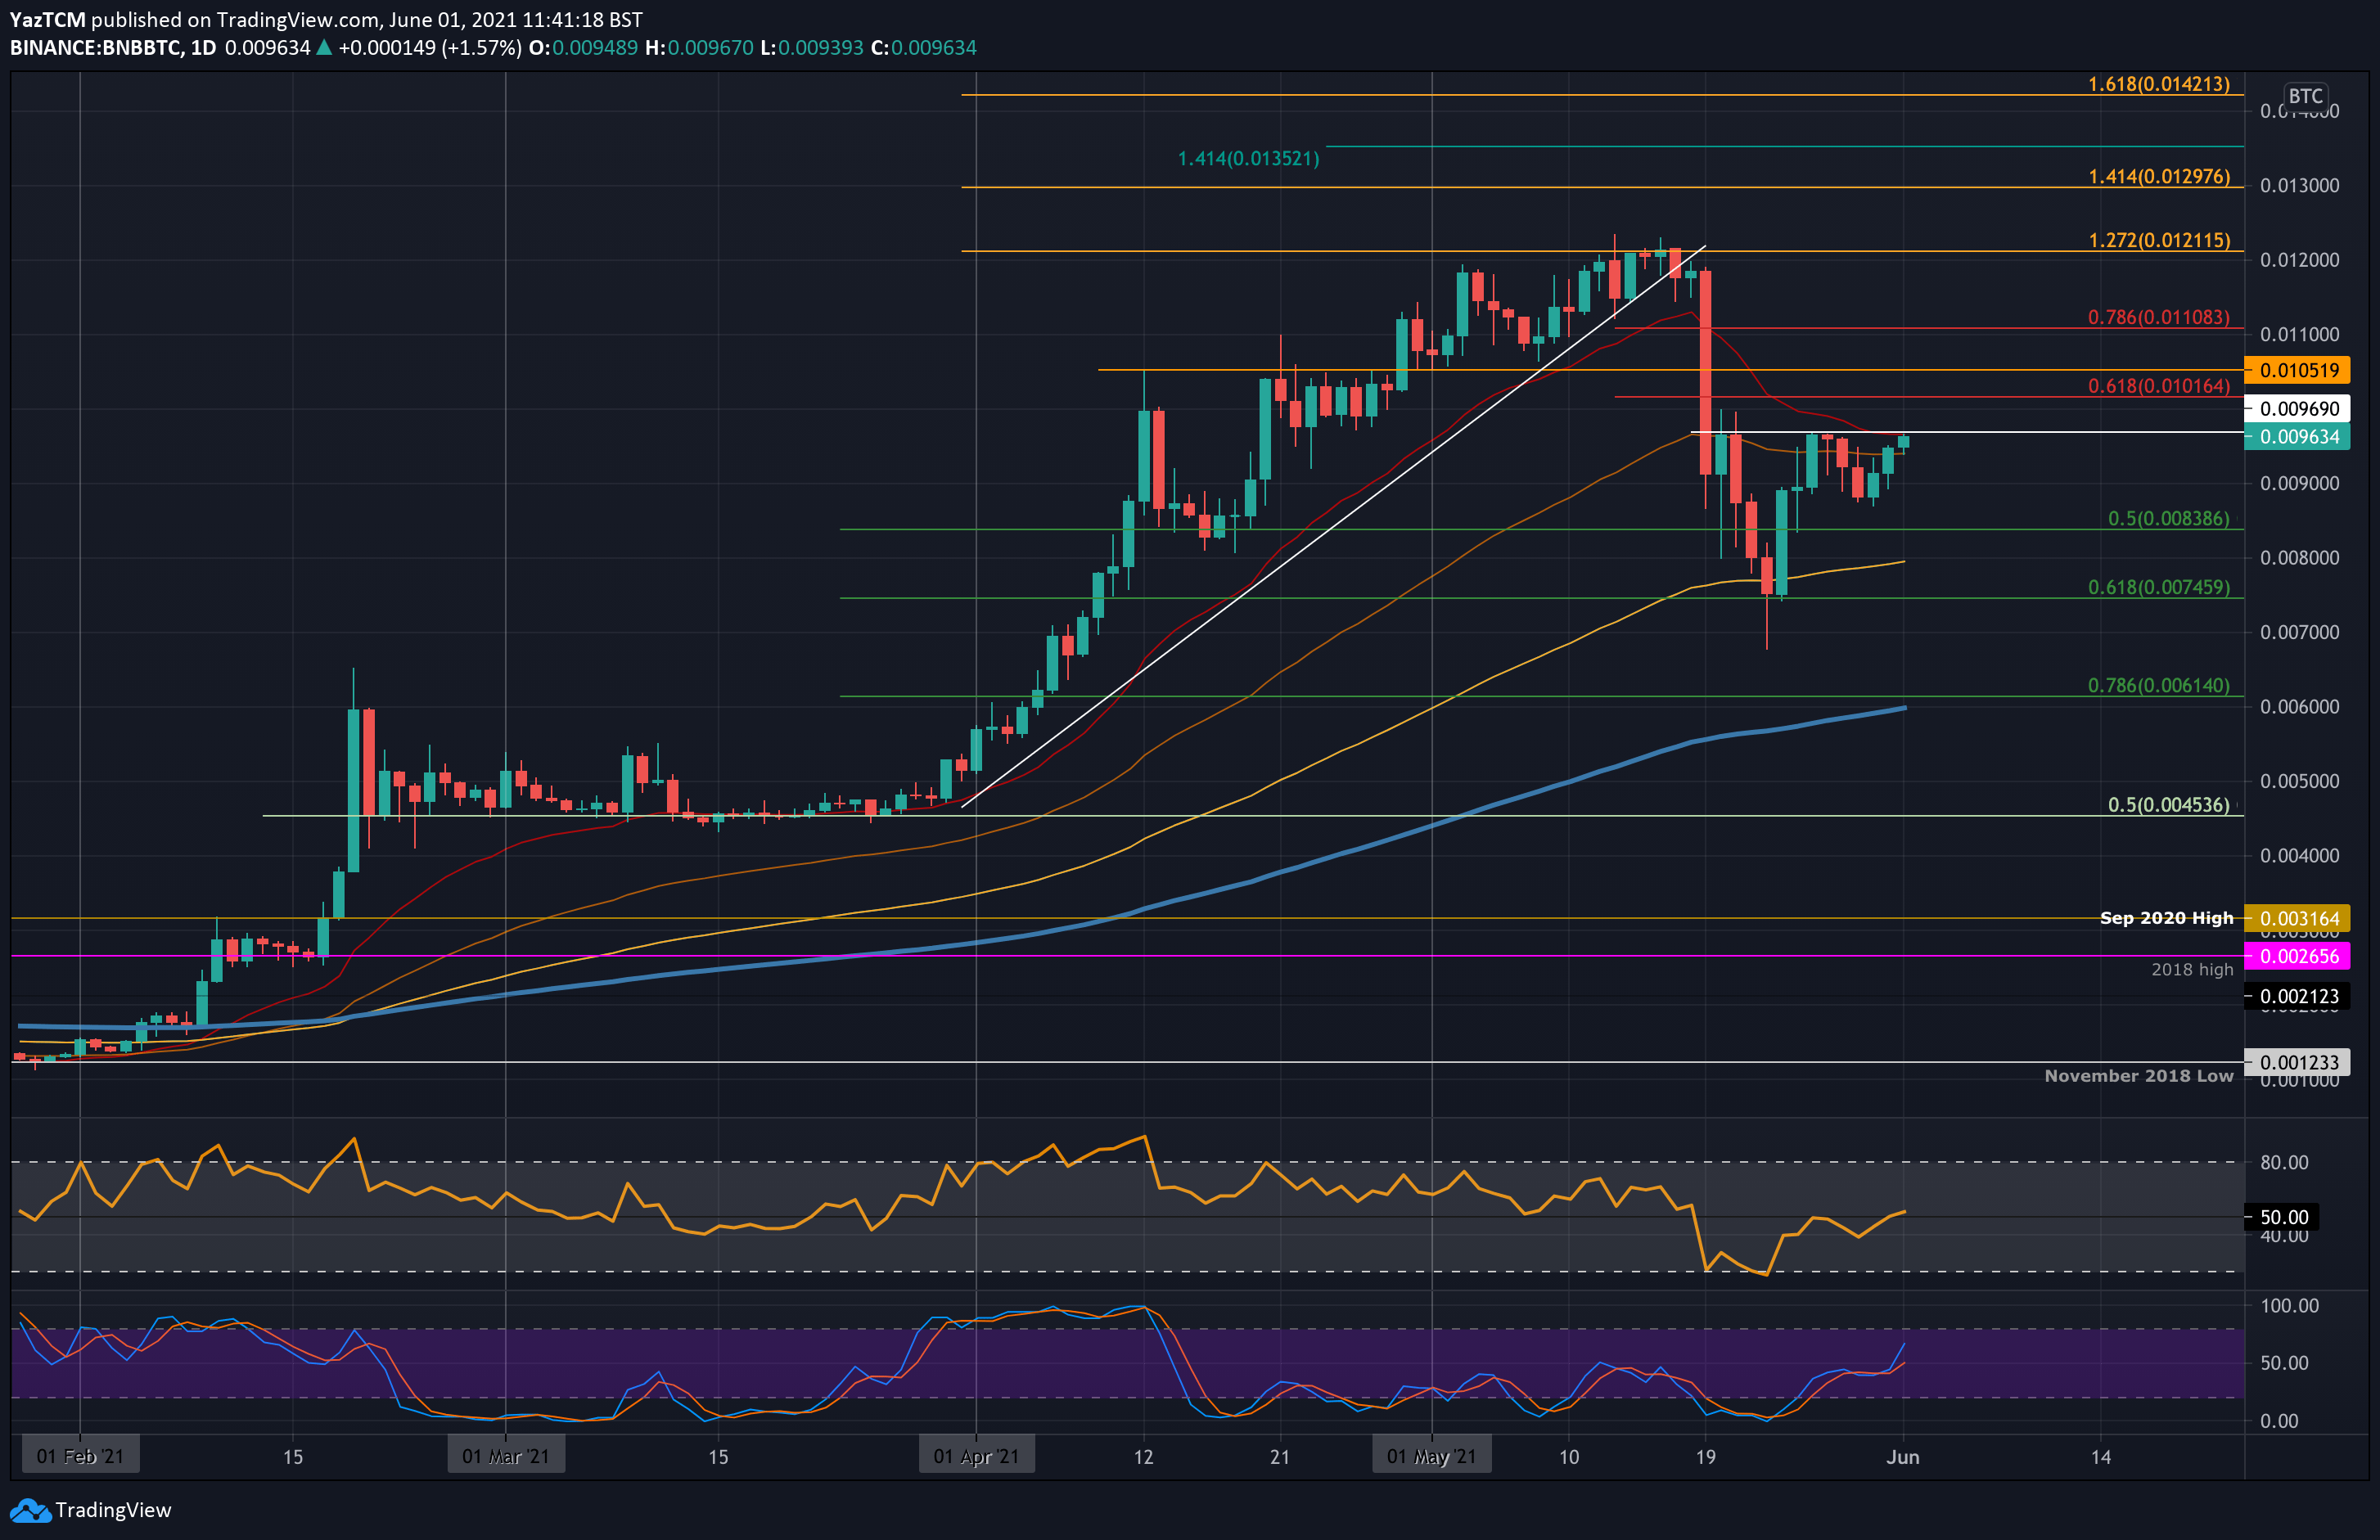
Key Support Levels: 0.009 5BTC, 0.009BTC, 0.00838 BTC.
Key Resistance Levels: 0.00969 BTC, 0.0101 BTC, 0.0105 BTC.
BNB rebounded from 0.075 BTC (.618 Fib) during the mass capitulation seen in the entire market earlier in the month. From there, it rebounded to test resistance at 0.00969 BTC last week. It was unable to break this resistance and ended up falling beneath 0.009 BTC over the weekend.
This week, BNB climbed back above 0.009 BTC and the 100-day MA at 0.0095 BTC and is currently testing last week’s 0.00969 BTC resistance again.
Looking ahead, if the buyers can break 0.00969 BTC, the first resistance lies at 0.0101 BTC (bearish .618 Fib). This is followed by 0.0105 BTC, 0.011 BTC (bearish .786 Fib), and 0.0121 BTC (1.272 Fib Extension).
On the other side, the first support lies at 0.0095 BTC (50-day MA0. This is followed by 0.009 BTC, 0.00838 BTC (.5 Fib), and 0.008 BTC (100-day MA).
The RSI is starting to shape itself above the midline as the buyers attempt to gain control of the market momentum. It would need to continue further above the 50 level for the market to penetrate the current 0.00969 BTC resistance.