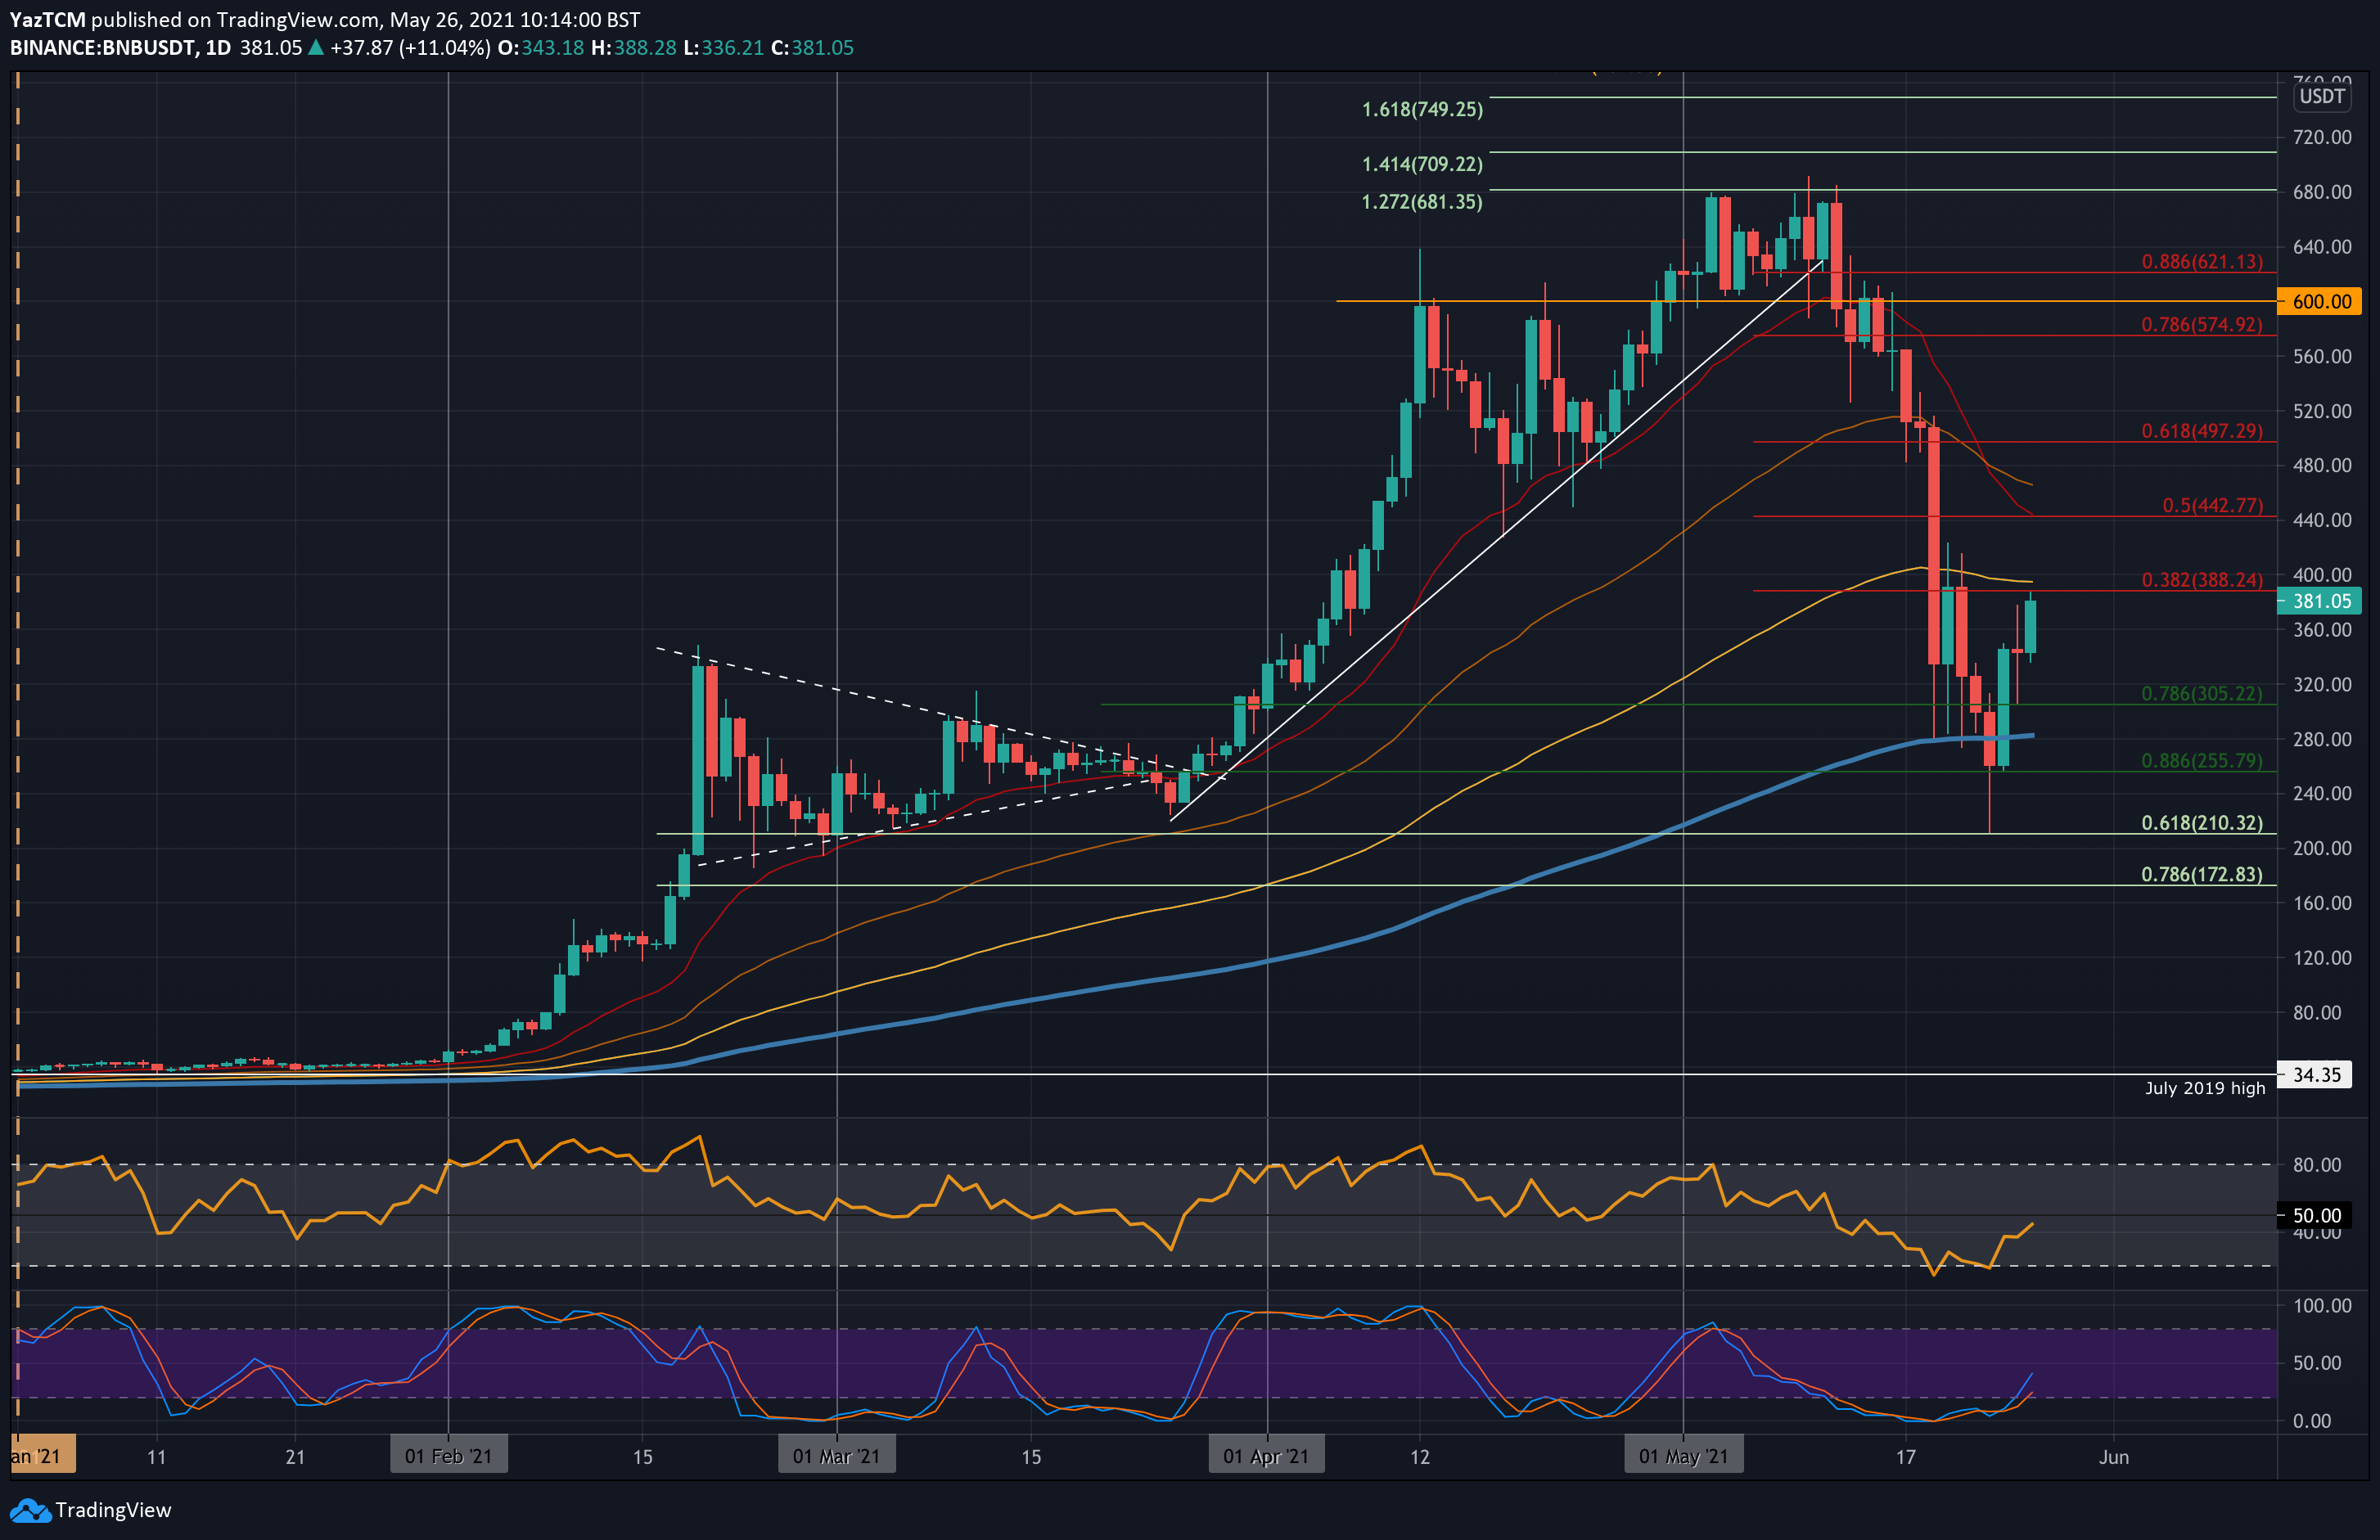
BNB/USD Daily Chart. Source: TradingView
Key Support Levels: $360, $305, $280.
Key Resistance Levels: $388, $400, $442.
BNB had already dropped from $680 to reach as low as $560 before the market capitulation last Wednesday. During the crypto-wide sell-off, BNB continued to fall beneath $500 until support was reached at the 200-day MA around $280.
It continued to decrease during the remainder of last week until lower support was found at $255 (.886 Fib) on Sunday. BNB did spike as low as $210 but quickly rebounded from the support there provided by a longer termed .618 Fib Retracement.
It managed to rebound from there on Monday as it broke back above the 200-day MA and climbed beyond $300. BNB continued higher today as it reached resistance at around $400 today, provided by a bearish .382 Fib Retracement.
Moving forward, the first resistance above $388 lies at $400 (100-day MA). This is followed by $442 (bearish .5 Fib & 20-day MA), $480, and $500 (bearish .618 Fib).
On the other side, the first support lies at $360. This is followed by $305 (.786 Fib), $280 (200-day MA), and $255 (.886 Fib).
The RSI is making its way back to the midline again as the previous bearish momentum is starting to fade quickly. It would need to continue beyond the midline before the bullish momentum might return to the market properly.
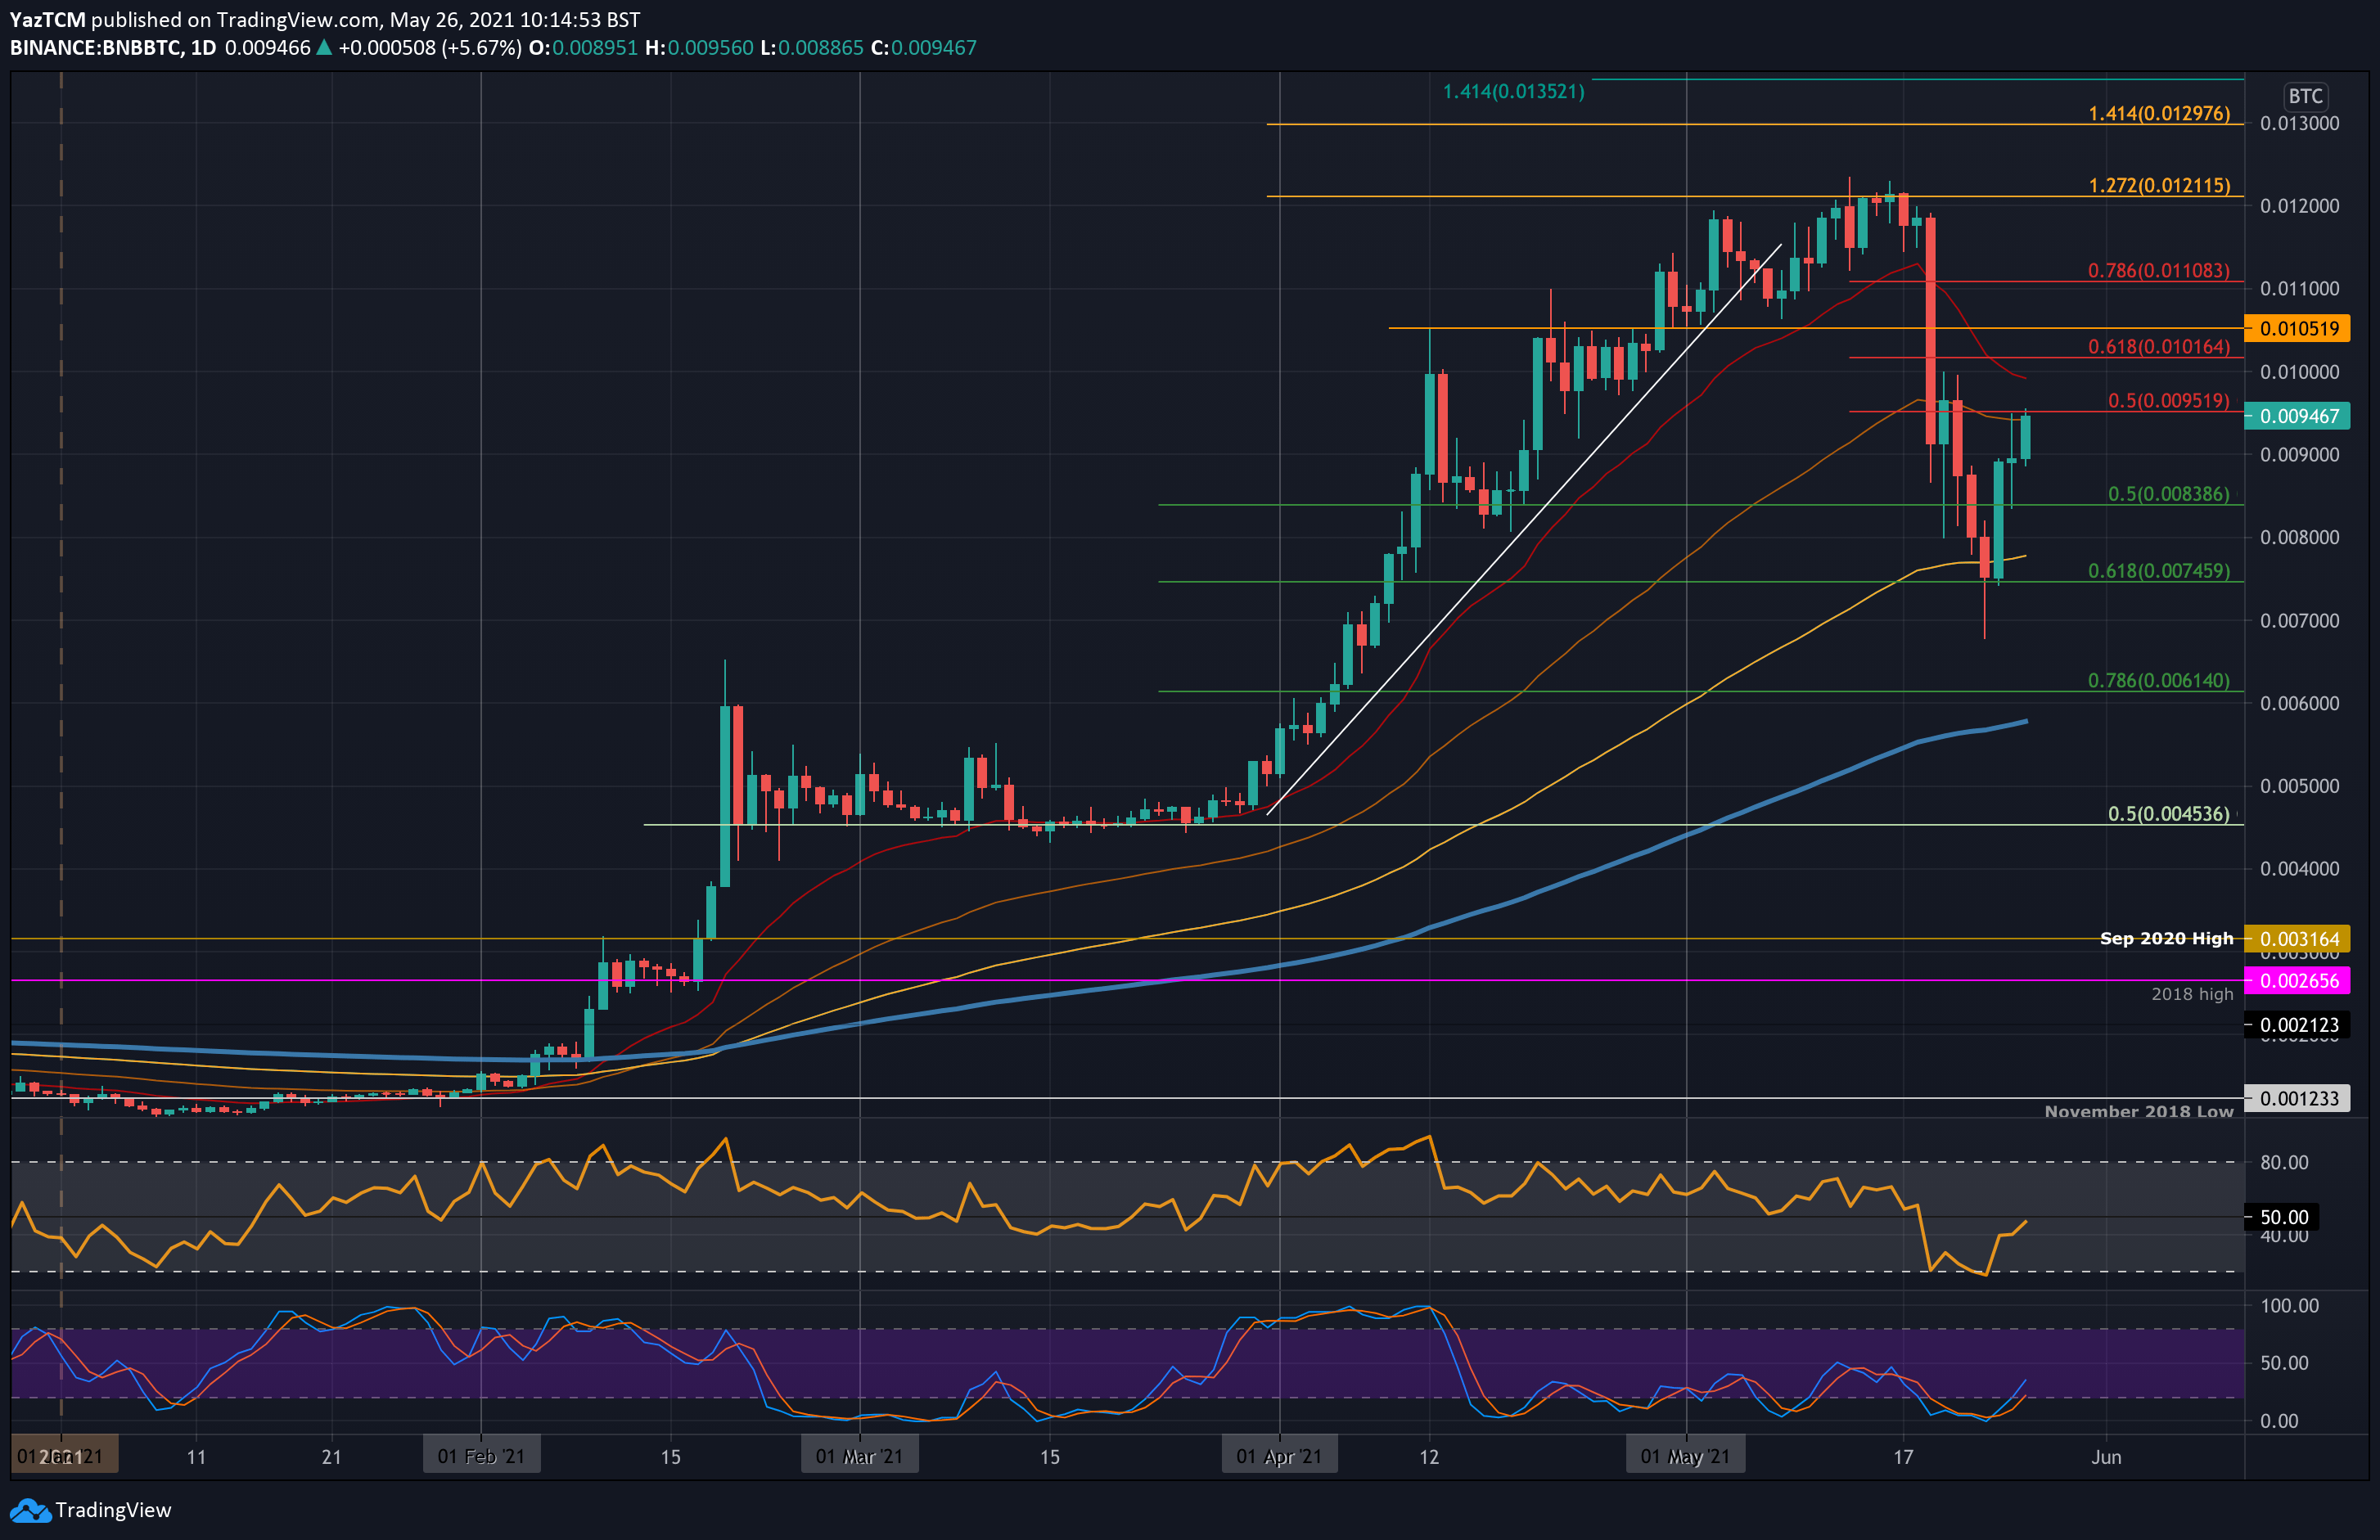
Key Support Levels: 0.009 BTC, 0.00838 BTC, 0.008 BTC.
Key Resistance Levels: 0.00951 BTC, 0.01 BTC, 0.0101 BTC.
BNB suffered last Wednesday as it dropped from 0.012 BTC and fell as low as 0.007 BTC on Sunday. However, it managed to close the daily candle on Sunday at 0.00745 BTC (.618 Fib) after the bulls recovered from the 0.007 BTC low. It rebounded from there on Monday and managed to climb above 0.009 BTC yesterday.
Today, BNB managed to break the 50-day MA but is struggling to break resistance at 0.00951 BTC, provided by a bearish .5 Fib.
Looking ahead, the first resistance lies at 0.00951 BTC (bearish .5 Fib). This is followed by 0.01 BTC (20-day MA), 0.0101 BTC (bearish .618 Fib), and 0.011 BTC (bearish .786 Fib).
On the other side, the first support lies at 0.009 BTC. This is followed by 0.00838 BTC (.5 Fib), 0.008 BTC, and 0.00745 BTC (.618 Fib).
Likewise, the RSI has rebounded from oversold conditions and is returning near the midline, indicating the bearish momentum has faded. Additionally, the Stochastic RSI produced a bullish crossover signal.