Basic Attention Token (BAT) has risen by a further 7% over the past 24 hours of trading, bringing the price of the coin up to around $0.37. The cryptocurrency has had an impressive run during April and the rest of 2019: an increase of almost 100% over the past 30 days and a further impressive 200% over the past 90 days.
BAT is currently placed as the 22nd place in the top cryptocurrencies by market cap value as it currently holds a $463 million market cap. The unique browser is currently trading at a value 57% lower than its all-time high price.
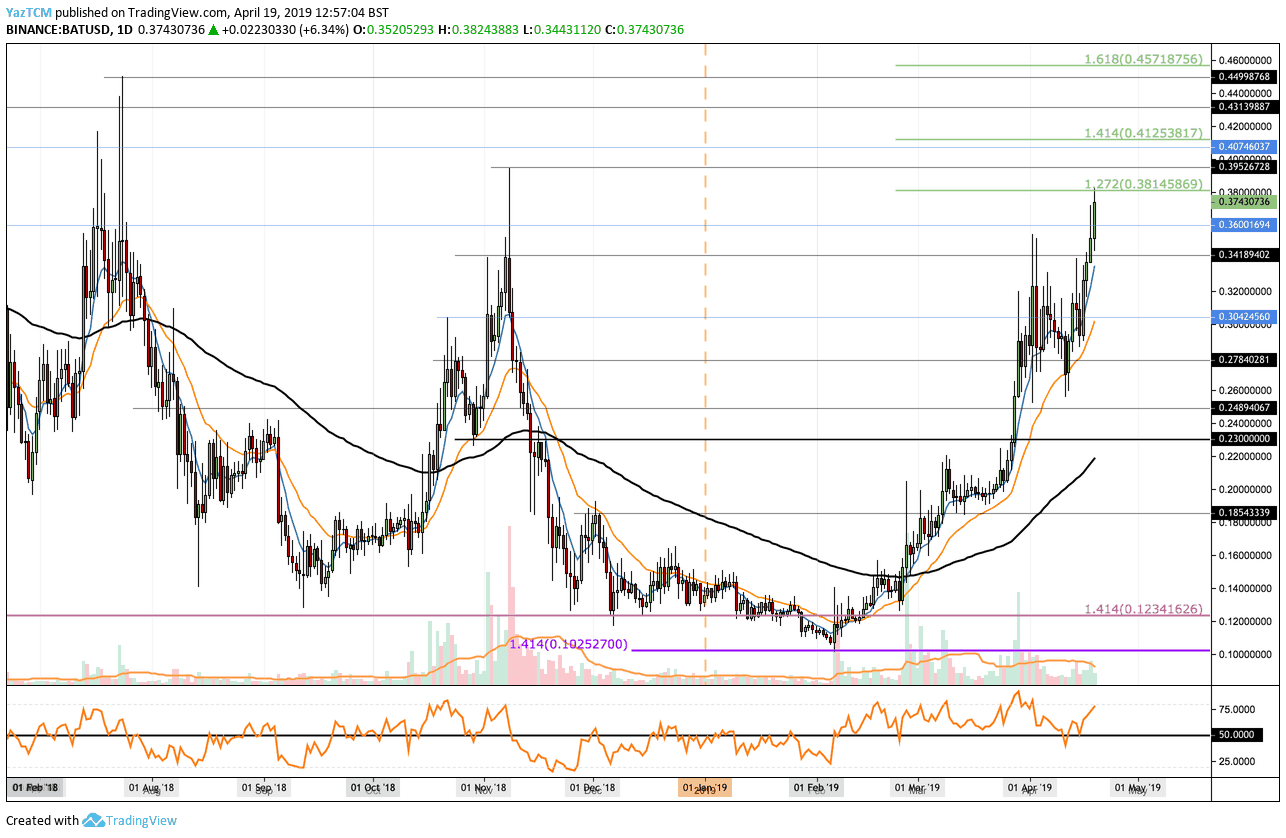
Looking at the BAT/USD 1-Day Chart:
- Against the USD, we can see that the market has had a remarkable recovery during 2019, as a part of the Altcoin Season. The coin had managed to break above the 100 days moving average during February 2019 and has been surging ever since. BNB/USD has now climbed above the November highest at $0.34 and has recently met resistance at $0.3815 where lies a 1.272 Fibonacci Extension level.
- From above: The nearest level of resistance above $0.39 lies between $0.3950 and $0.40. Further resistance above can then be expected at $0.4125 and $0.4313. Before reaching the July 2018 high at $0.4499, and at $0.4571 where lies the 1.618 Fibonacci Extension level.
- From below: Initial support now lies at $0.36, $0.34 and 0.32$. Further support can then be found at $0.30 and $0.2784.
- The trading volume has started to show signs of increasing over the past few days which is a good sign for the bullish momentum.
- The RSI indicates that the bulls have managed to remain in control of the momentum which is steadily increasing toward the bullish favor.
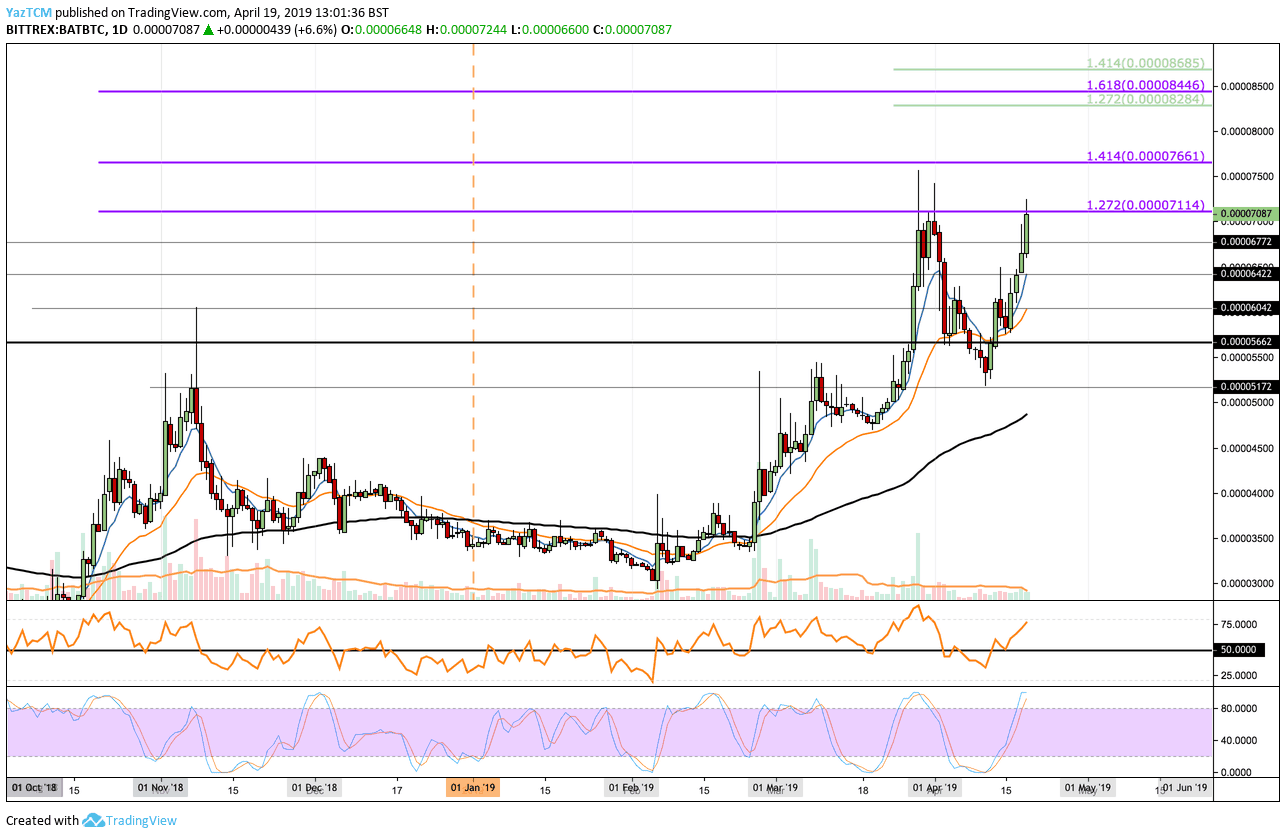
Looking at the BAT/BTC 1-Day Chart:
- BAT has also been creating fresh highs against BTC during 2019: The coin had broken above the 100-days moving average line during the end of February and has recently surged into resistance at 7114 SAT where lies a 1.272 Fibonacci Extension level.
- From above: If the buyers break above 7114 SAT, initial resistance lies at 7660 SAT along with the 1.414 Fibonacci Extension level. Above lies resistance at 8000 SAT, and 8500 SAT along with the 1.618 Fibonacci Extension level.
- From below: The nearest level of support lies at 6772 SAT. Beneath this, further support is expected at 6422 SAT and 6000 SAT. Below, further support lies at 5662 SAT and 5172 SAT.
- The trading volume has also spiked higher recently during the bullish surge.
- The RSI has broken back above the 50 level as the bulls resume control of the momentum. However, the Stochastic RSI is about to cross over at the overbought area.
SPECIAL OFFER (Sponsored)
LIMITED OFFER 2024 for CryptoPotato readers at Bybit: Use this link to register and open a $500 BTC-USDT position on Bybit Exchange for free!
Disclaimer: Information found on CryptoPotato is those of writers quoted. It does not represent the opinions of CryptoPotato on whether to buy, sell, or hold any investments. You are advised to conduct your own research before making any investment decisions. Use provided information at your own risk. See Disclaimer for more information.
Cryptocurrency charts by TradingView.