BAT saw a 7% increase today and it currently trades at $0.25. This price increase comes at the same time the entire market is collapsing. It seems that BAT is battling against the overall trend after surging by a total of 24% over the past 2 weeks alone.
Basic Attention Token is the 28th largest cryptocurrency as it holds a market cap of $336 million. Apart from Chainlink, BAT is the strongest performing cryptocurrency out of the top 30 ranked projects after rising by a total of 33% over the past month.
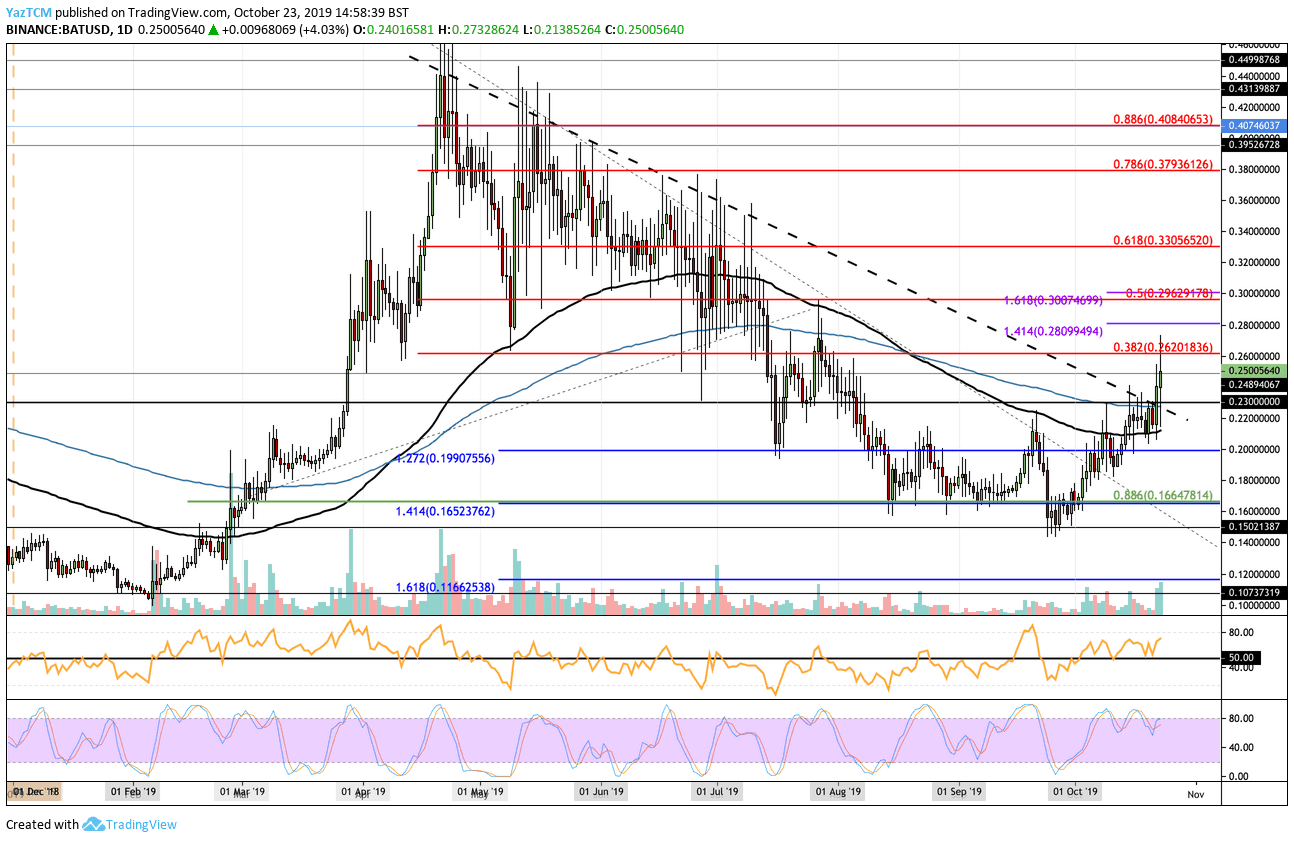
Looking at the BAT/USD 1-day chart:
- After dropping to $0.15 in September, BAT managed to surge by a total of 72% to reach its current price of $0.25. The cryptocurrency managed to climb above the 100-days EMA at $0.21 and the 200-days EMA at $0.23 to reach the current resistance.
- From above: The nearest level of resistance lies at $0.25. Above this, resistance lies at $0.2620 (bearish .382 Fibonacci Retracement), $0.28 (1.414 Fib Extension), and $0.2962 (bearish .5 Fibonacci Retracement level).
- From below: The nearest level of support lies at $0.24. Beneath this, support is at $0.23 (200-days EMA), $0.22, and $0.2130 (100-days EMA). If the selling continues, support can be found at $0.21 and $0.20.
- The trading volume has been surging over the past few days.
- The RSI has rebounded at the 50 level as the bulls manage to remain in control over the market momentum.
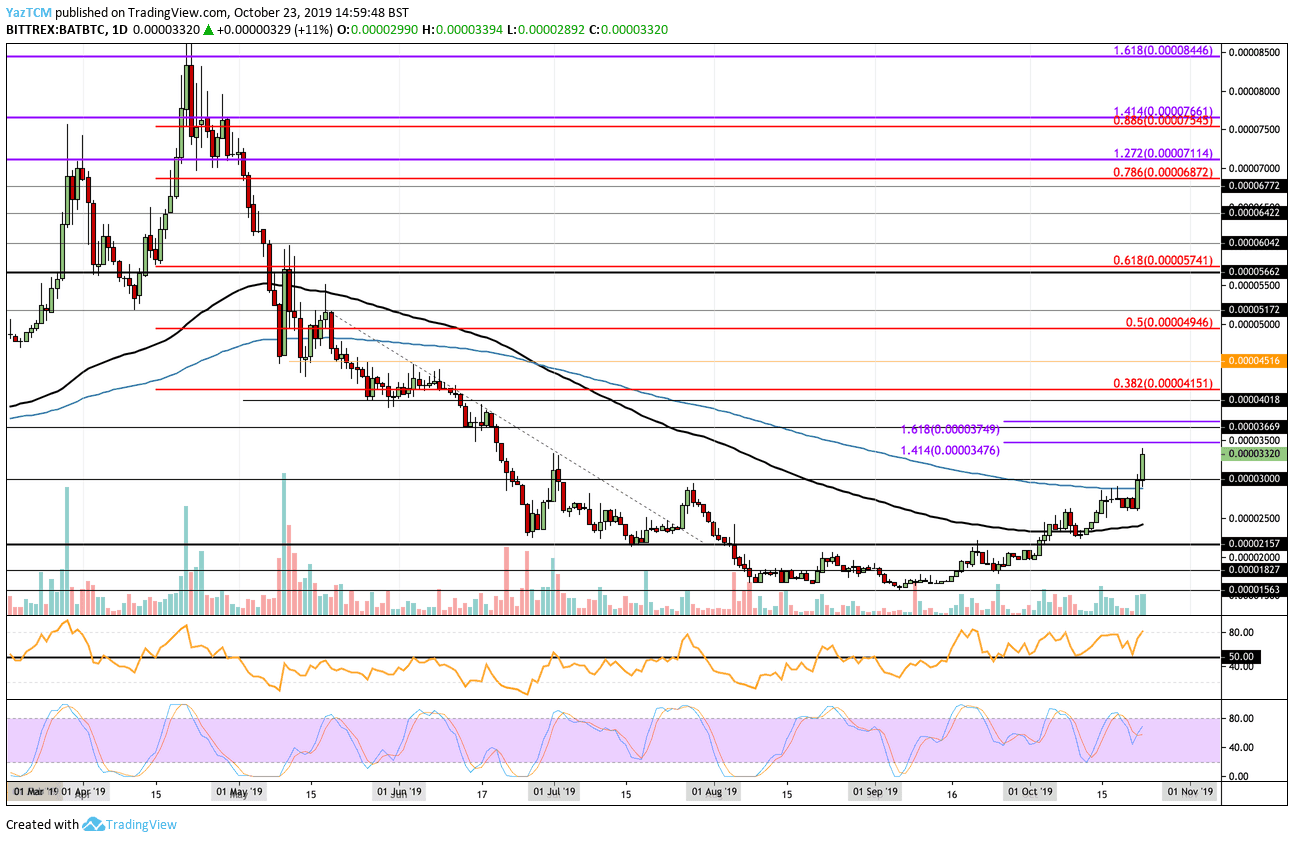
Looking at the BAT/BTC 1-day chart:
- Against BTC, BAT managed to find strong support around the 1565 SAT level during September, allowing the market to rebound higher. BAT recently climbed above the resistance at the 200-days EMA at around 2900 SAT to reach the current level at 3320 SAAT.
- From above: The nearest level of resistance lies at 3476 (1.414 Fibonacci Extension level). Above this, resistance can be found at 3749 SAT (1.619 Fib Extension), 4000 SAT, and 4151 SAT (bearish .382 Fibonacci Retracement). Higher resistance lies at 4500 SAT and 5000 SAT.
- From below: The nearest level of support lies at 3000 SAT. Beneath this, support is found at the 200-days EMA, 2500 SAT, and the 100-days EMA around 2400 SAT.
- The trading volume has been increasing during October.
- The RSI is well above the 50 level to show the bulls dominate the market momentum.
SPECIAL OFFER (Sponsored)
Binance Free $600 (CryptoPotato Exclusive): Use this link to register new account and receive $600 exclusive welcome offer on Binance (
full details).
LIMITED OFFER 2024 for CryptoPotato readers at Bybit: Use this link to register and open a $500 BTC-USDT position on Bybit Exchange for free!
Disclaimer: Information found on CryptoPotato is those of writers quoted. It does not represent the opinions of CryptoPotato on whether to buy, sell, or hold any investments. You are advised to conduct your own research before making any investment decisions. Use provided information at your own risk. See Disclaimer for more information.
Cryptocurrency charts by TradingView.