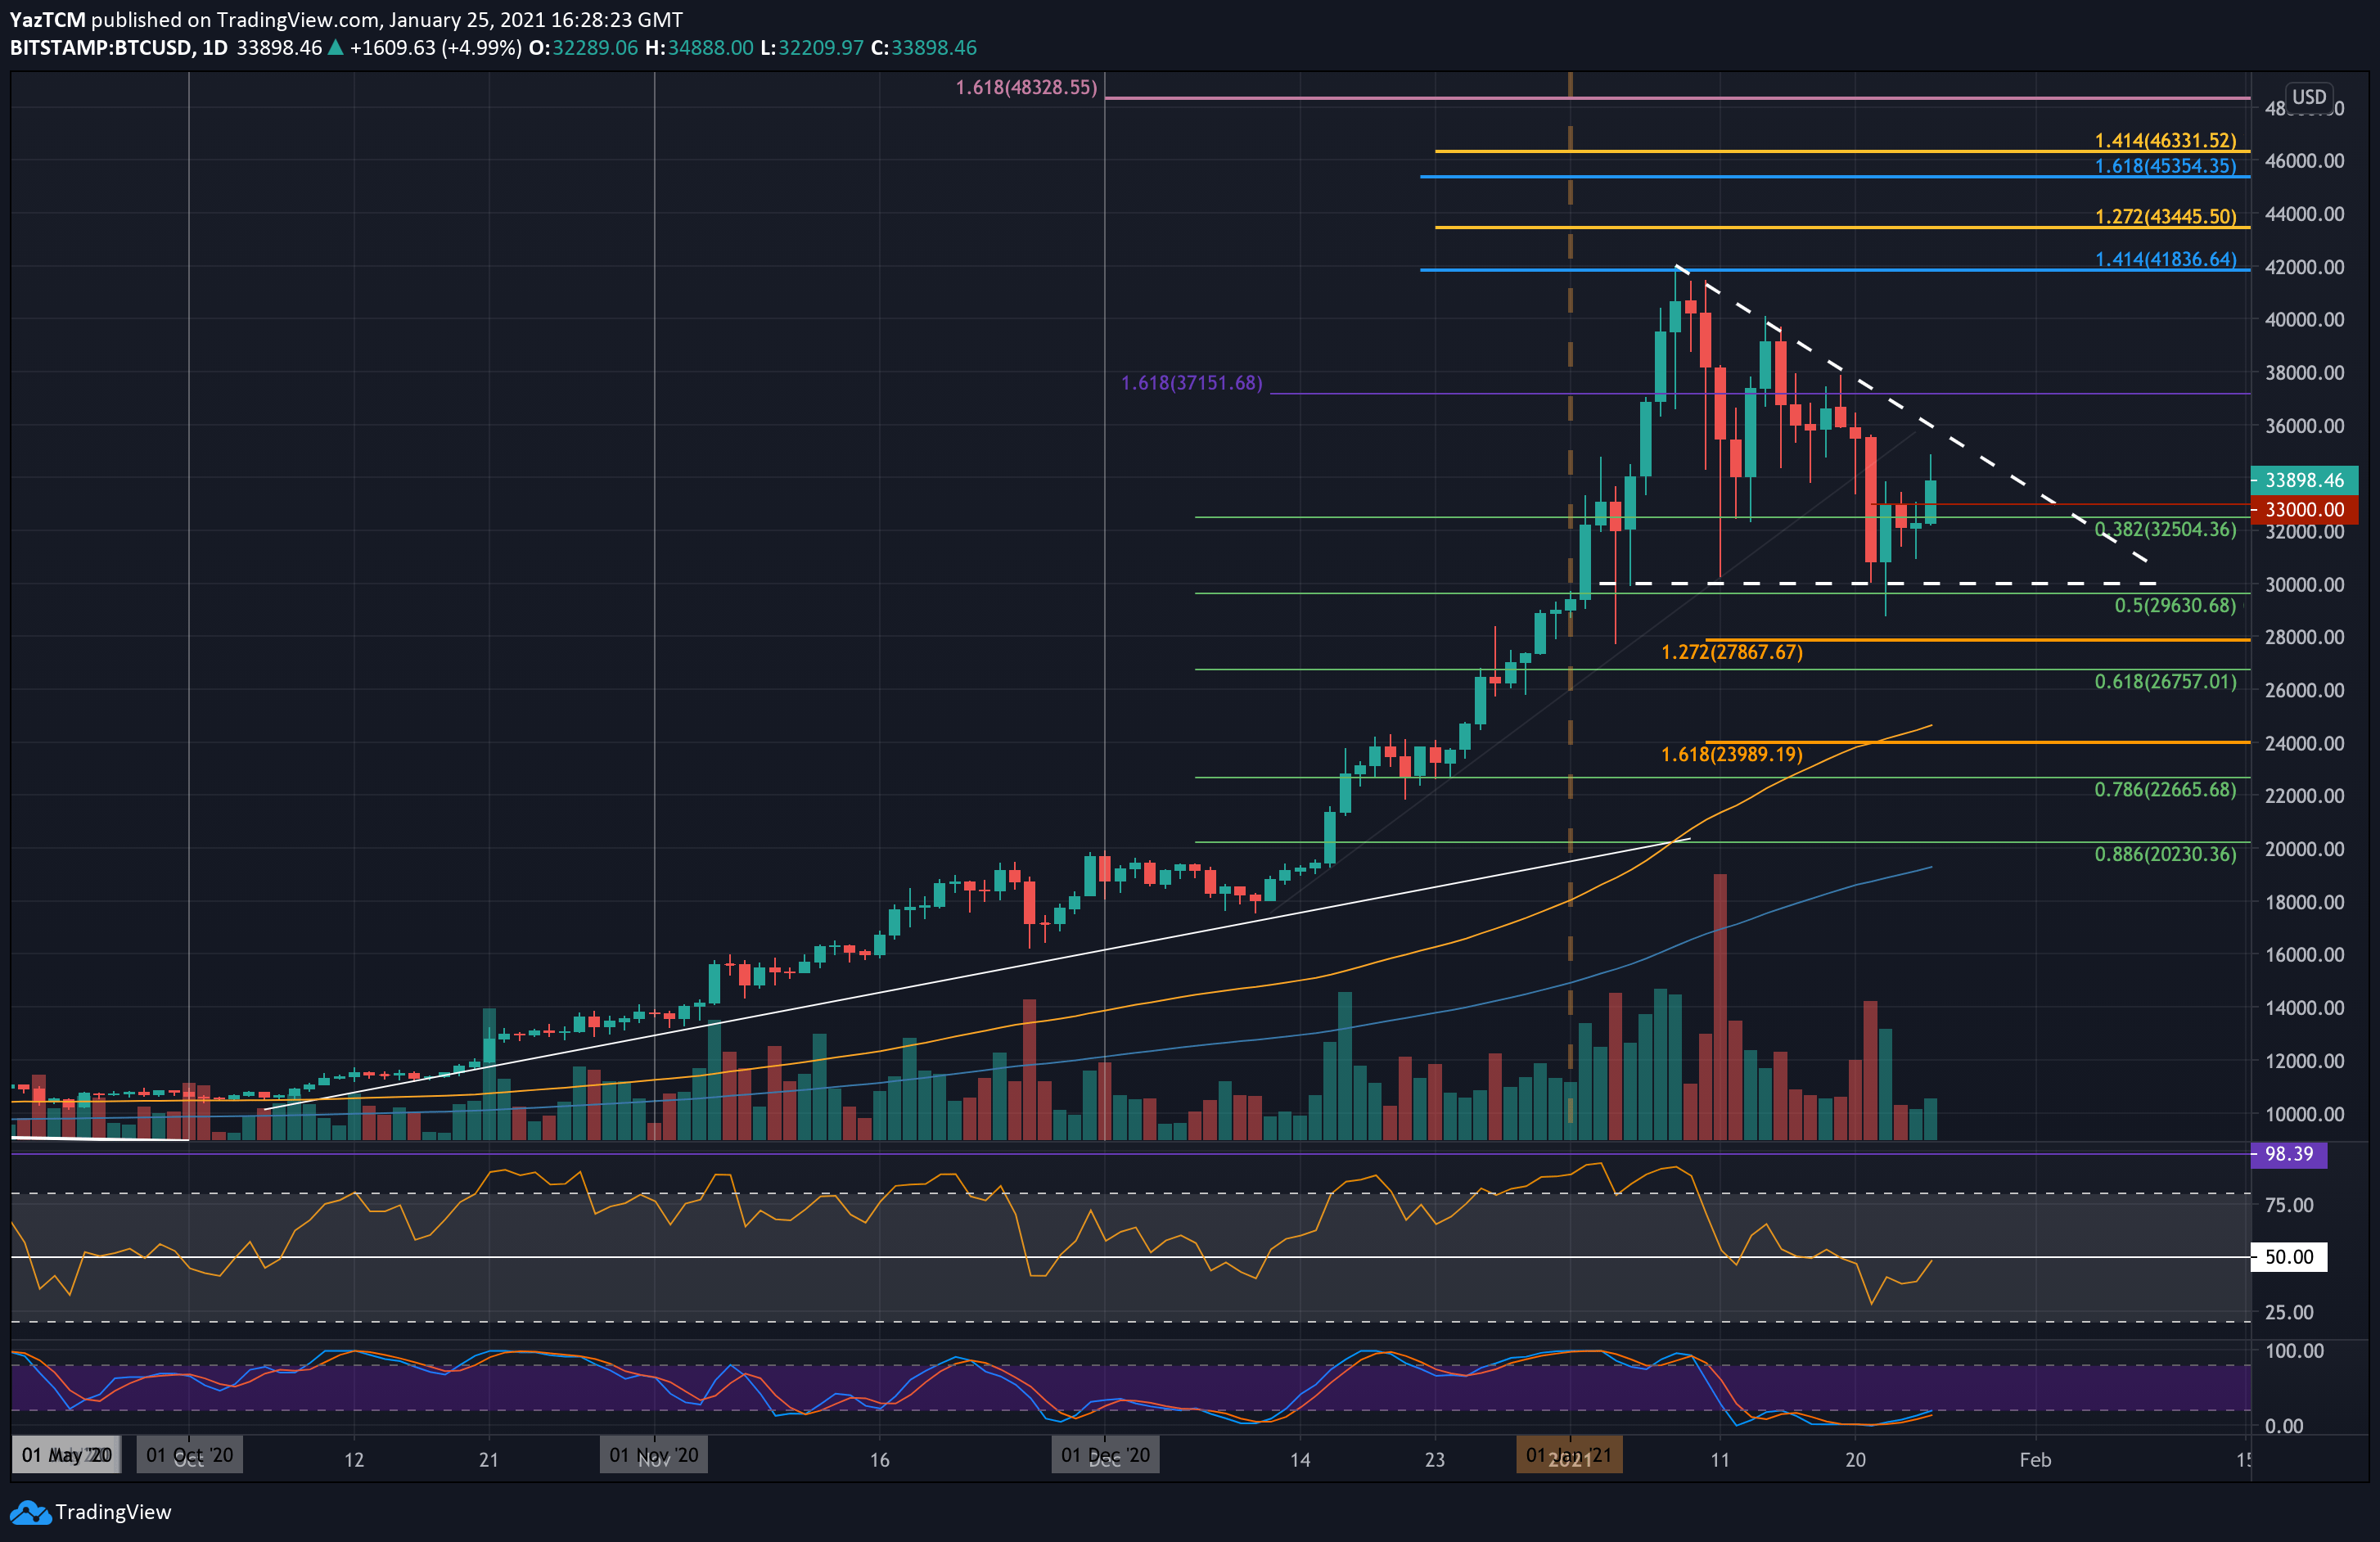
BTC/USD Daily Chart. Source: TradingView
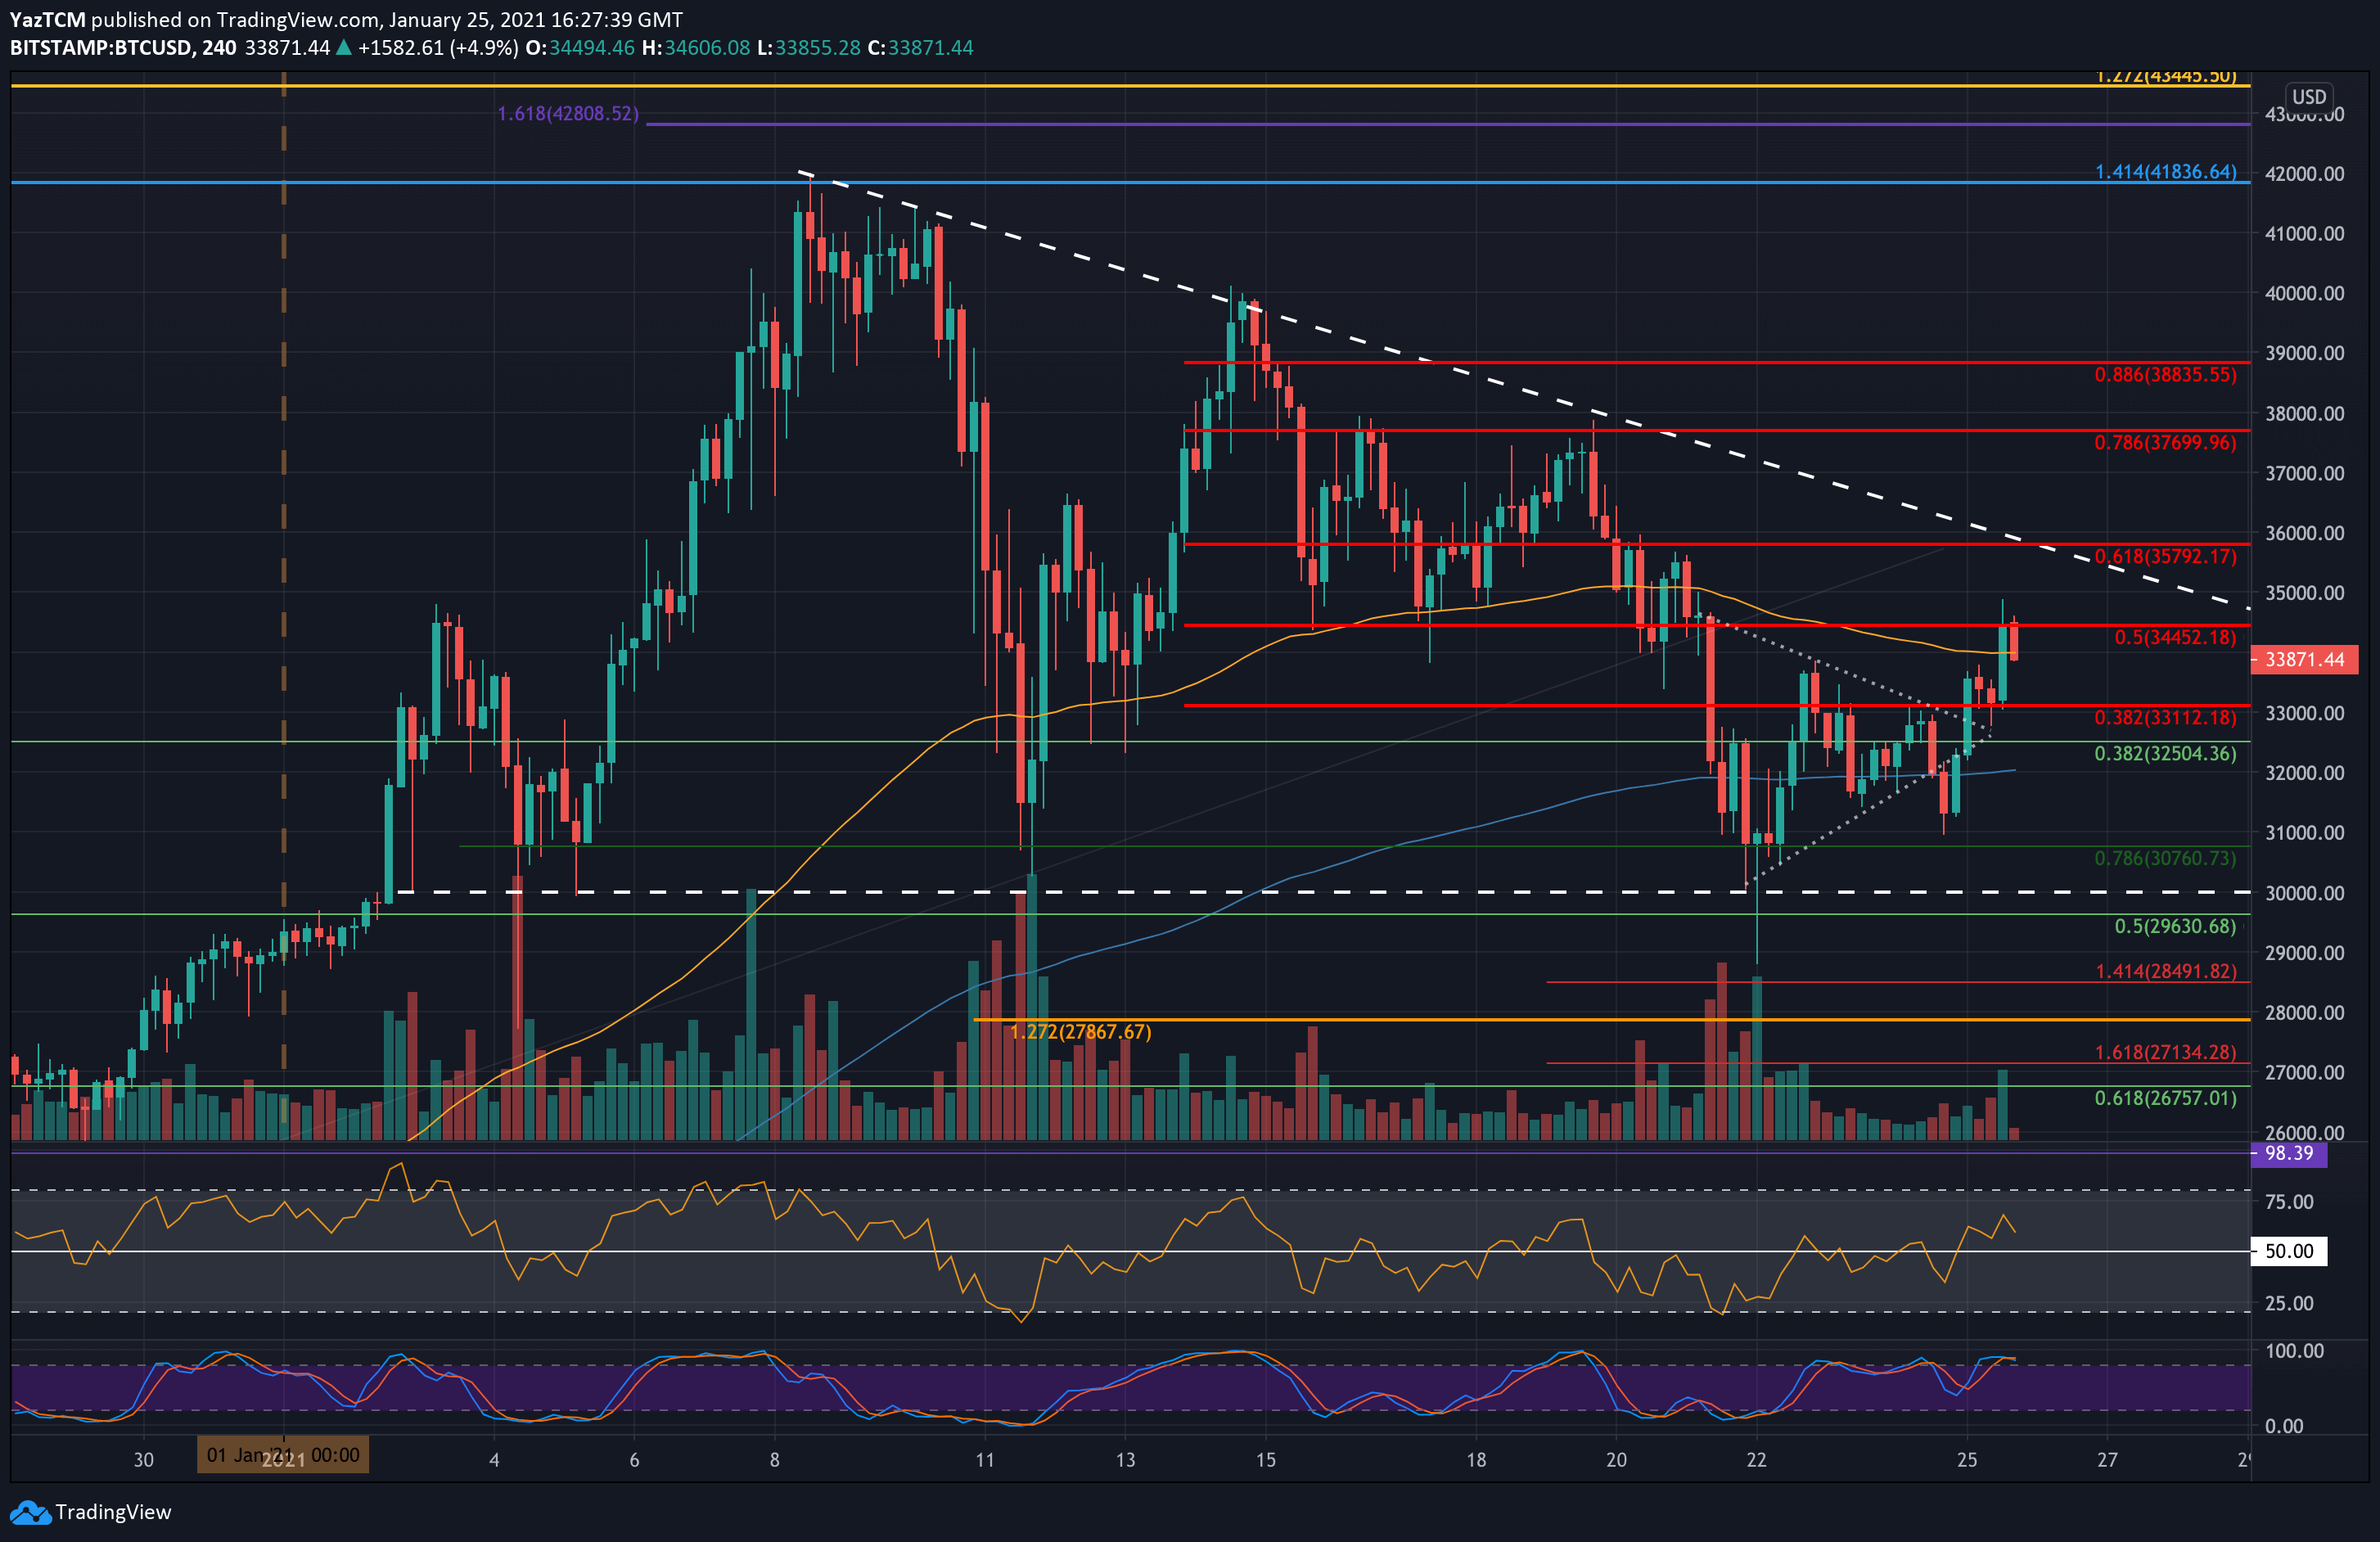
Earlier today, Bitcoin price managed to rise by over $2,000 as it bounced from $32,800 to reach a daily high of around $34,900, according to BItstamp. However, as of writing these lines, BTC failed to hold and retraced down below the crucial support turned resistance level of $34,000.
As of writing these lines, Bitcoin had failed to close the 4-hour candle above the resistance at a short term bearish .5 Fib Retracement of $34,450. As of now, it struggles to maintain the critical area of $34K.
Looking at the bigger picture, Bitcoin recovered nicely over the past 24 hours, after another retest of the $30K – $31K support area. As mentioned here yesterday, the latter is the lower angle of a bearish triangle. On the longer scale, if Bitcoin losses the crucial support around the $30K range, then we can expect a retest of lower price areas – $26K and even $24K.
From the bullish side, Bitcoin would need to break $34,450 in order to aim for the major resistance at the upper angle of the bearish triangle, as can be seen on the Daily chart below.
Key Support Levels: $33,100, $32,500, $32,000, $31,000, $30,760.
Key Resistance Levels: $34,000, $34,450, $35,00, $35,500 – $35,800, $37,900.
Looking ahead, the first level of resistance lies at $34,000, followed by $34,450 (bearish .5 Fib). Further above lies $35,000, $35,500 (the upper angle of the triangle), and $35,800 (bearish .618 Fib).
On the other side, the first level of support lies at $33,100 (yesterday’s low). This is followed by $32,500 (long term .5 Fib), $32,000, $31,000, and $30,760 (short term .786 Fib, and yesterday’s low). Further down lies support at $30,000 (base of descending triangle), $29,630 (.5 Fib), and $29,000.
The daily RSI returned to the midline, indicating indecision within the BTC market.