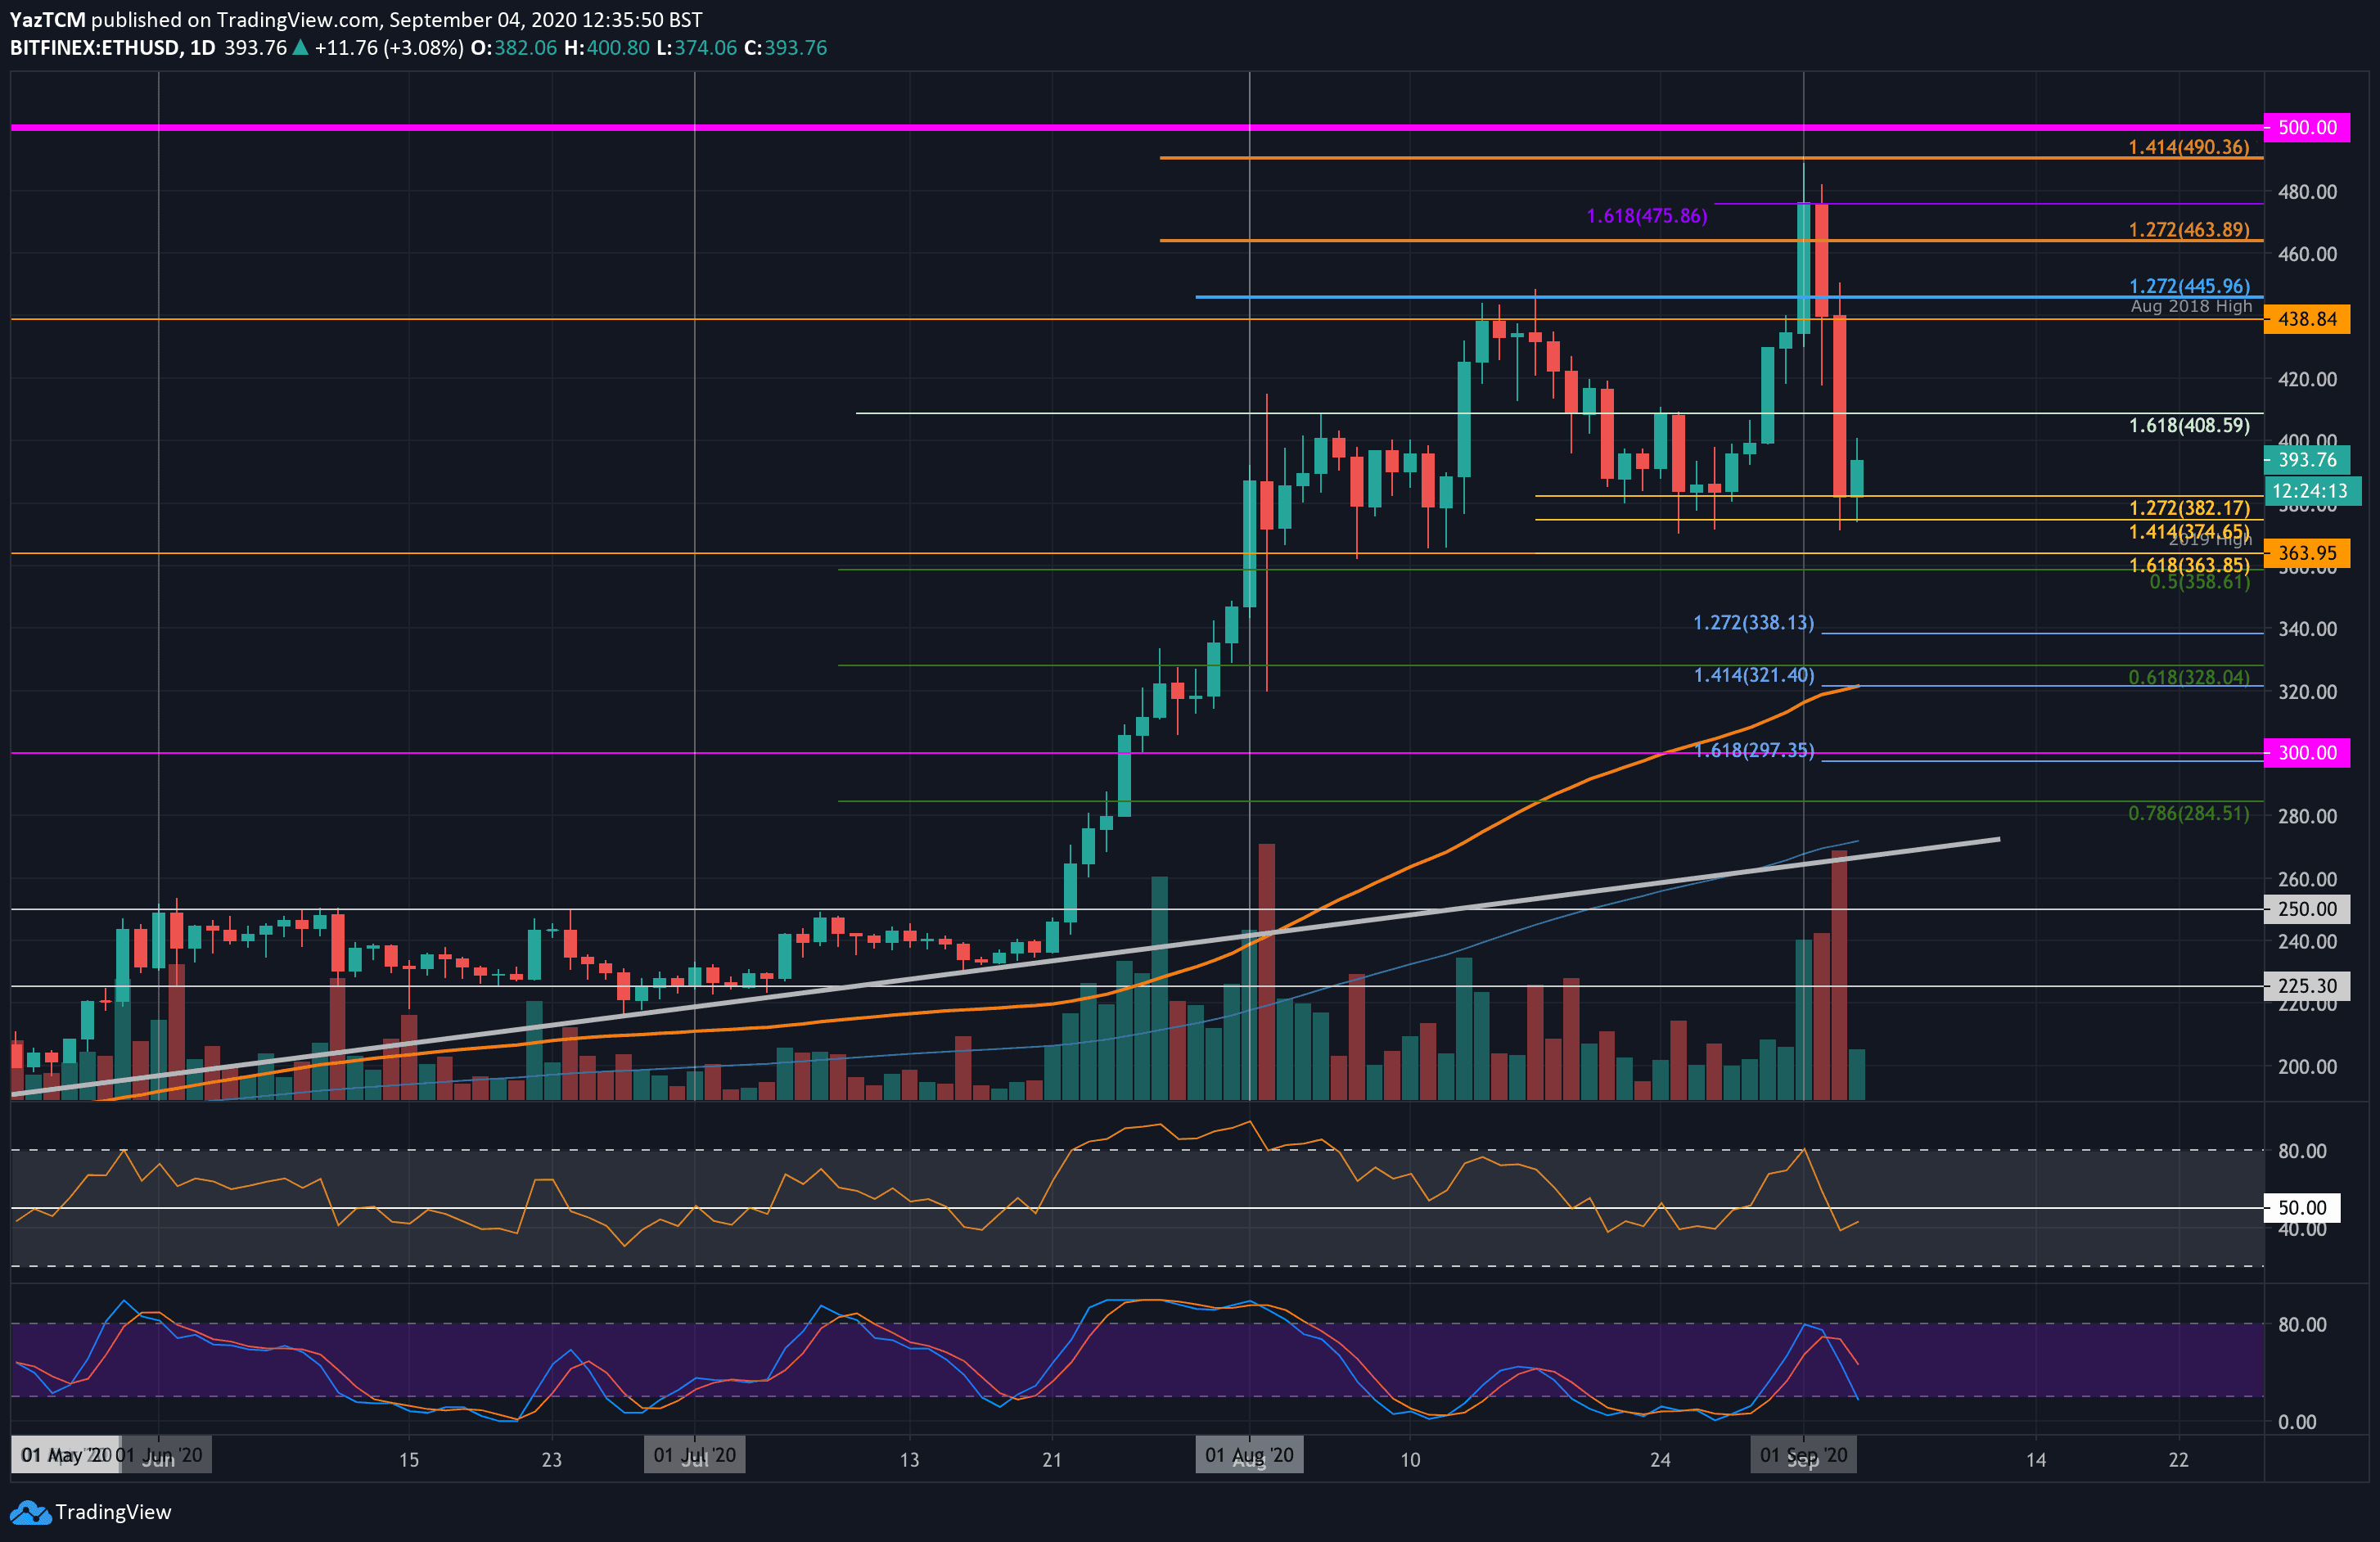
Key Support Levels: $438, $427, $400.
Key Resistance Levels: $475, $490, $500.
Ethereum started the month on a positive note as it pushed as high as $490. From there, the market has been pretty dire after dropping by a total of 19% in two days to reach the current level.
The sharp 24-hour Bitcoin drop beneath $11,000 caused the entire market to plummet – Ethereum included. Yesterday, Ethereum fell from a high of around $445 to reach as low as $374. Luckily, the bulls managed to defend the support at $382 (downside 1.272 Fib Extension) as the daily candle closed above it.
Ethereum has now bounced and is attempting to bring the price back above $400.
Looking ahead, if the buyers continue to drive higher, resistance lies at $400. Above this, $410, $420, and $440 (August 2018 Highs) will provide resistance.
On the other side, the first level of strong support is expected at $382 (downside 1.272 Fib Extension). Beneath this, support lies at $375 (downside 1.414 Fib Extension), $364 (2019 Highs), and $350.
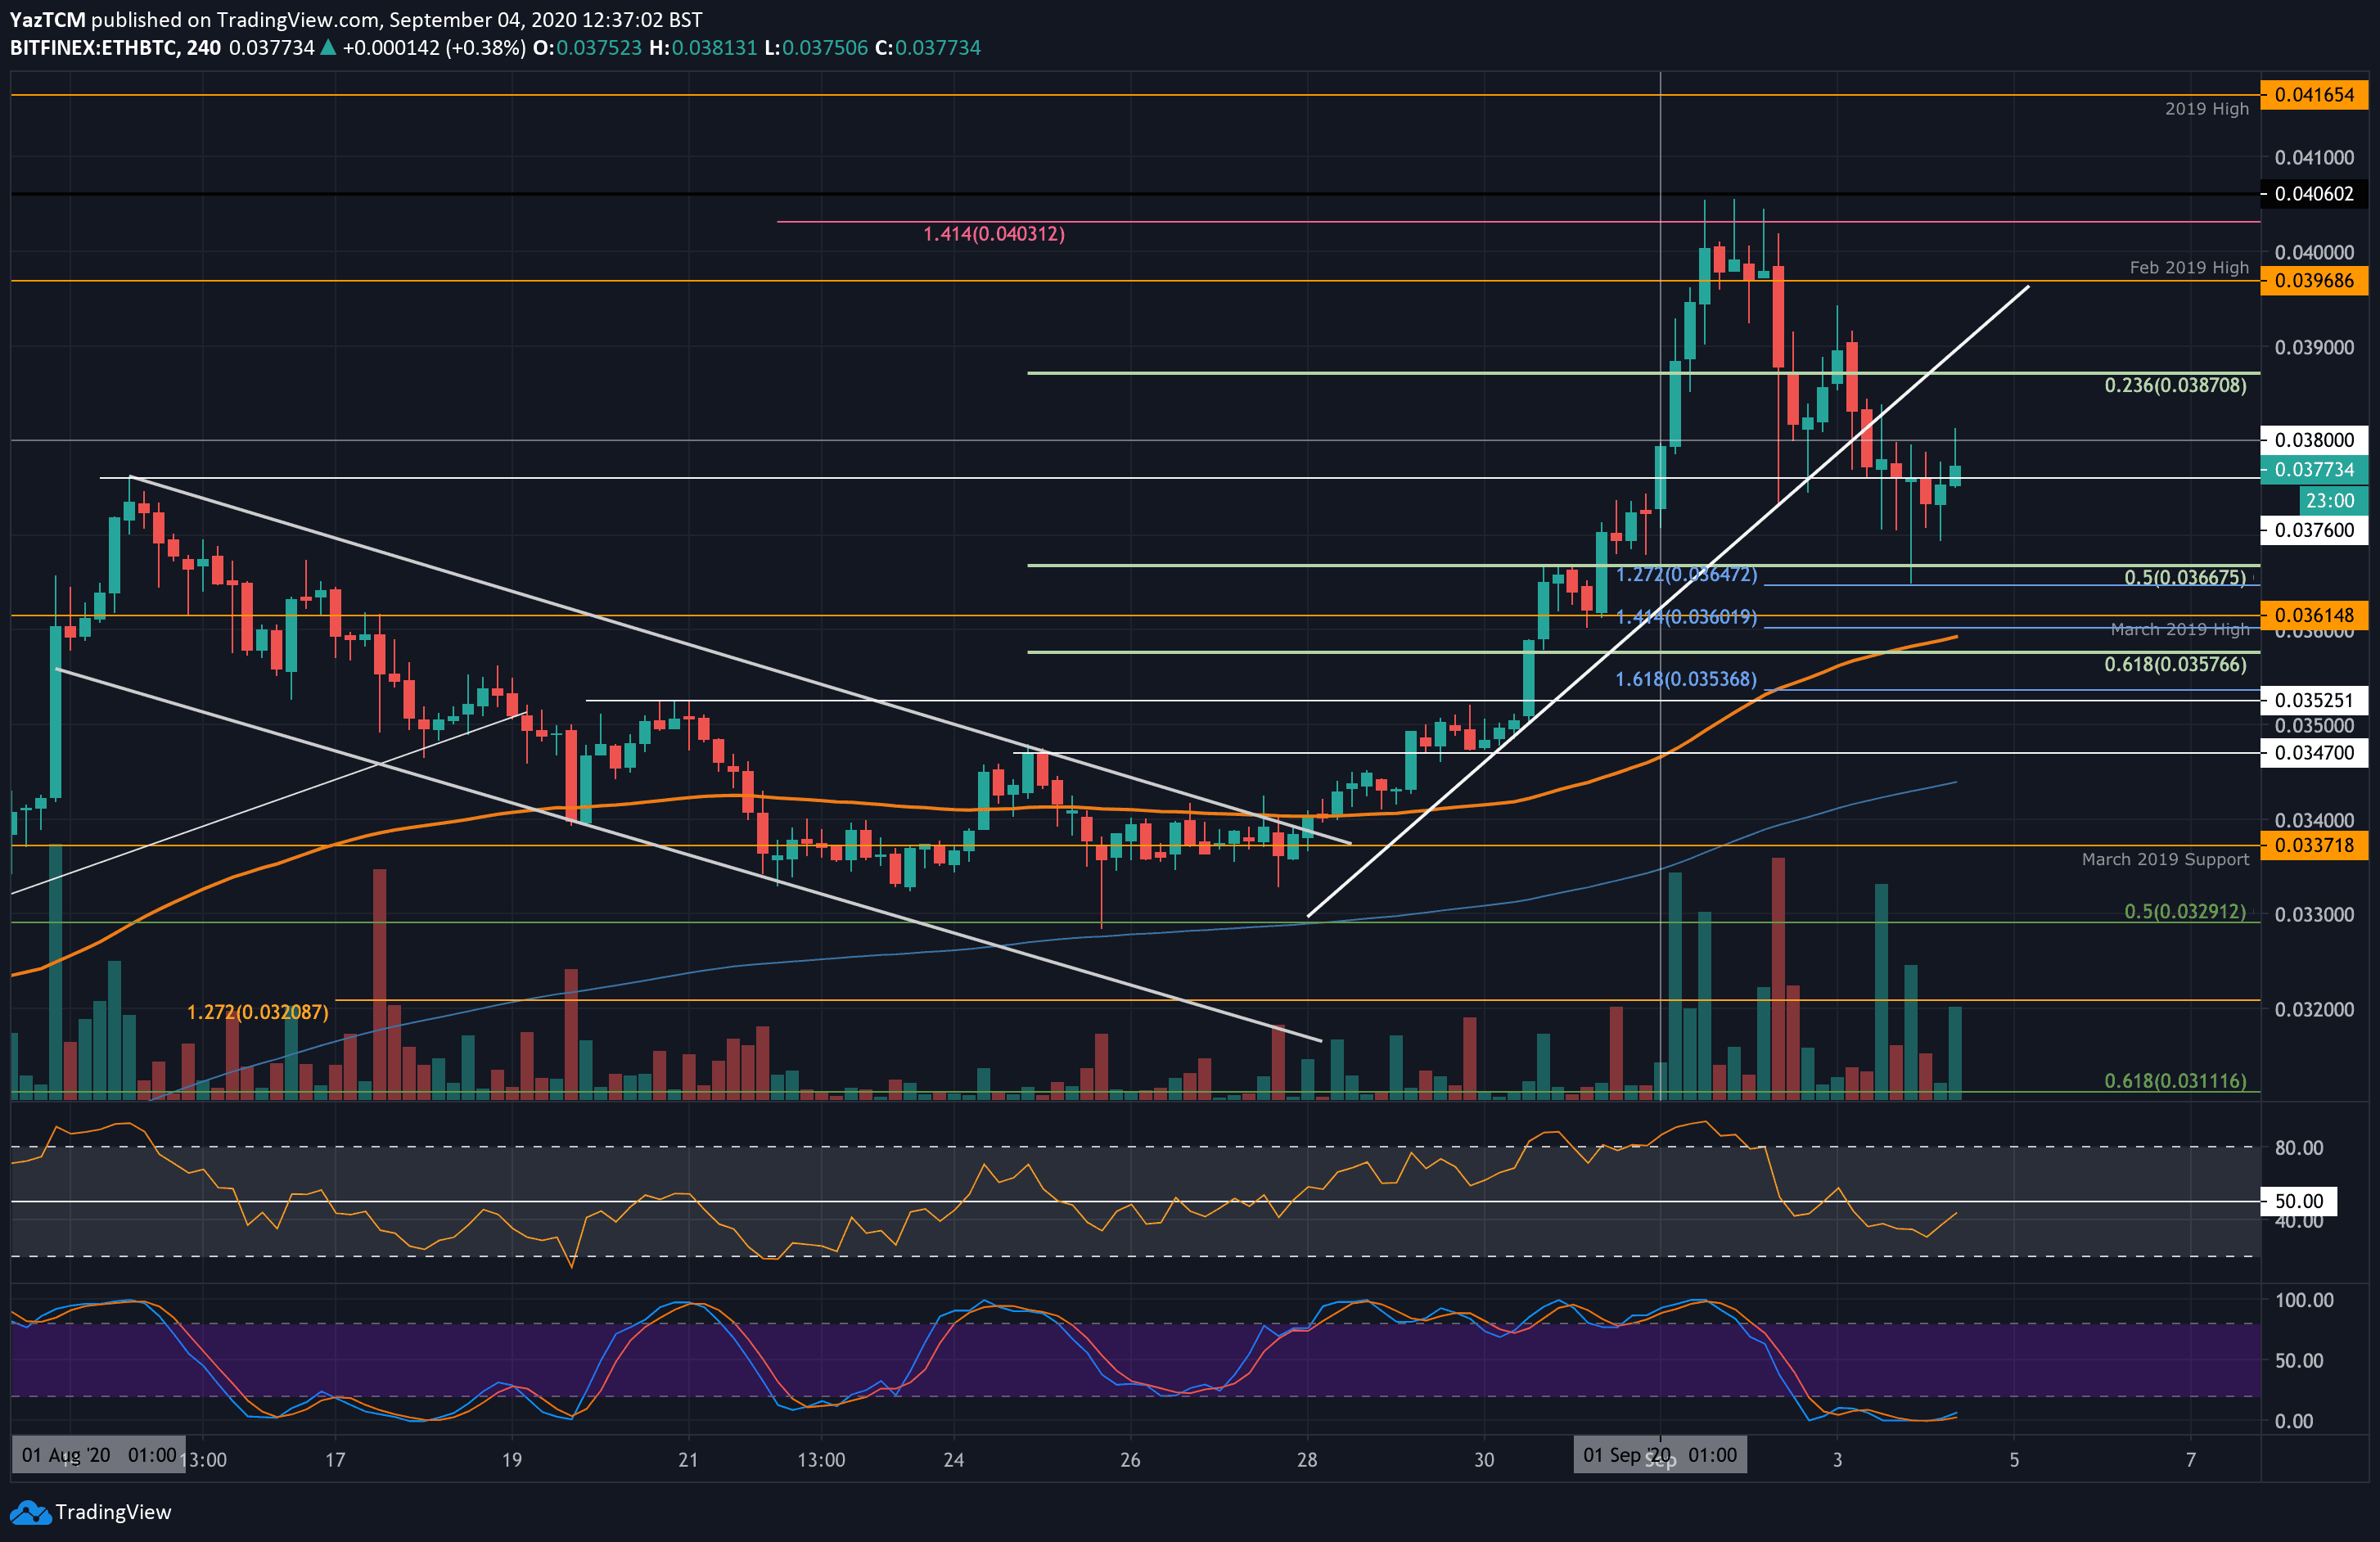
Key Support Levels: 0.0387 BTC, 0.038 BTC, 0.037 BTC.
Key Resistance Levels: 0.04 BTC, 0.0406 BTC, 0.0416 BTC.
Ethereum has also been dropping against Bitcoin during September. It started the month by spiking into the 0.04 BTC level, but it began to go downhill from there. Over the past couple of days, ETH fell beneath support at 0.0387 BTC, 0.038 BTC, and 0.0376 BTC to spike as low as 0.0364 BTC.
Luckily, the bulls did prevent ETH from closing a 4HR candle beneath the 0.037 BTC level, which has allowed it to rebound today. It spiked above 0.038 BTC level quite recently as the bulls prepare for a move higher.
Looking ahead, if the buyers can climb above the 0.038 BTC level, resistance is located at 0.0387 BTC, 0.0396 BTC (Feb 2019 High), and 0.0405 BTC. Added resistance lies at 0.041 BTC and 0.0416 BTC (2019 high).
On the other side, if the sellers push lower, the first level of support lies at 0.0376 BTC. This is followed by support at 0.037 BTC, 0.0365 BTC (.5 Fib Retracement and downside 1.272 FIb Extension), and 0.0357 BTC (.618 Fib Retracement).
On a 4HR basis, the Stochastic RSI is primed for a bullish crossover signal that could send the market higher.