Key Support Levels: $438, $427, $400.
Key Resistance Levels: $475, $490, $500.
Ethereum bounced from the support at $382 (downside 1.272 Fib Extension) toward the end of last week which allowed it to push above the previous 2020 high at $445. On the first of this month, Etheruem created a fresh 2020 high at the $490 level as it ran into the 1.414 Fib Extension resistance.
More specifically, Ethereum was never able to close a daily candle above the $476 level (1.618 Fib Extension) and headed lower from here.
In today’s plummet, ETH had dropped from $488 to as low as $420 but the buyers have quickly recovered to push it back toward $445.
Looking ahead, if the sellers push back beneath $445, support lies at $438 (Aug 2018 Highs), $427 (.236 Fib Retracement), and $400. Beneath $400, added support is found at $382 (downside 1.272 Fib Extension), $375, and $350.
On the other side, the first level of resistance to overcome lies at $475. Following this, resistance is located at $490 (1.414 FIb Extension), $500, and $528 (1.618 Fib Extension).
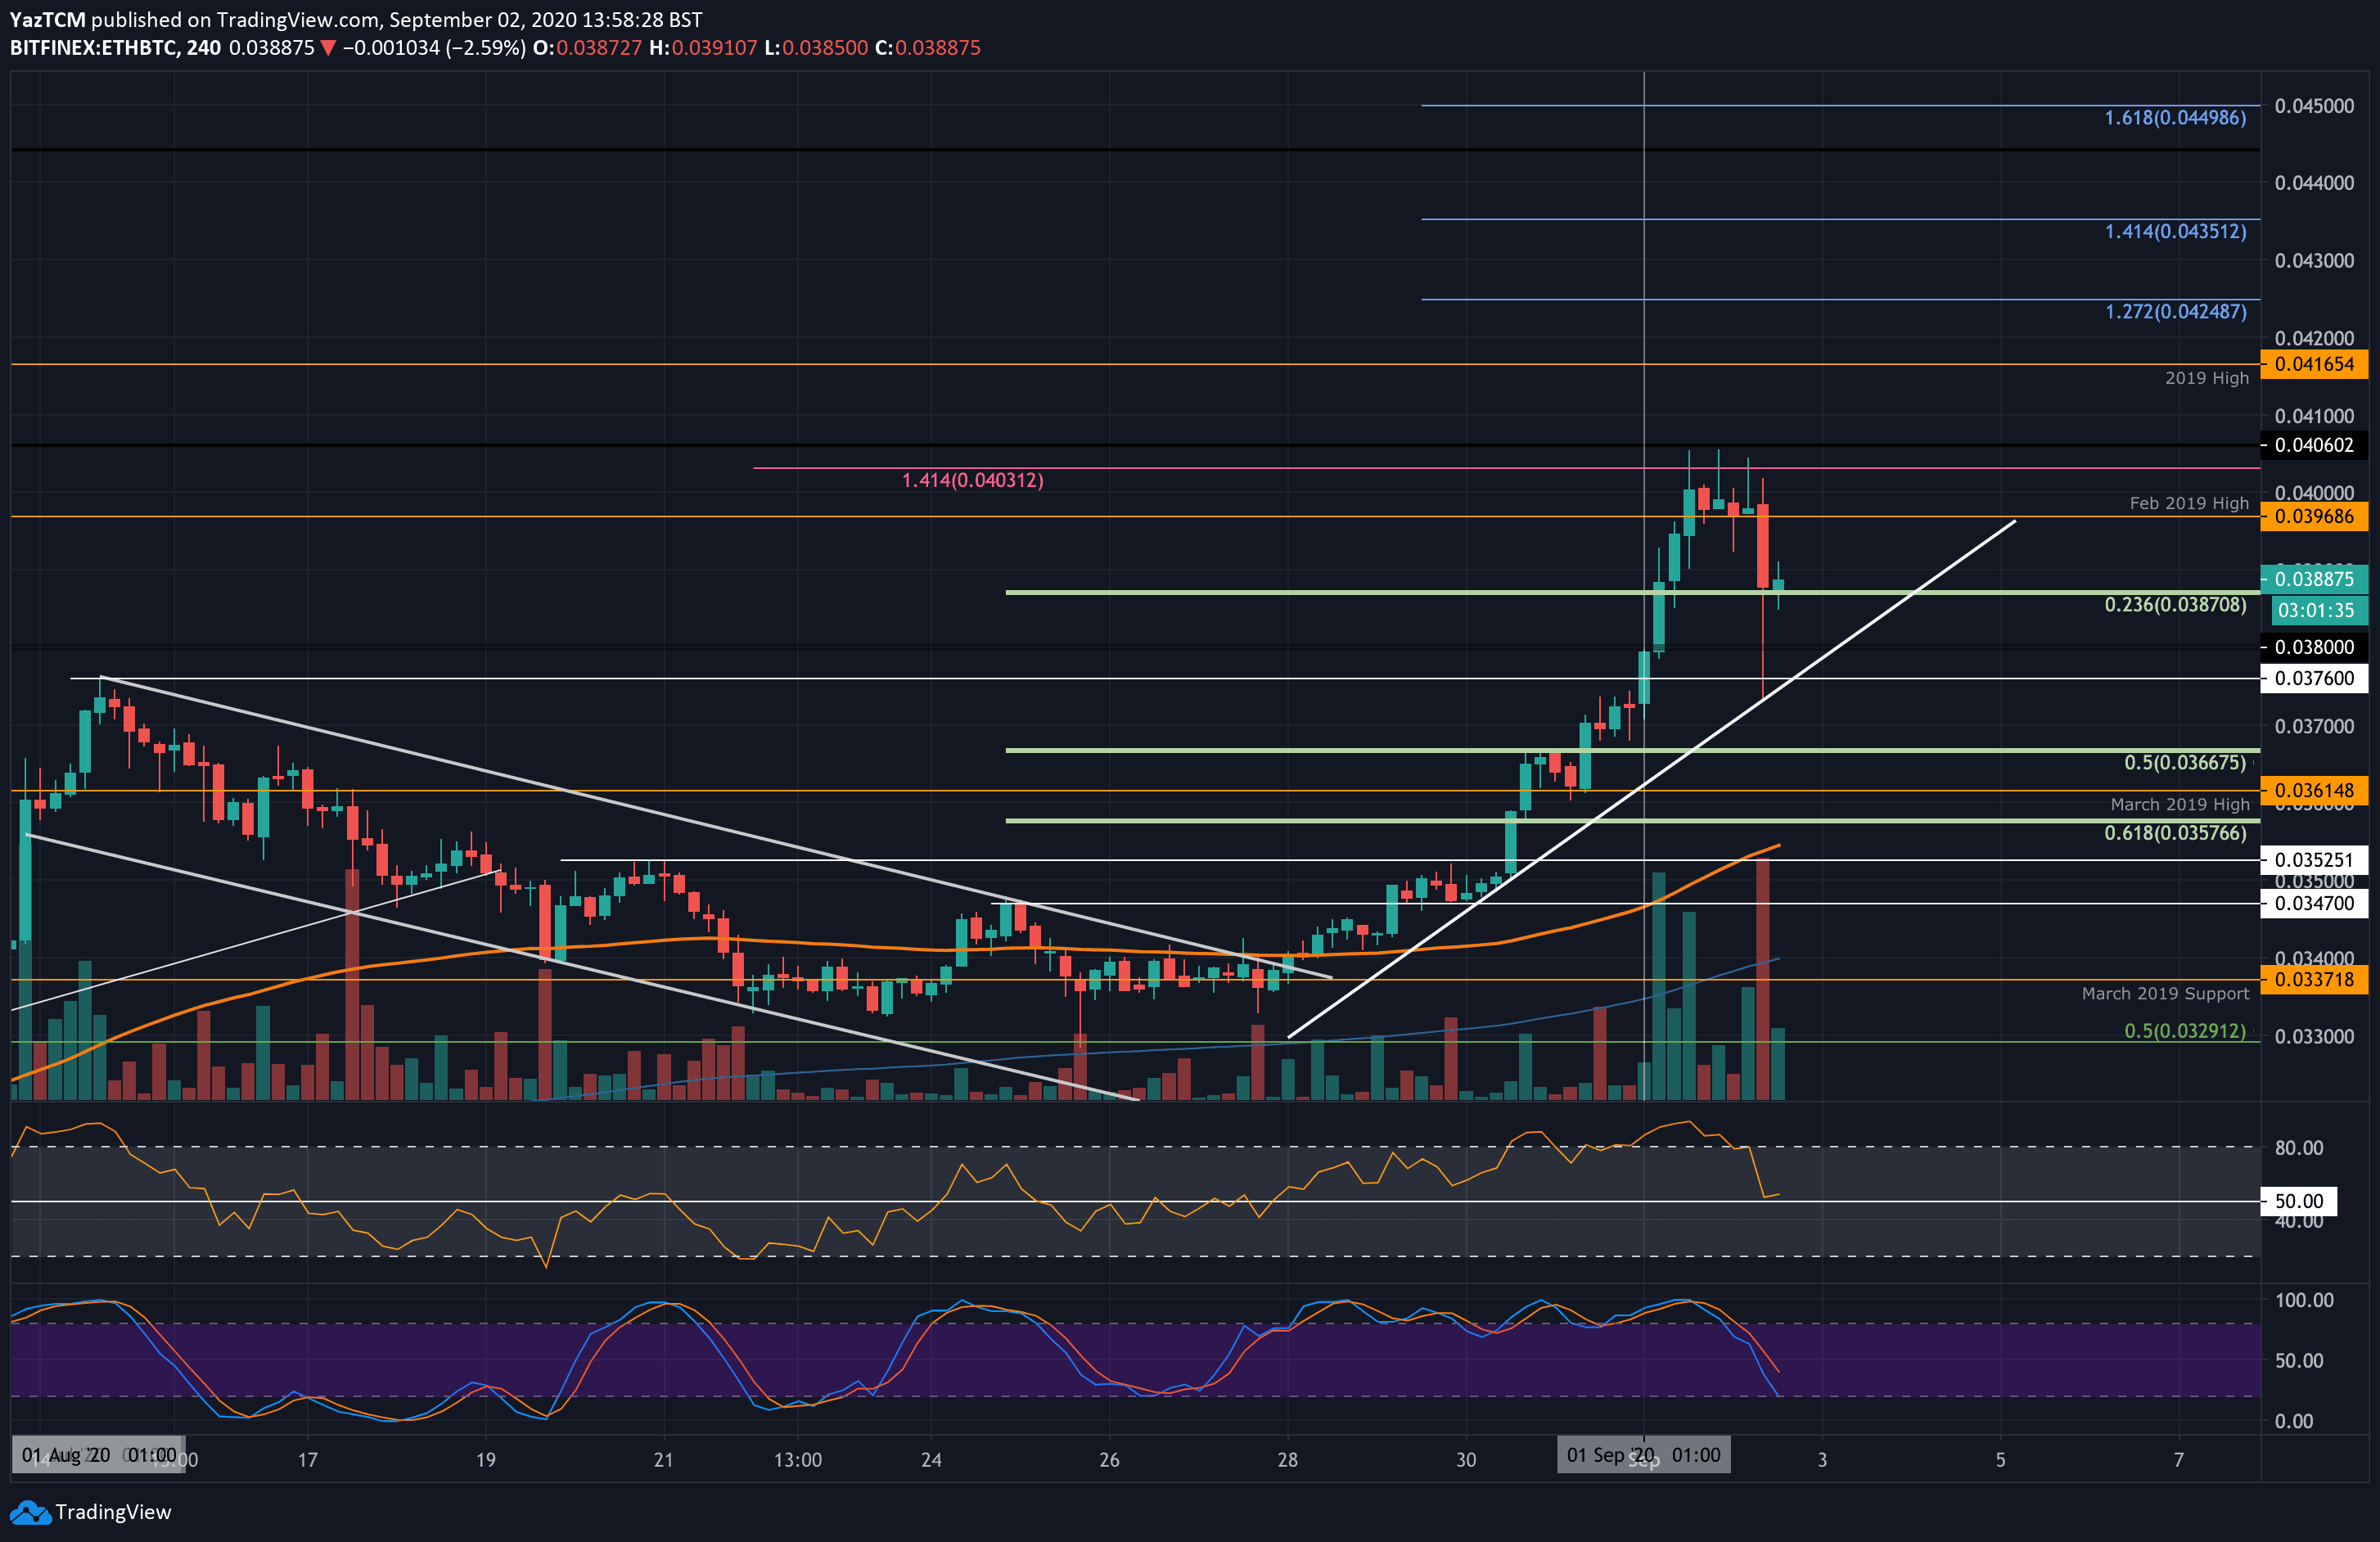
Key Support Levels: 0.0387 BTC, 0.038 BTC, 0.037 BTC.
Key Resistance Levels: 0.04 BTC, 0.0406 BTC, 0.0416 BTC.
Ethereum also created fresh 2020 highs in September as it broke above the Feb 2019 levels at 0.0396 BTC to reach 0.0406 BTC. From there, the market started to tank today as ETH spiked into the support at a rising trend line and rebounded.
After bouncing, the bulls managed to push higher to close a 4HR candle above the .236 Fib Retracement support at 0.0387 BTC. If they can keep above this level, there’s a chance to push higher.
Looking ahead, if the buyers defend 0.0387 BTC and push higher, resistance lies at 0.04 BTC (Feb 2019 High), 0.0406 BTC (2020 highs), and 0.0416 BTC (2019 Highs).
On the other side, beneath the 0.0387 BTC level, support lies at 0.038 BTC, the rising trend line, and 0.037 BTC. Additional support is found at 0.0366 BTC (.5 Fib Retracement), and 0.0361 BTC.
The 4HR RSI dropped to the mid-line to indicate indecision within the market. The direction of the next move above or below the mid-line will show which direction the market will head toward next.