CryptoPotato
CryptoPotato
  • Crypto News
  • Margin Trading
  • Guides
    • Bitcoin & Crypto Guides 101
    • Bitcoin For Beginners
    • Editorials
  • DeFi & NFT
  • Buy
  • Language
  • Crypto News
  • Bitcoin For Beginners
  • Cryptocurrency Guides 101
  • Editorials
  • Bitcoin & Crypto Margin Trading
  • DeFi & NFT News
  • Bitcoin Price Analysis
  • CryptoPotato Crypto Fund
  • Ethereum (ETH) Price Analysis
  • Ripple (XRP) Price Analysis
  • Market Updates
  • Interviews
  • Buy Bitcoin with Card
  • bitcoin
    BTC$22,619.00
  • ethereum
    ETH$1,627.26
    • Market Updates
    • BTC Analysis
    • ETH Analysis
    • XRP Analysis
    • Interviews
    • Opinions
    CryptoPotato
    CryptoPotato
    • Crypto News
    • Margin Trading
    • Guides
      • Bitcoin & Crypto Guides 101
      • Bitcoin For Beginners
      • Editorials
    • DeFi & NFT
    • Buy
    • Language
    • Crypto News
    • Bitcoin For Beginners
    • Cryptocurrency Guides 101
    • Editorials
    • Bitcoin & Crypto Margin Trading
    • DeFi & NFT News
    • Bitcoin Price Analysis
    • CryptoPotato Crypto Fund
    • Ethereum (ETH) Price Analysis
    • Ripple (XRP) Price Analysis
    • Market Updates
    • Interviews
    • Buy Bitcoin with Card
    Home » ETH » Ethereum Price Analysis: ETH Showing Strength Against BTC, Still 30% Below Feb Highs

    Ethereum Price Analysis: ETH Showing Strength Against BTC, Still 30% Below Feb Highs

    Author: Yaz Sheikh

    Last Updated Mar 16, 2021 @ 14:38

    Yesterday, Ethereum dropped by a sharp 5.2% as the cryptocurrency fell into previous resistance at $1755. It has since rebounded slightly as it trades at $1790. Against Bitcoin, ETH shows some newfound strength.

    ETH/USD – Market Falls Beneath Ascending Price Channel

    Key Support Levels: $1755, $1695, $1620.
    Key Resistance Levels: $1800, $1875, $1940.

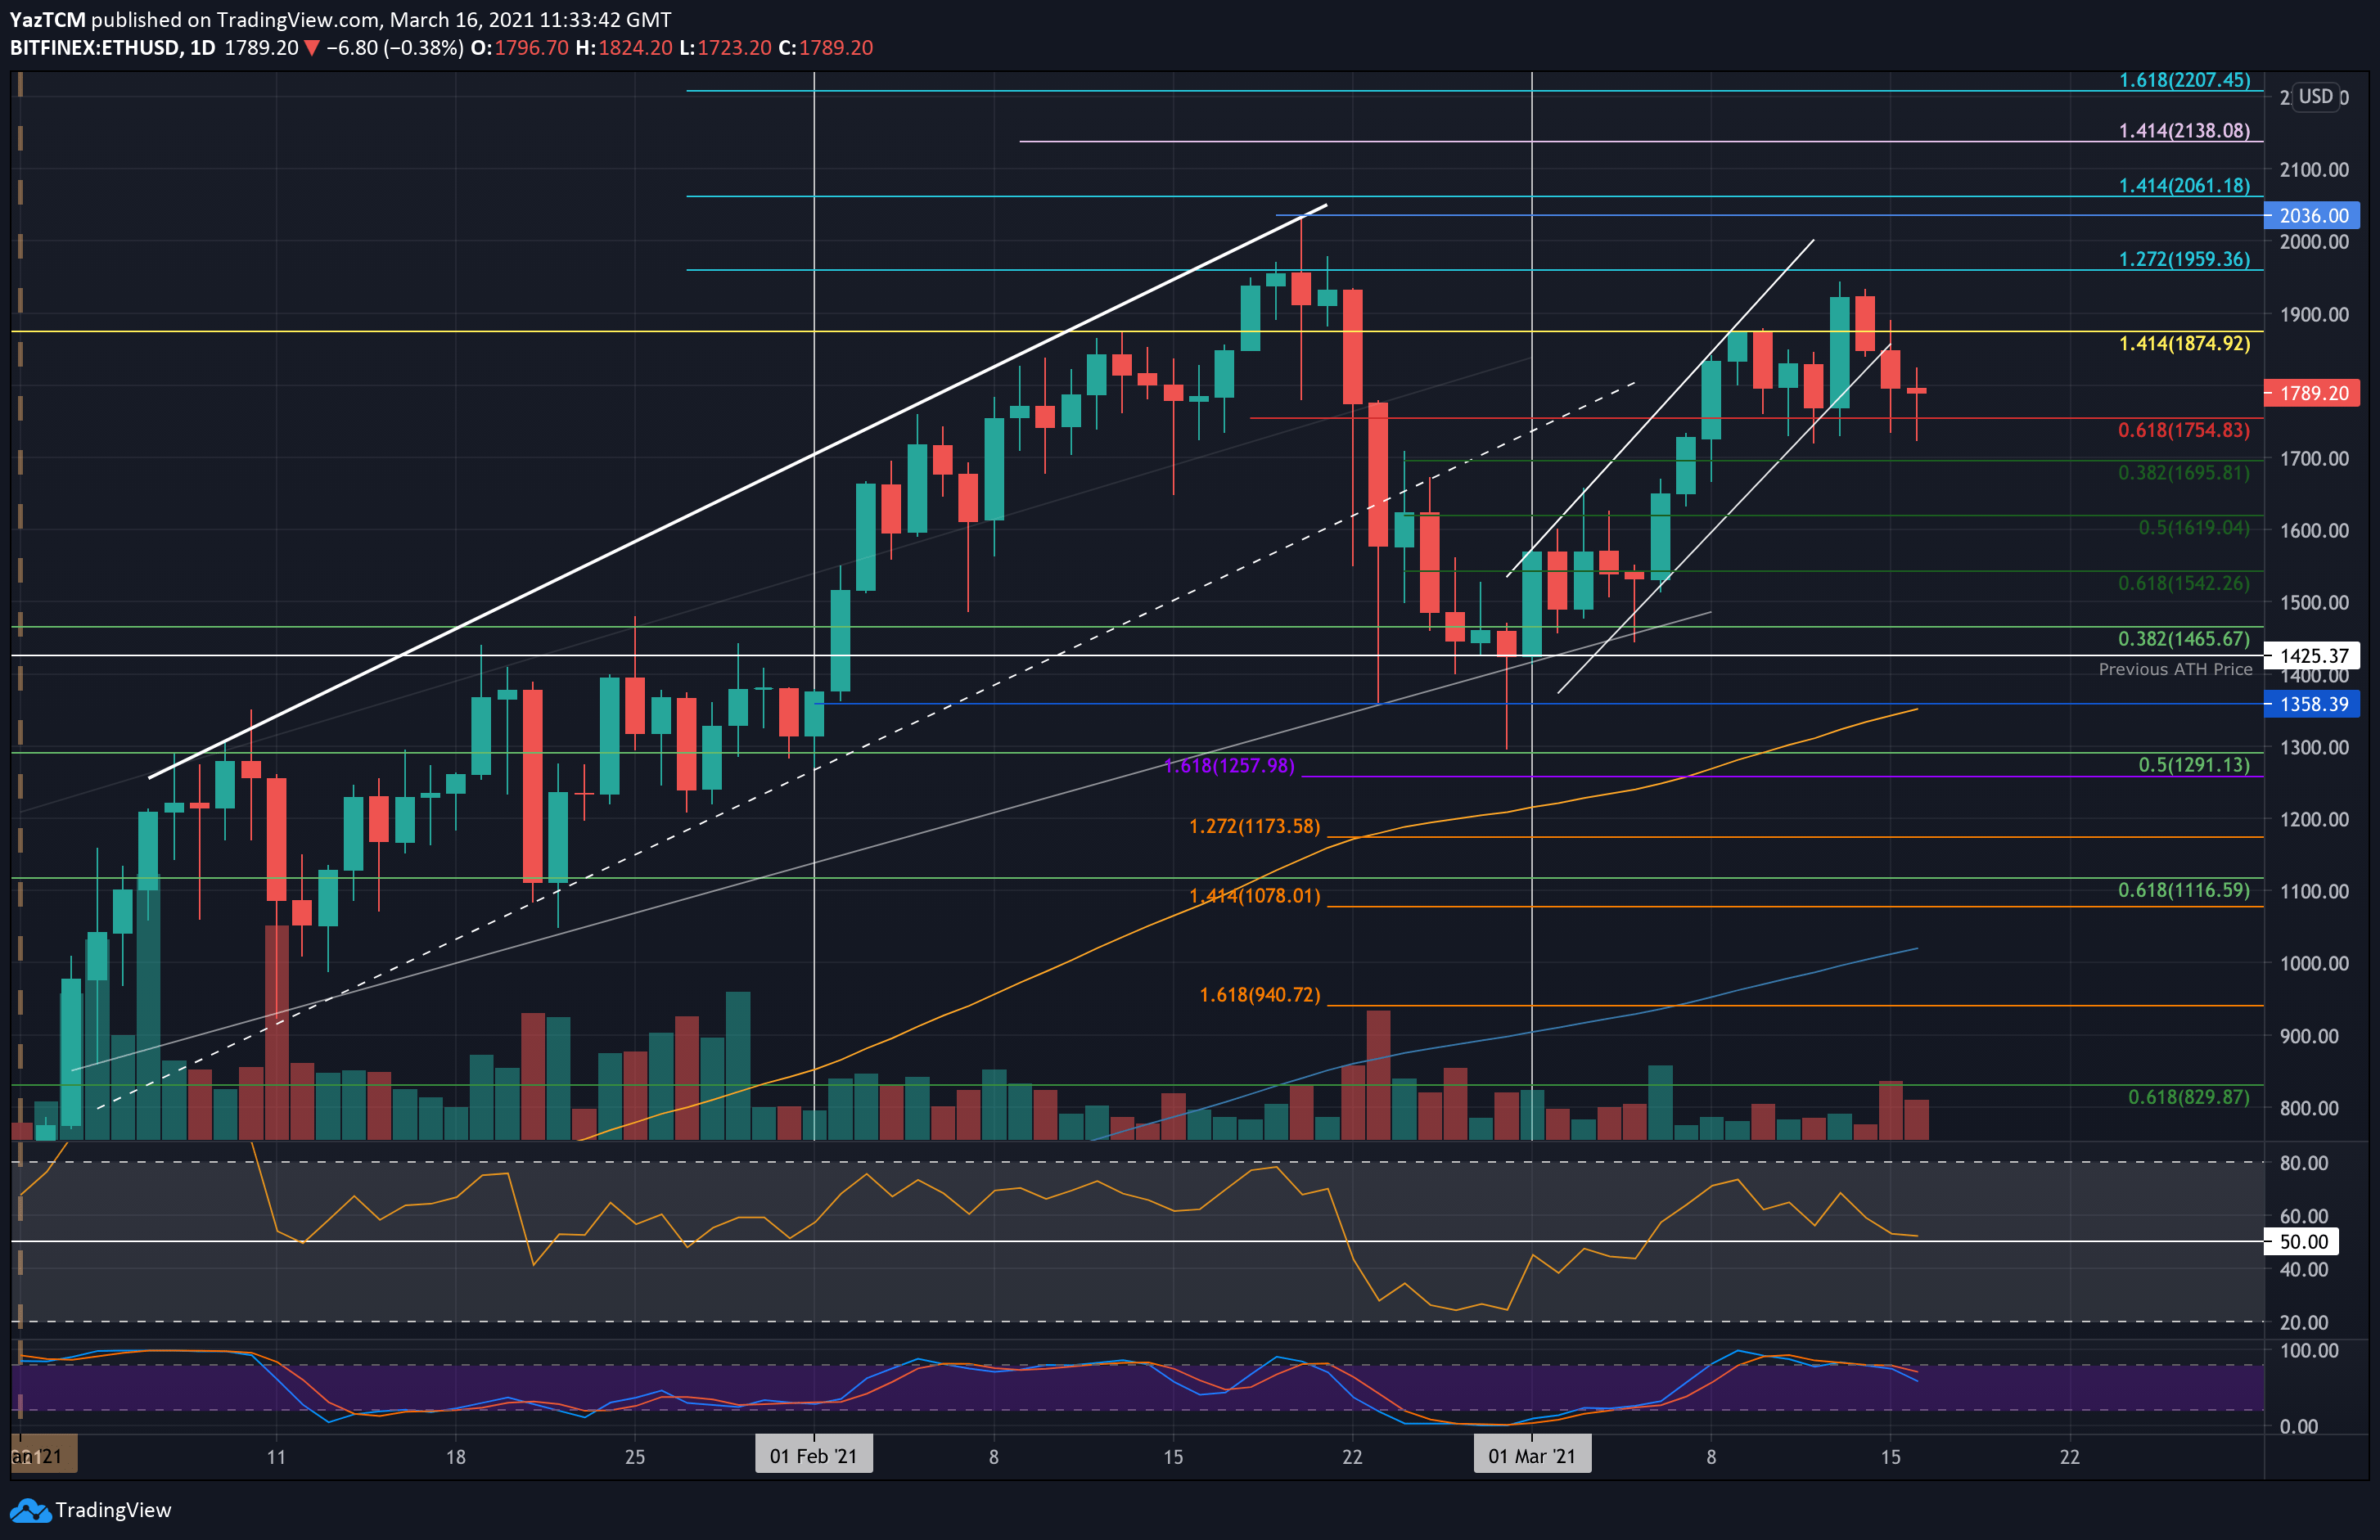
    Ethereum performed well over the weekend, clocking in a fresh March high at $1940 on Saturday. It dropped back below $1900 on Sunday and continued to break beneath the March ascending price channel yesterday with the 5.2% price fall.

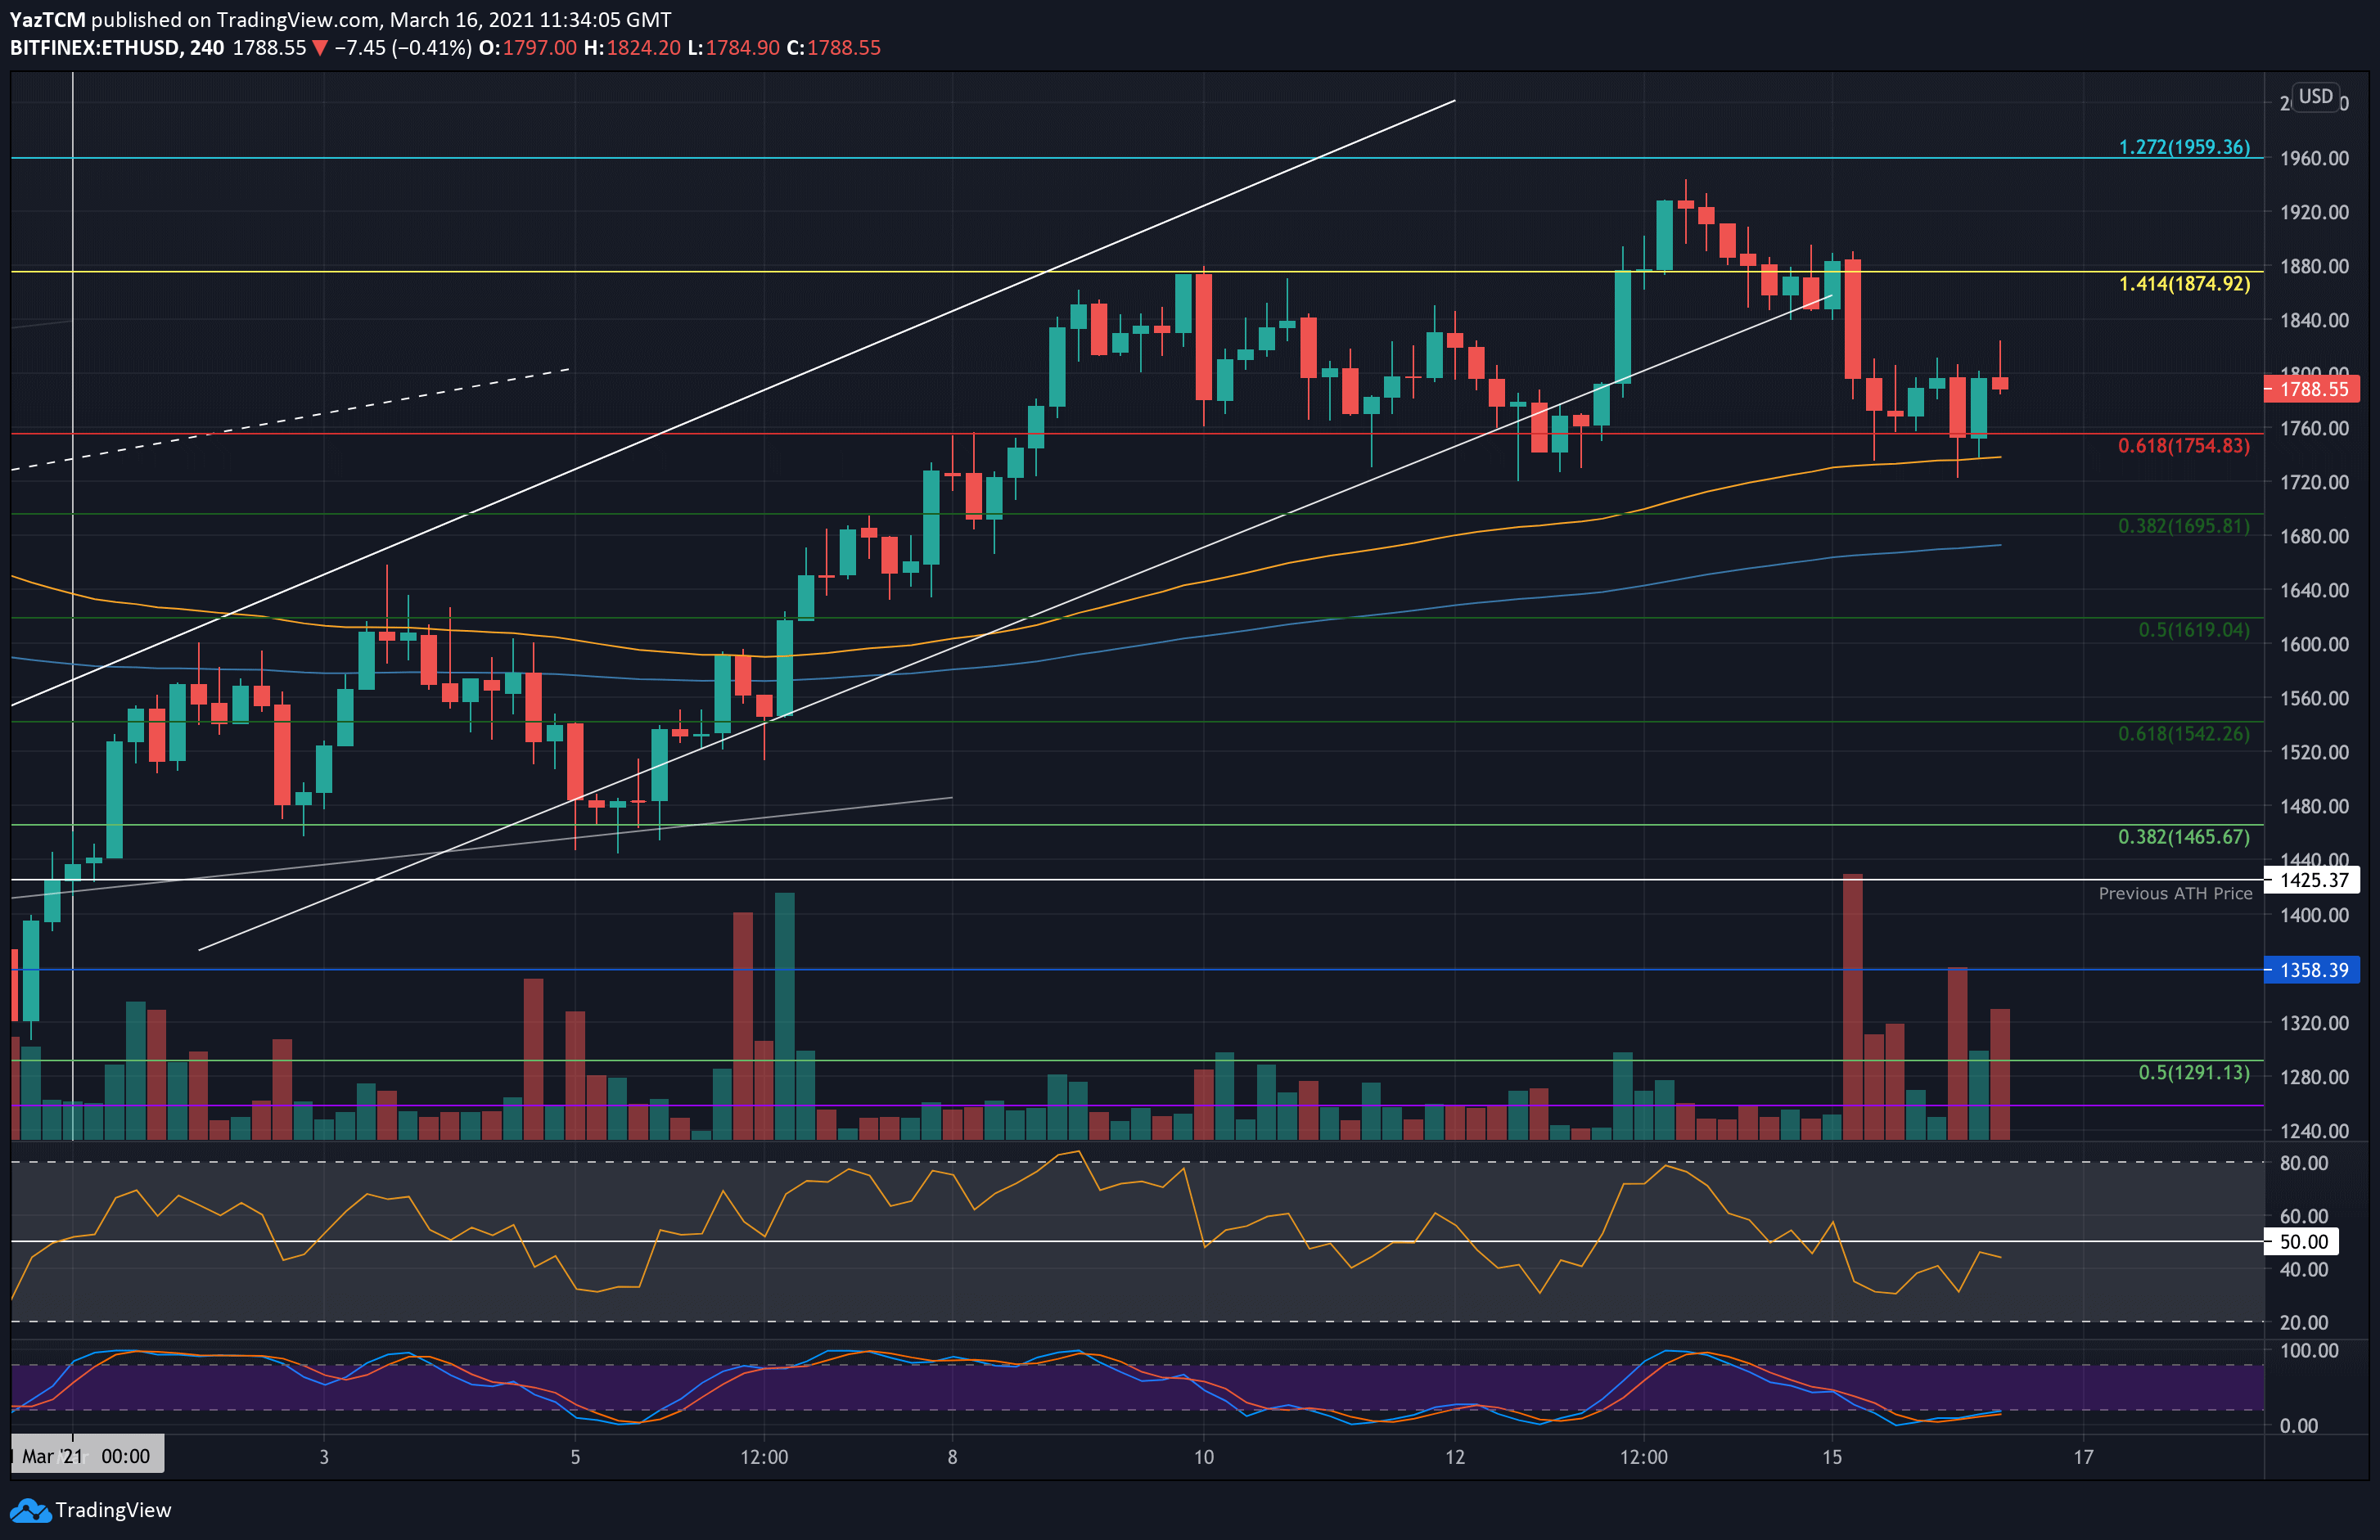
    The price drop caused ETH to head back into previous resistance at $1755, which had provided support for the market throughout last week. This level is best seen on the 4-hour charts. It has since rebounded from there and is trading around $1790.

    ethusd-mar16
    ETH/USD Daily Chart. Source: TradingView
    ethusd-4hr-mar16
    ETH/USD 4-Hour Chart. Source: TradingView

    ETH-USD Short Term Price Prediction

    Looking ahead, the first level of support lies at $1755. This is followed by $1695 (.382 Fib), $1620 (.5 Fib), and $1540 (.618 Fib).

    On the other side, the first resistance is expected at $1800. This is followed by $1875 (1.414 Fib Extension), $1940 (March 2021 highs), and $1960 (1.272 Fib Extension & All-time high-day opening price).

    The RSI has plummeted into the midline, indicating indecision within the market. If it drops beneath 50, the bearish momentum will increase and is likely to drive ETH beneath last week’s support.

    ETH/BTC – Bulls Break Above 200-days EMA.

    Key Support Levels: 0.0318 BTC, 0.031 BTC, 0.0305 BTC.
    Key Resistance Levels: 0.0337 BTC, 0.035 BTC, 0.0361 BTC.

    Ethereum has been struggling against Bitcoin since early-Feb when it dropped from 0.046 BTC to reach as low as 0.03 BTC by the end of the month. In the first week of March, ETH rebounded but could not overcome the resistance at 0.035 BTC last week.

    It rolled over from there during the week to find support at 0.0305 BTC (.886 Fib) over the weekend. It has since rebounded from 0.0305 BTC and recently broke back above the 200-day EMA at 0.0323 BTC.

    ethbtc-mar16
    ETH/BTC Daily Chart. Source: TradingView

    ETH-BTC Short Term Price Prediction

    Looking ahead, the first level of resistance above 0.0323 BTC (200-days EMA) lies at 0.0337 BTC (November 2020 Highs & 100-days EMA). This is followed by 0.035 BTC, 0.0361 BTC (March 2019 Highs), and 0.038 (bearish .5 Fib).

    On the other side, the first support is located at 0.0318 BTC (December 2020 highs). This is followed by 0.031 BTC (.786 Fib), 0.0305 BTC (.886 Fib), and 0.03 BTC.

    The RSI is now back at the midline, indicating indecision within the market. For the price to continue above the 200-day EMA, the RSI must push higher to indicate bullish momentum.

    SPECIAL OFFER (Sponsored)
    Binance Free $100 (Exclusive): Use this link to register and receive $100 free and 10% off fees on Binance Futures first month (terms).

    PrimeXBT Special Offer: Use this link to register & enter POTATO50 code to receive up to $7,000 on your deposits.


    Disclaimer: Information found on CryptoPotato is those of writers quoted. It does not represent the opinions of CryptoPotato on whether to buy, sell, or hold any investments. You are advised to conduct your own research before making any investment decisions. Use provided information at your own risk. See Disclaimer for more information.

    Cryptocurrency charts by TradingView.
    Tags: Ethereum (ETH) Price
    Enjoy reading? Share with your friends
    Facebook Twitter LinkedIn Telegram

    About The Author

    Yaz Sheikh
    More posts by this author

    Yaz is a cryptocurrency technical analyst with over seven years of technical analysis trading experience. As an Economics graduate, he has taken a keen interest in the future potentials of blockchain in the financial industry. Removing crypto from the equation, Yaz loves to watch his favorite football team and keep up-to-date with the latest fights within the UFC.

  • bitcoin
    BTC$22,619.00
  • ethereum
    ETH$1,627.26
  • Join Our Community

    FacebookTwitter YouTubeTelegram


    Editorials
    What is Optimism (OP): Guide to One of Ethereum’s Layer-Two Scaling Solutions

    What is Optimism (OP): Guide to One of Ethereum’s Layer-Two Scaling Solutions

    Why ZK-Rollups Are the Future of Ethereum Scaling: Interview with StarkWare PM Gal Ron

    Why ZK-Rollups Are the Future of Ethereum Scaling: Interview with StarkWare PM Gal Ron

    2022 Was Crypto’s Dot Com Bust: Let’s Recap Tech Stocks After 2000 (Opinion)

    2022 Was Crypto’s Dot Com Bust: Let’s Recap Tech Stocks After 2000 (Opinion)

    How Long Will the Ethereum LSD Narrative Last? Talking 2023 Trends with Nansen’s Martin Lee

    How Long Will the Ethereum LSD Narrative Last? Talking 2023 Trends with Nansen’s Martin Lee

    Everything That’s Going on With Pi Network: From Start to Latest Controversial Listing

    Everything That’s Going on With Pi Network: From Start to Latest Controversial Listing

    What is Ethereum Liquid Staking and Why It Is Crucial As Shanghai Upgrade Approaches?

    What is Ethereum Liquid Staking and Why It Is Crucial As Shanghai Upgrade Approaches?

    The Lesson in Alameda-FTX About Government Regulation and Crypto (Opinion)

    The Lesson in Alameda-FTX About Government Regulation and Crypto (Opinion)

    Join Our Newsletter
    Become a CryptoPotato VIP
    One Weekly Email Can Change Your Crypto Life.
    Sign-up FREE to receive our extended weekly market update and coin analysis report
    We NEVER send spam. You can unsubscribe at any time.
    Invalid email address
    Thanks for subscribing!
    Footer Logo
    About
    Advertise on CryptoPotato
    About Us | Contact Us | Careers
    Editorial Policy
    Terms of service | Privacy Policy | GDPR
    More Sections
    IEO List | Evaluations
    Airdrops
    Scholarship
    Disclaimer
    Disclaimer: Information found on CryptoPotato is those of writers quoted. It does not represent the opinions of CryptoPotato on whether to buy, sell, or hold any investments. You are advised to conduct your own research before making any investment decisions. Use provided information at your own risk. Full disclaimer
    © Copyright CryptoPotato 2016 - 2021
    Scroll to top
    One Weekly Email Can Change Your Crypto Life.

    Sign-up FREE to receive our extended weekly market update and coin analysis report

    We never send SPAM. You can unsubscribe at any moment
    Invalid email address
    Thanks for subscribing!