

Bitcoin
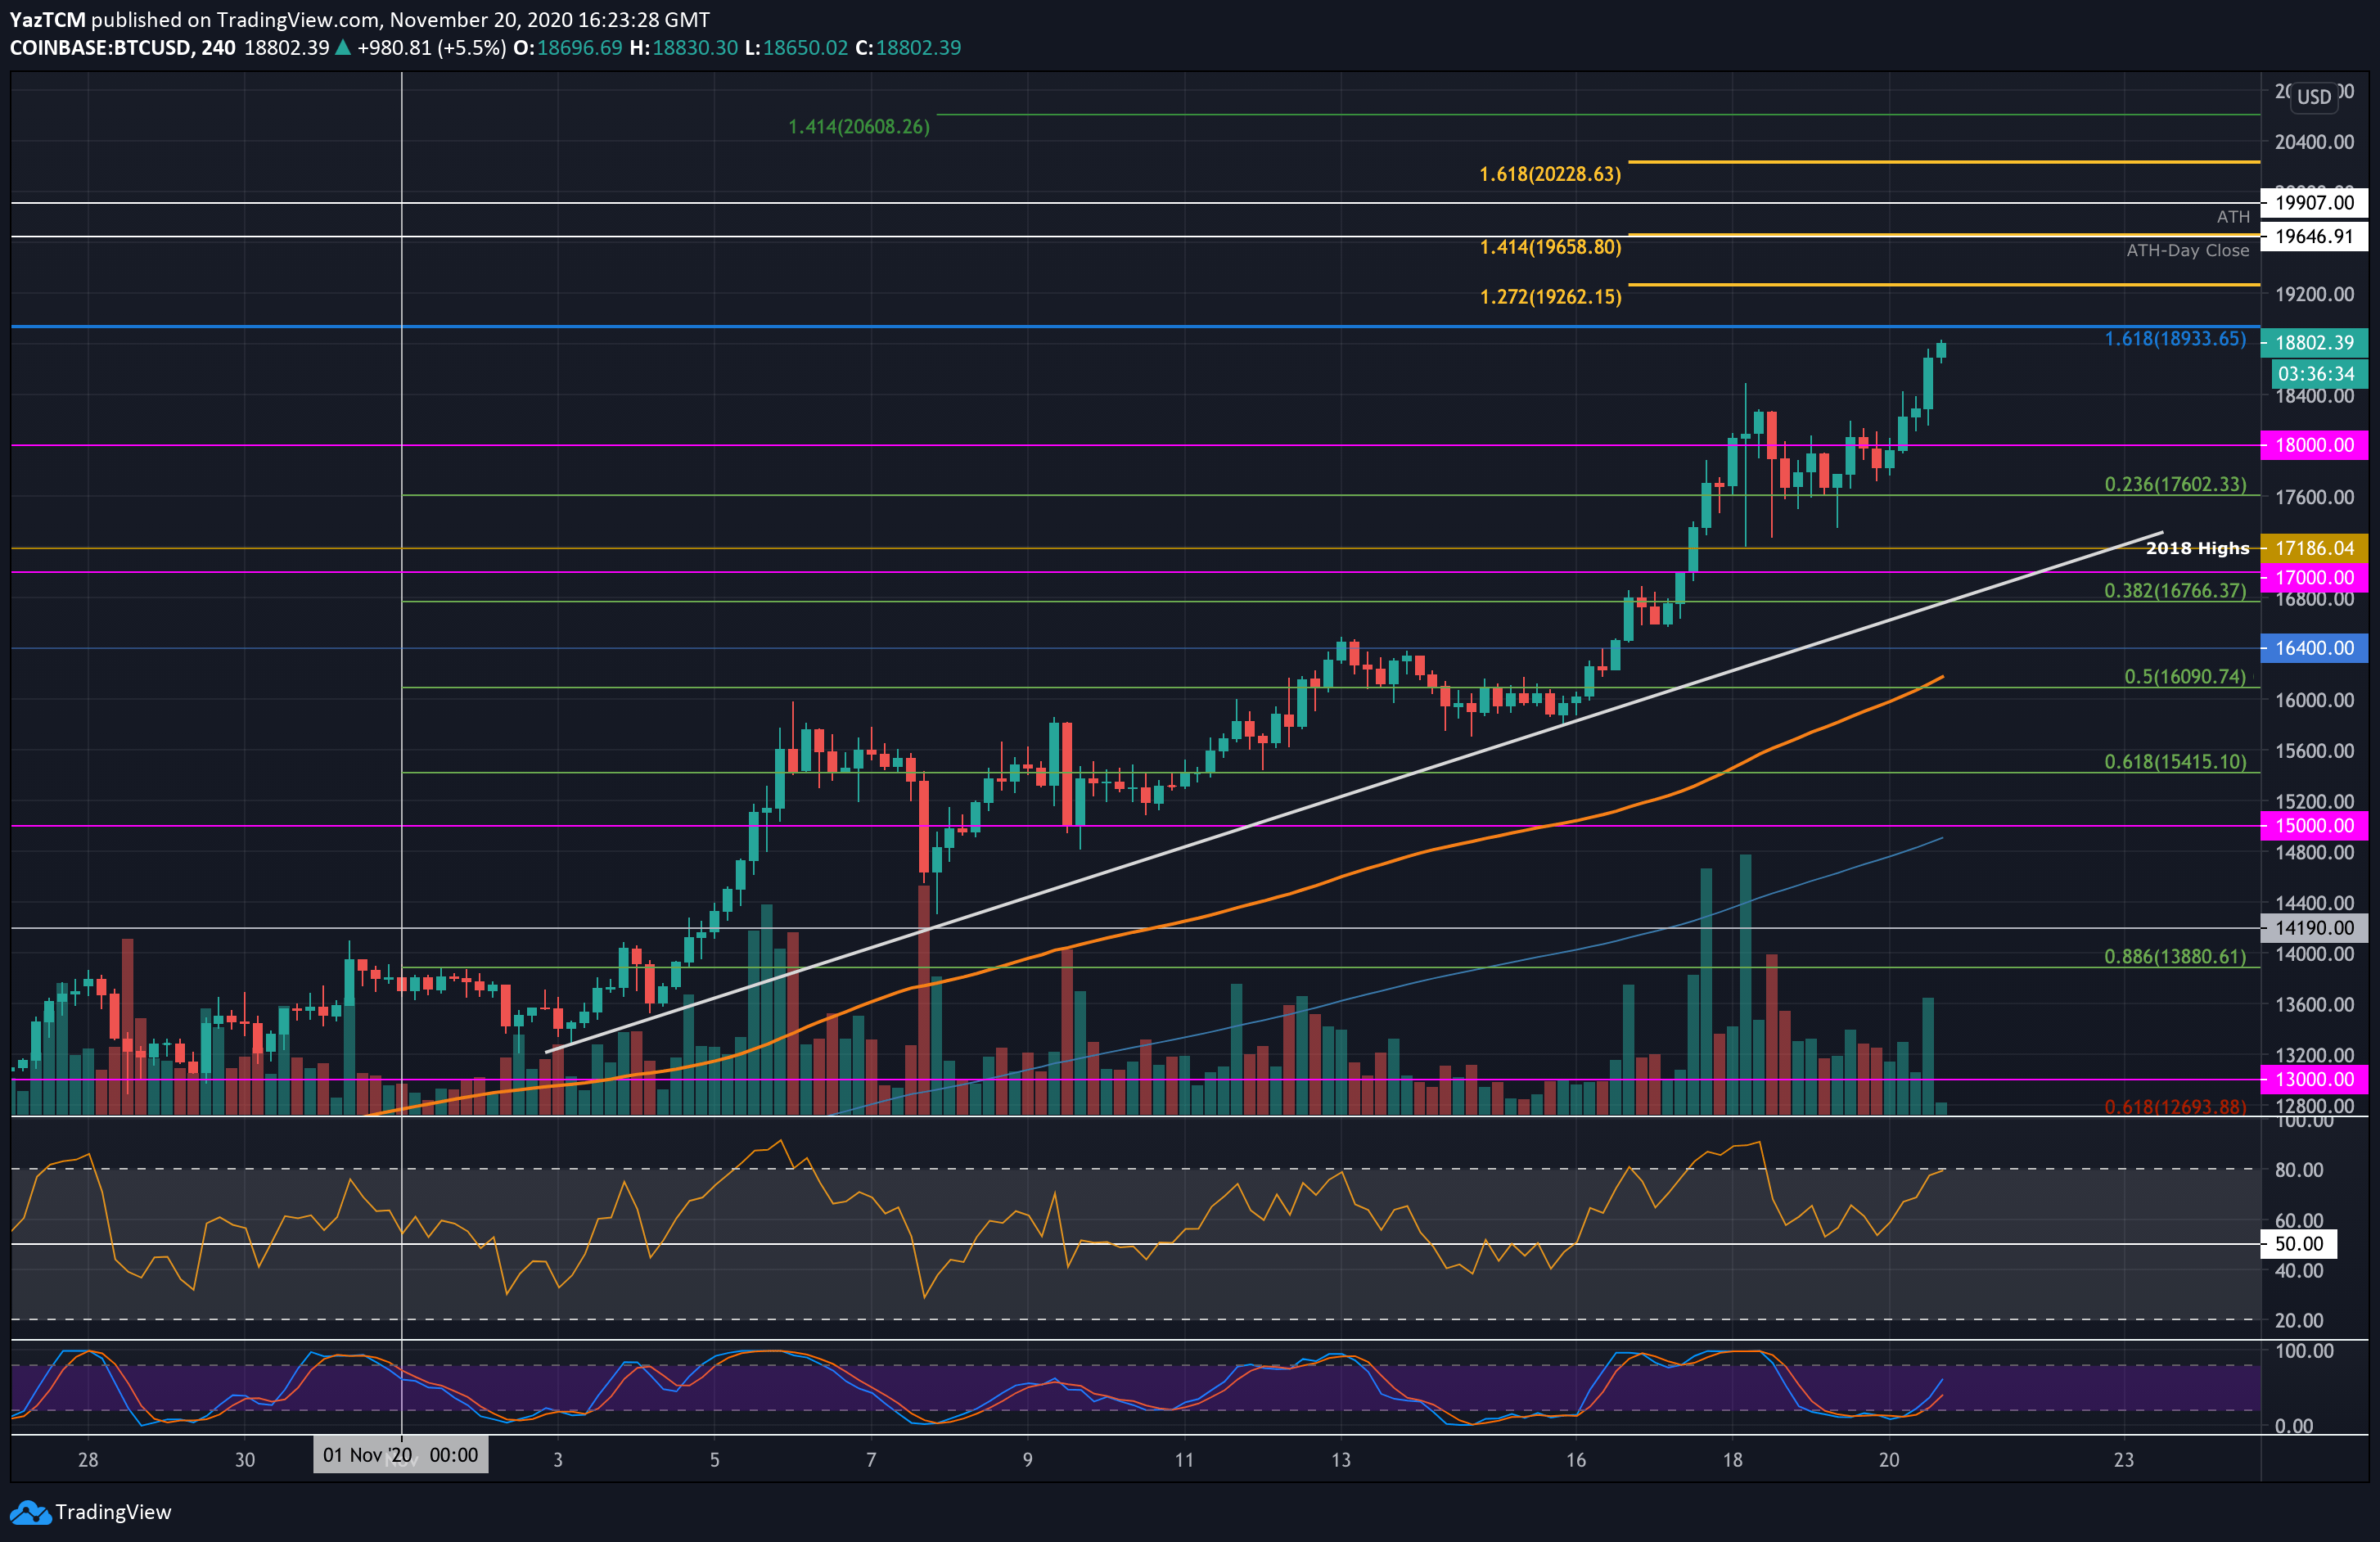
Bitcoin went through another powerful 15% price surge this week, which saw the cryptocurrency climbing over $18,000 and reaching as high as $18,800. It was trading at $16,400 last Friday, and it struggled to break this resistance over the weekend.
This change on Monday, when Bitcoin started to surge higher. It quickly managed to push above $17,000 and break the resistance at the 2018 High at $17,186. The bull run continued higher throughout the week until resistance was found at around $18,200. It dropped lower from there over the past two days but managed to remain support at $17,600.
Today, Bitcoin has surged back above $18,000 and managed to push beyond $18,400, to reach the current $18,800 level.
Looking ahead, the first level of resistance is expected at $18,933 (1.618 Fib Extension). Beyond $19,000, resistance is then found at $19,262 (1.272 Fib Extension), $19,500, $19,646 (ATH-day closing price), and $19,907 (ATH).
Beyond the ATH, resistance lies at $20,000, $20,228 (1.618 Fib Extension – yellow), $20,500, and $20,600.
On the other side, the first level of support lies at $18,400. Beneath this, support is expected at $18,000, $17,600 (.236 Fib), $17,186 (2018 Highs), and $17,000. Added support lies at $16,766 (.382 Fib), $16,400, and $16,100 (100-days EMA).
Ethereum
Ethereum witnessed a smaller 10% price surge this week, but it still managed to break the $500 resistance level. The coin had climbed into the September High-Day closing price at $475 last Friday and headed lower over the weekend.
It managed to rebound from $438 (August 2018 Highs) and climb over the week. Today, Ethereum pushed back above $475 and broke resistance at $490 and $500 to reach the current resistance at $511 (1.618 Fib Extension).
Looking ahead, if the buyers continue beyond $511, resistance is expected at $528, $548 (long term bearish .618 Fib), $568 (1.414 Fib extension), and $580.
On the other side, the first level of support lies at $500. Beneath this, support is found at $490, $480, $456 (.382 Fib), and $438 (August 2018 Highs).

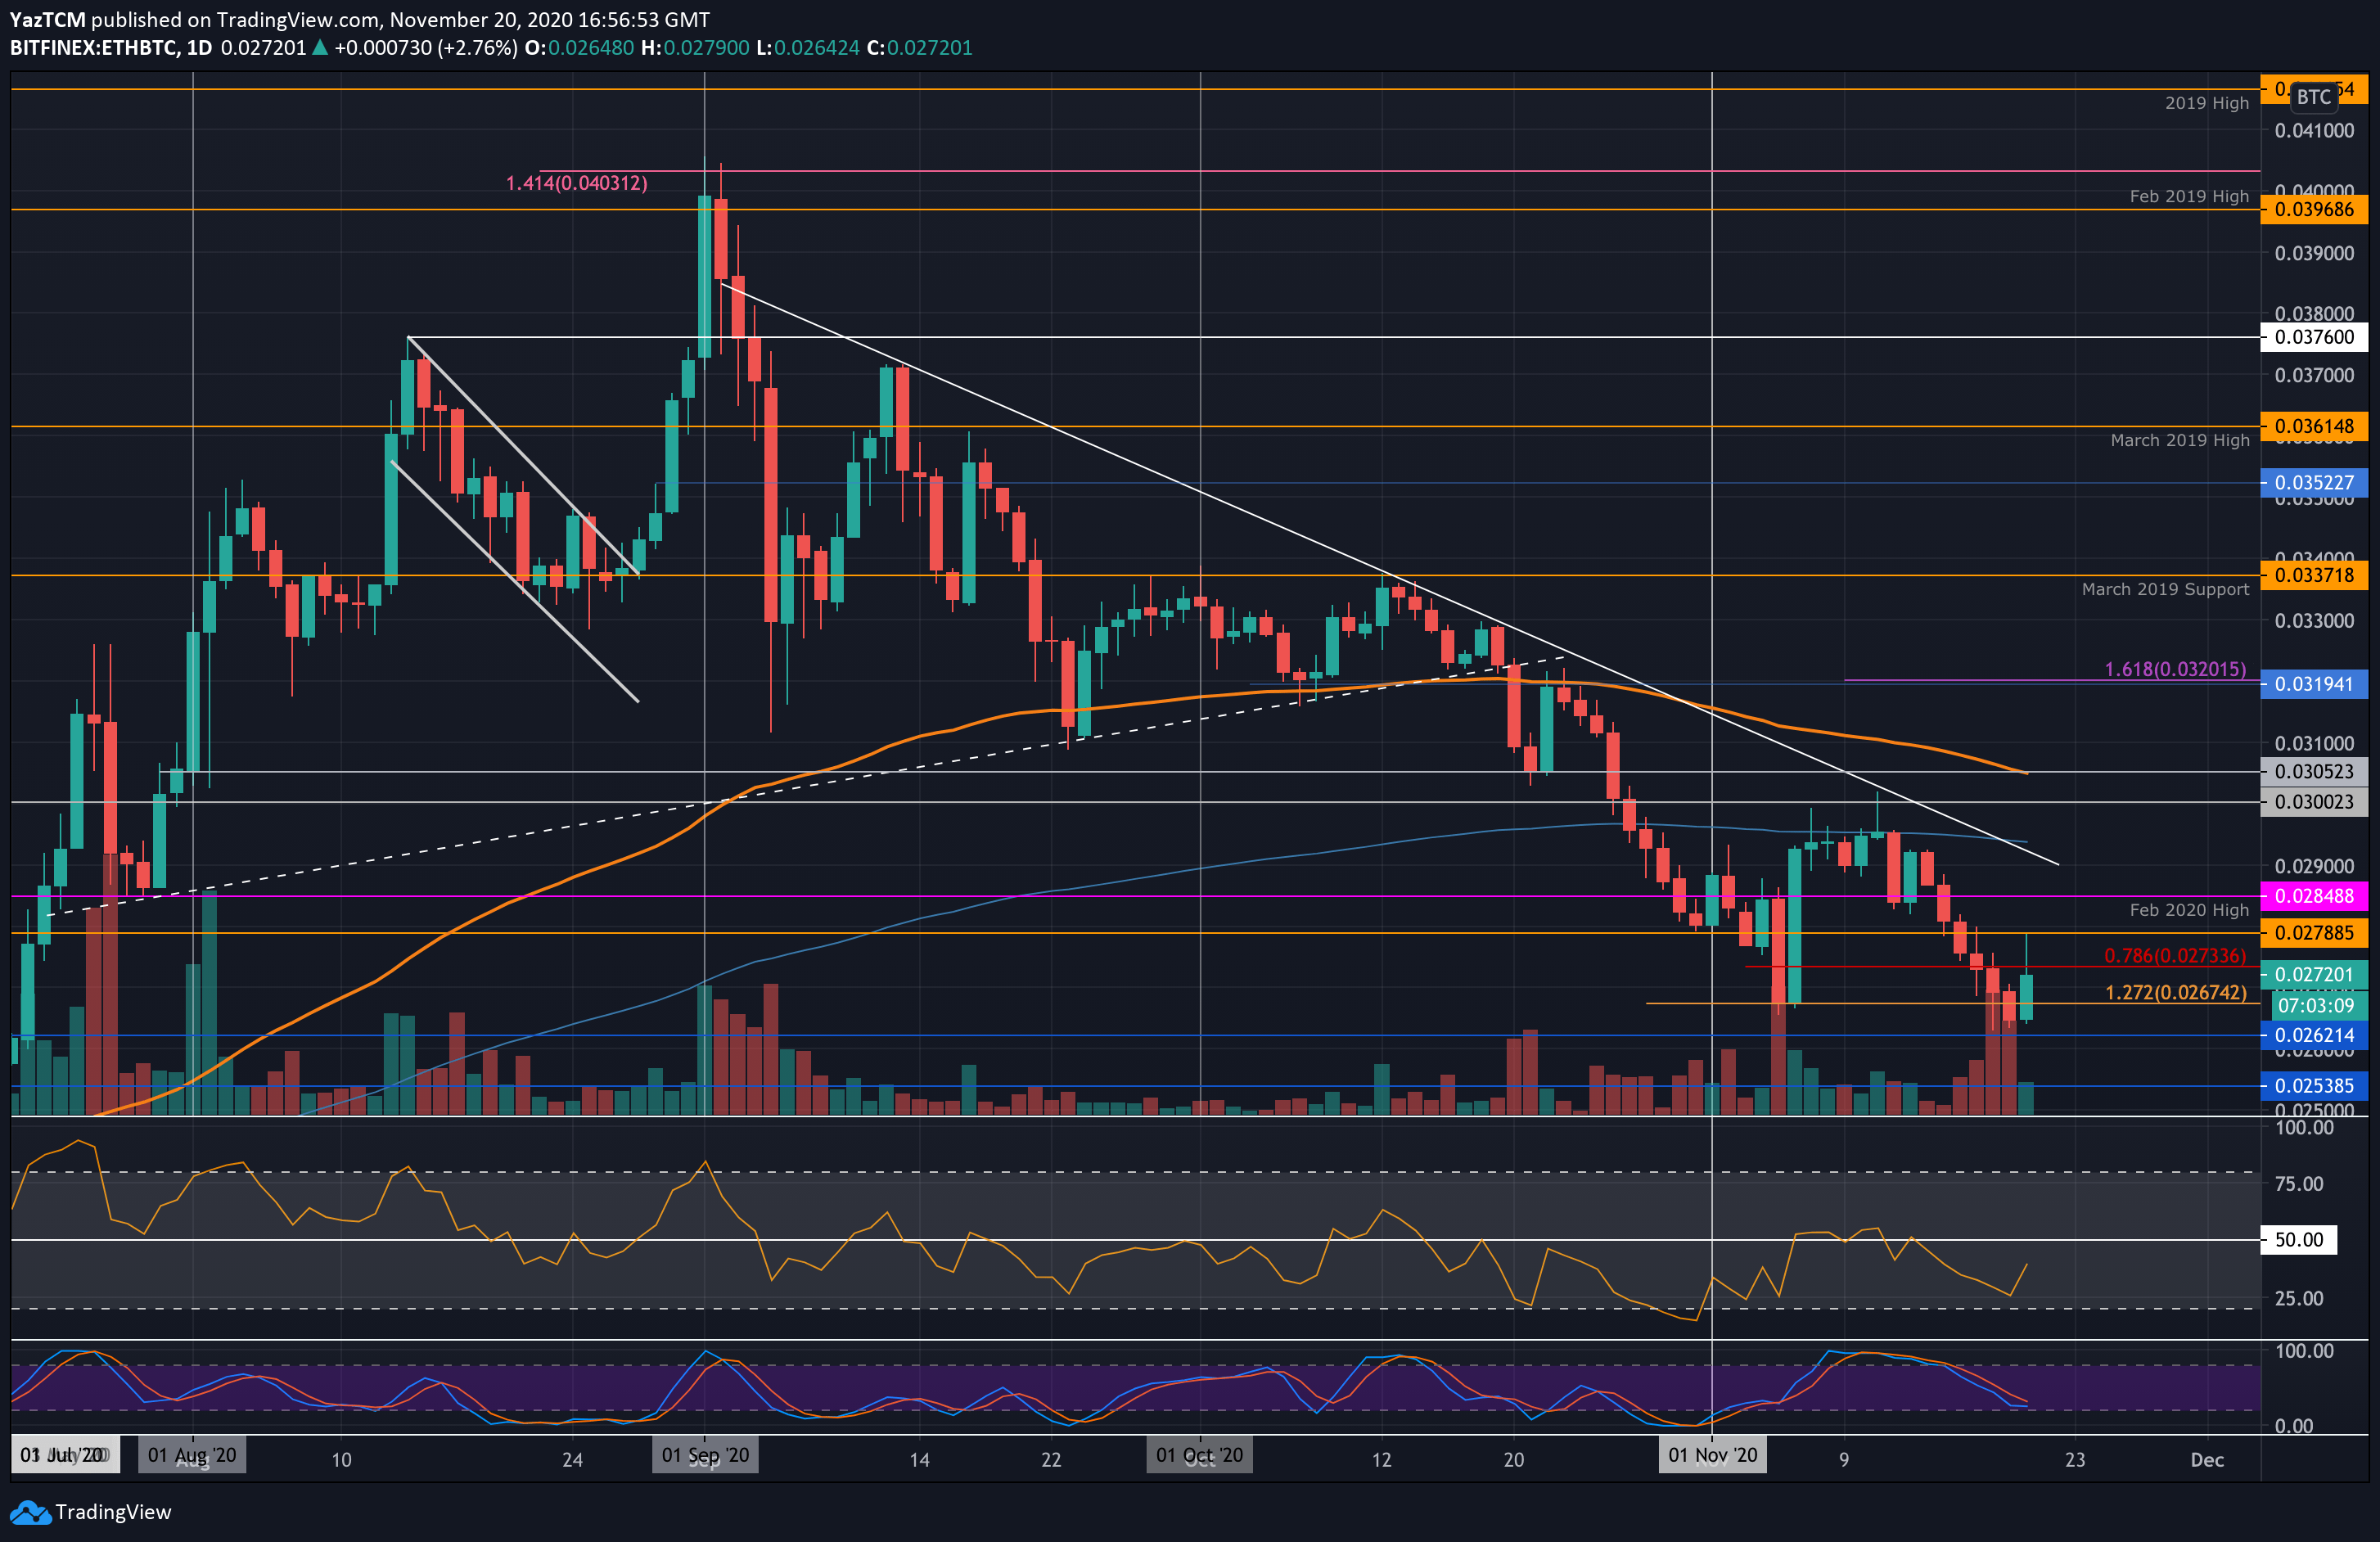
Against Bitcoin, Ethereum actually created a fresh 3-month low this week after it fell beneath 0.0267 BTC to reach as low as 0.0264 BTC yesterday. It managed to rebound from here today as it surged as high as 0.02788 BTC. The sellers have since pushed it lower again to trade at 0.027 BTC.
The buyers will need to push higher and break the 200-days EMA at 0.0295 BTC for any hope of recovery.
Moving forward, if the bulls push higher, the first level of resistance lies at 0.0278 BTC. Above this, resistance lies at 0.0284 BTC (Feb 2020 High), 0.029 BTC (Falling trend line), and 0.0294 BTC (200-days EMA). This is followed by added resistance at 0.03 BTC.
On the other side, the first level of support lies at 0.0267 BTC. Beneath this, support lies at 0.0264 BTC, 0.0262 BTC, 0.026 BTC, and 0.0253 BTC.
Ripple
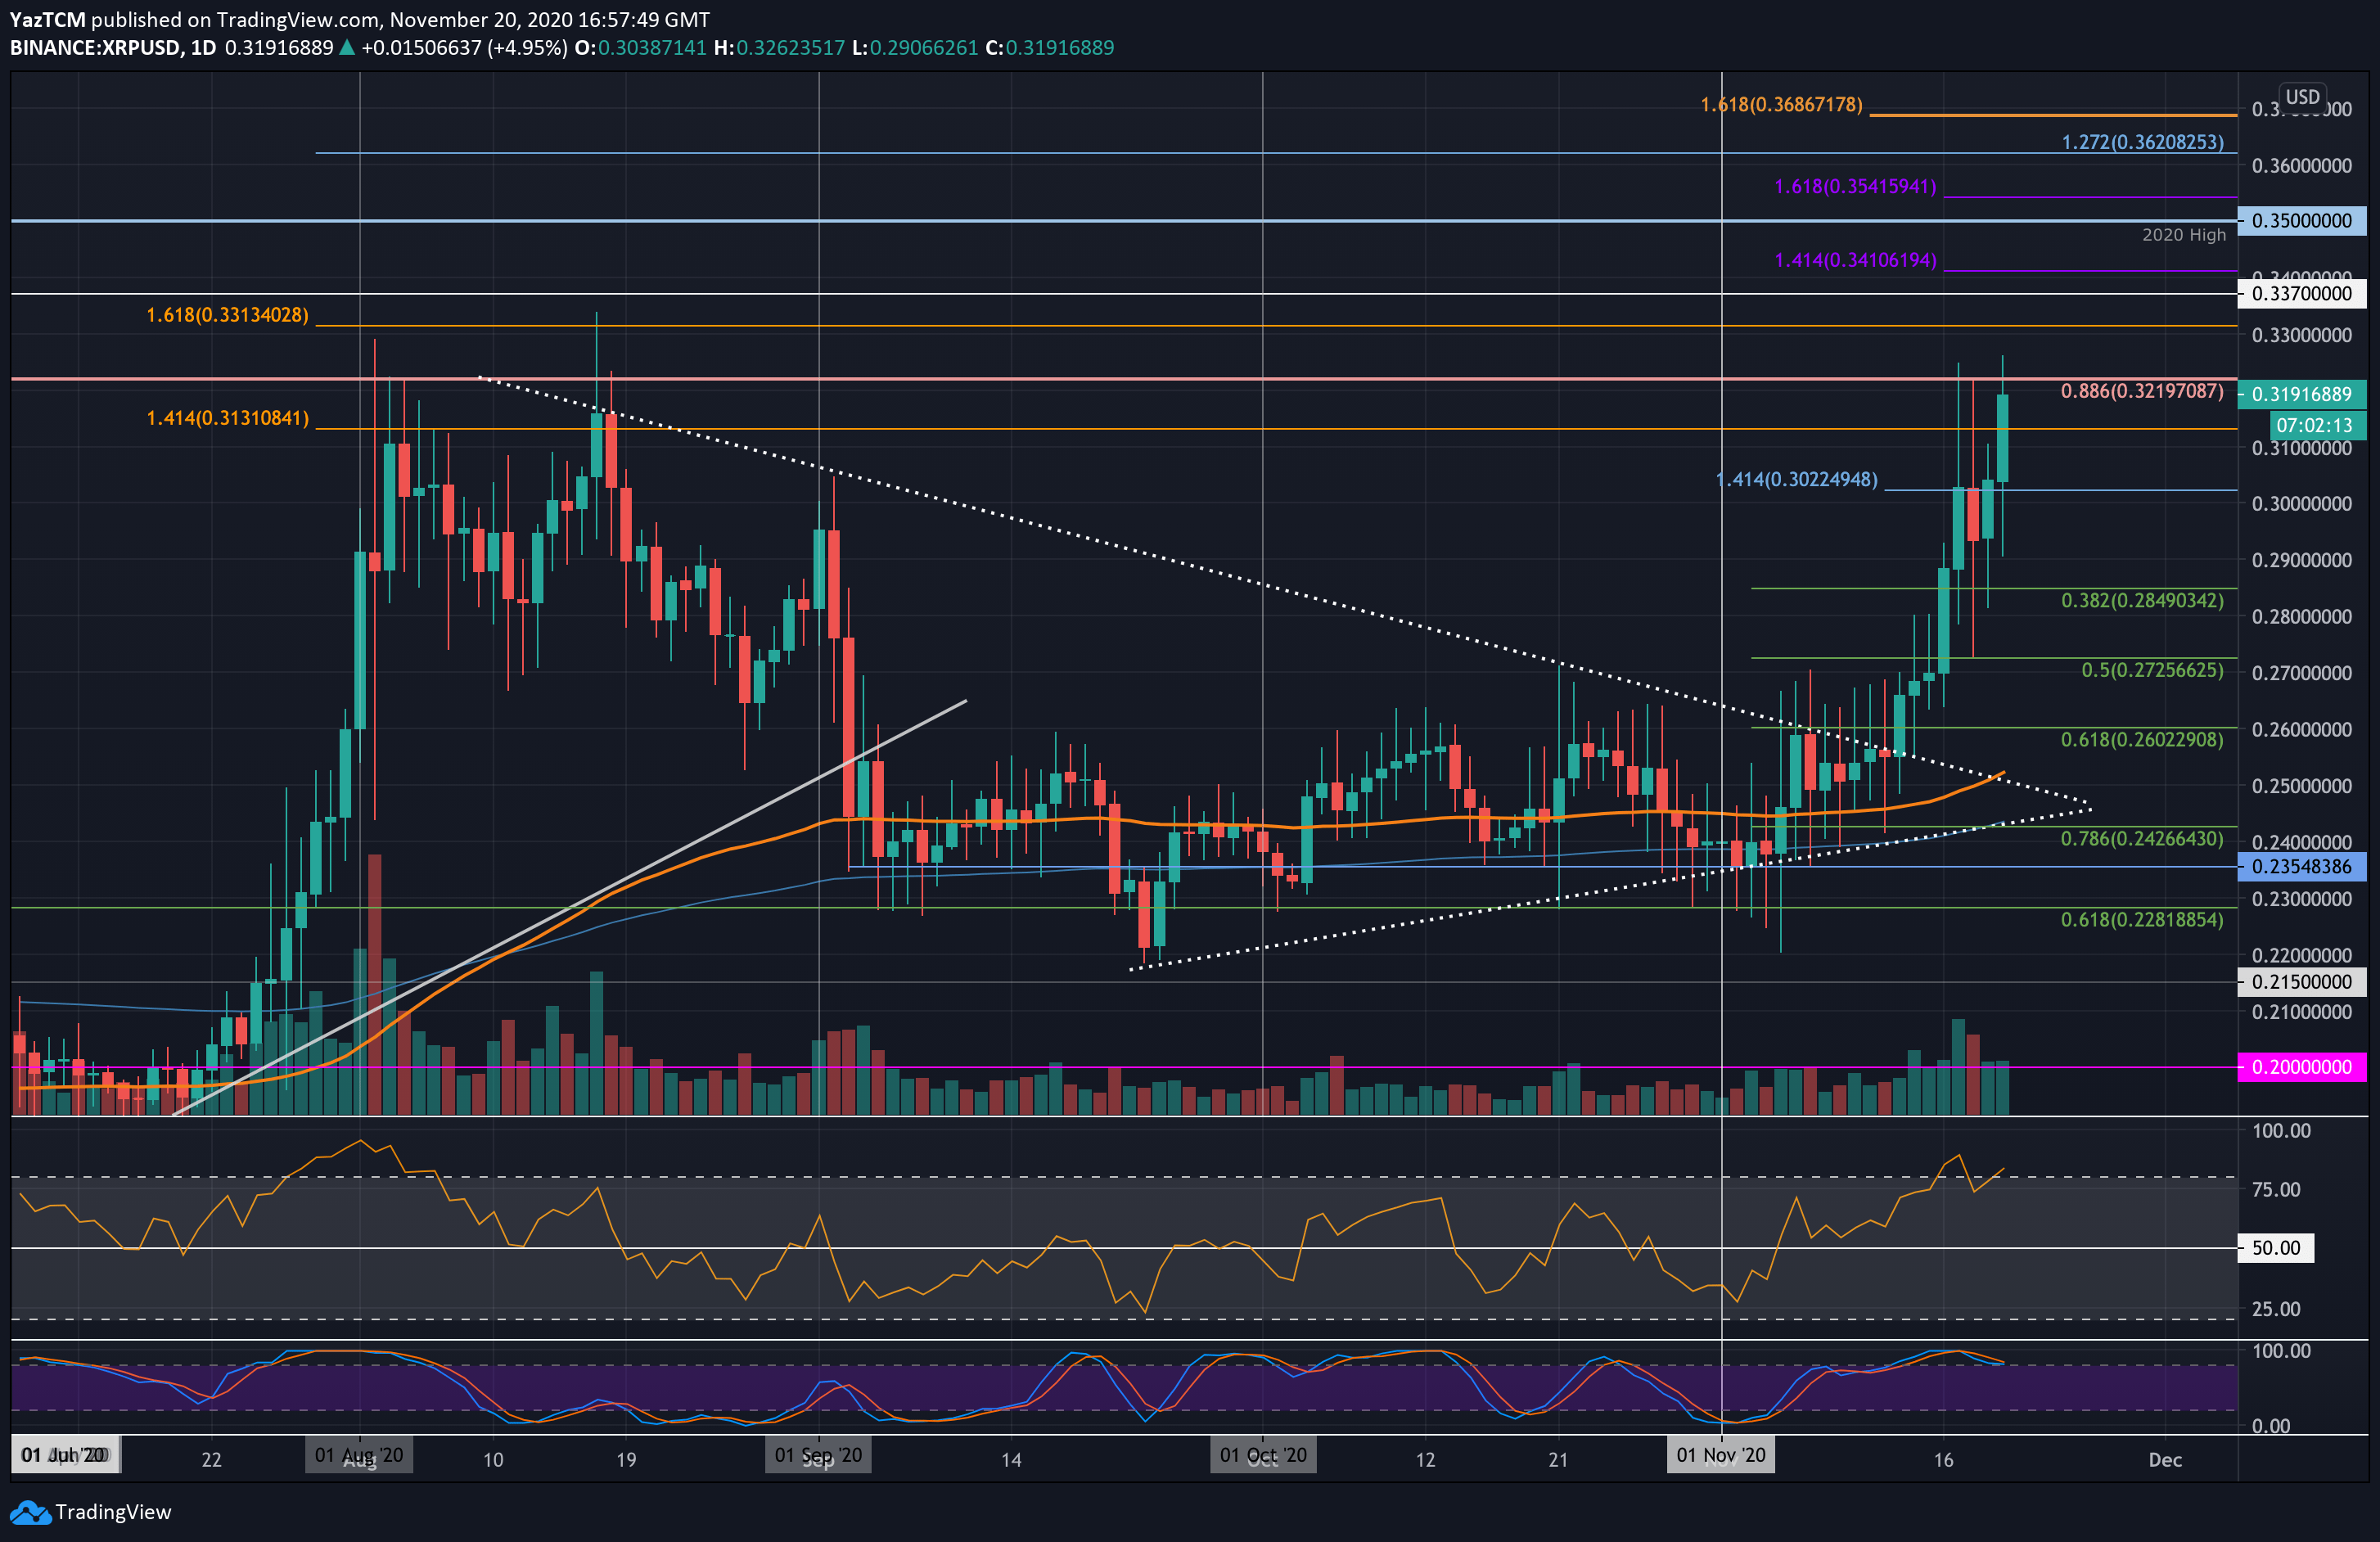
Ripple outperformed Bitcoin this week as the cryptocurrency surged by a powerful 23.7% to reach as high as $0.322 today. The coin has since dropped slightly to trade at $0.319. The coin was trading beneath $0.27 at the end of last week as it started to push higher.
During the week, XRP struggled to close a daily candle above the resistance at $0.30. Today, the bulls managed to break the $0.3 level and push higher into the $0.321 resistance (bearish .886 Fib Retracement).
Looking ahead, if the buyers continue above $0.322, resistance is expected at $0.33, $0.337, $0.341 (1.414 Fib Extension), and $0.35 (2020 High). Additional resistance is located at $0.354 (1.618 Fib Extension), $0.36, and $0.362 (1.272 Fib Extension).
On the other side, the first level of support lies at $0.31. Beneath this, support is found at $0.30, $0.29, and $0.285 (.382 Fib).
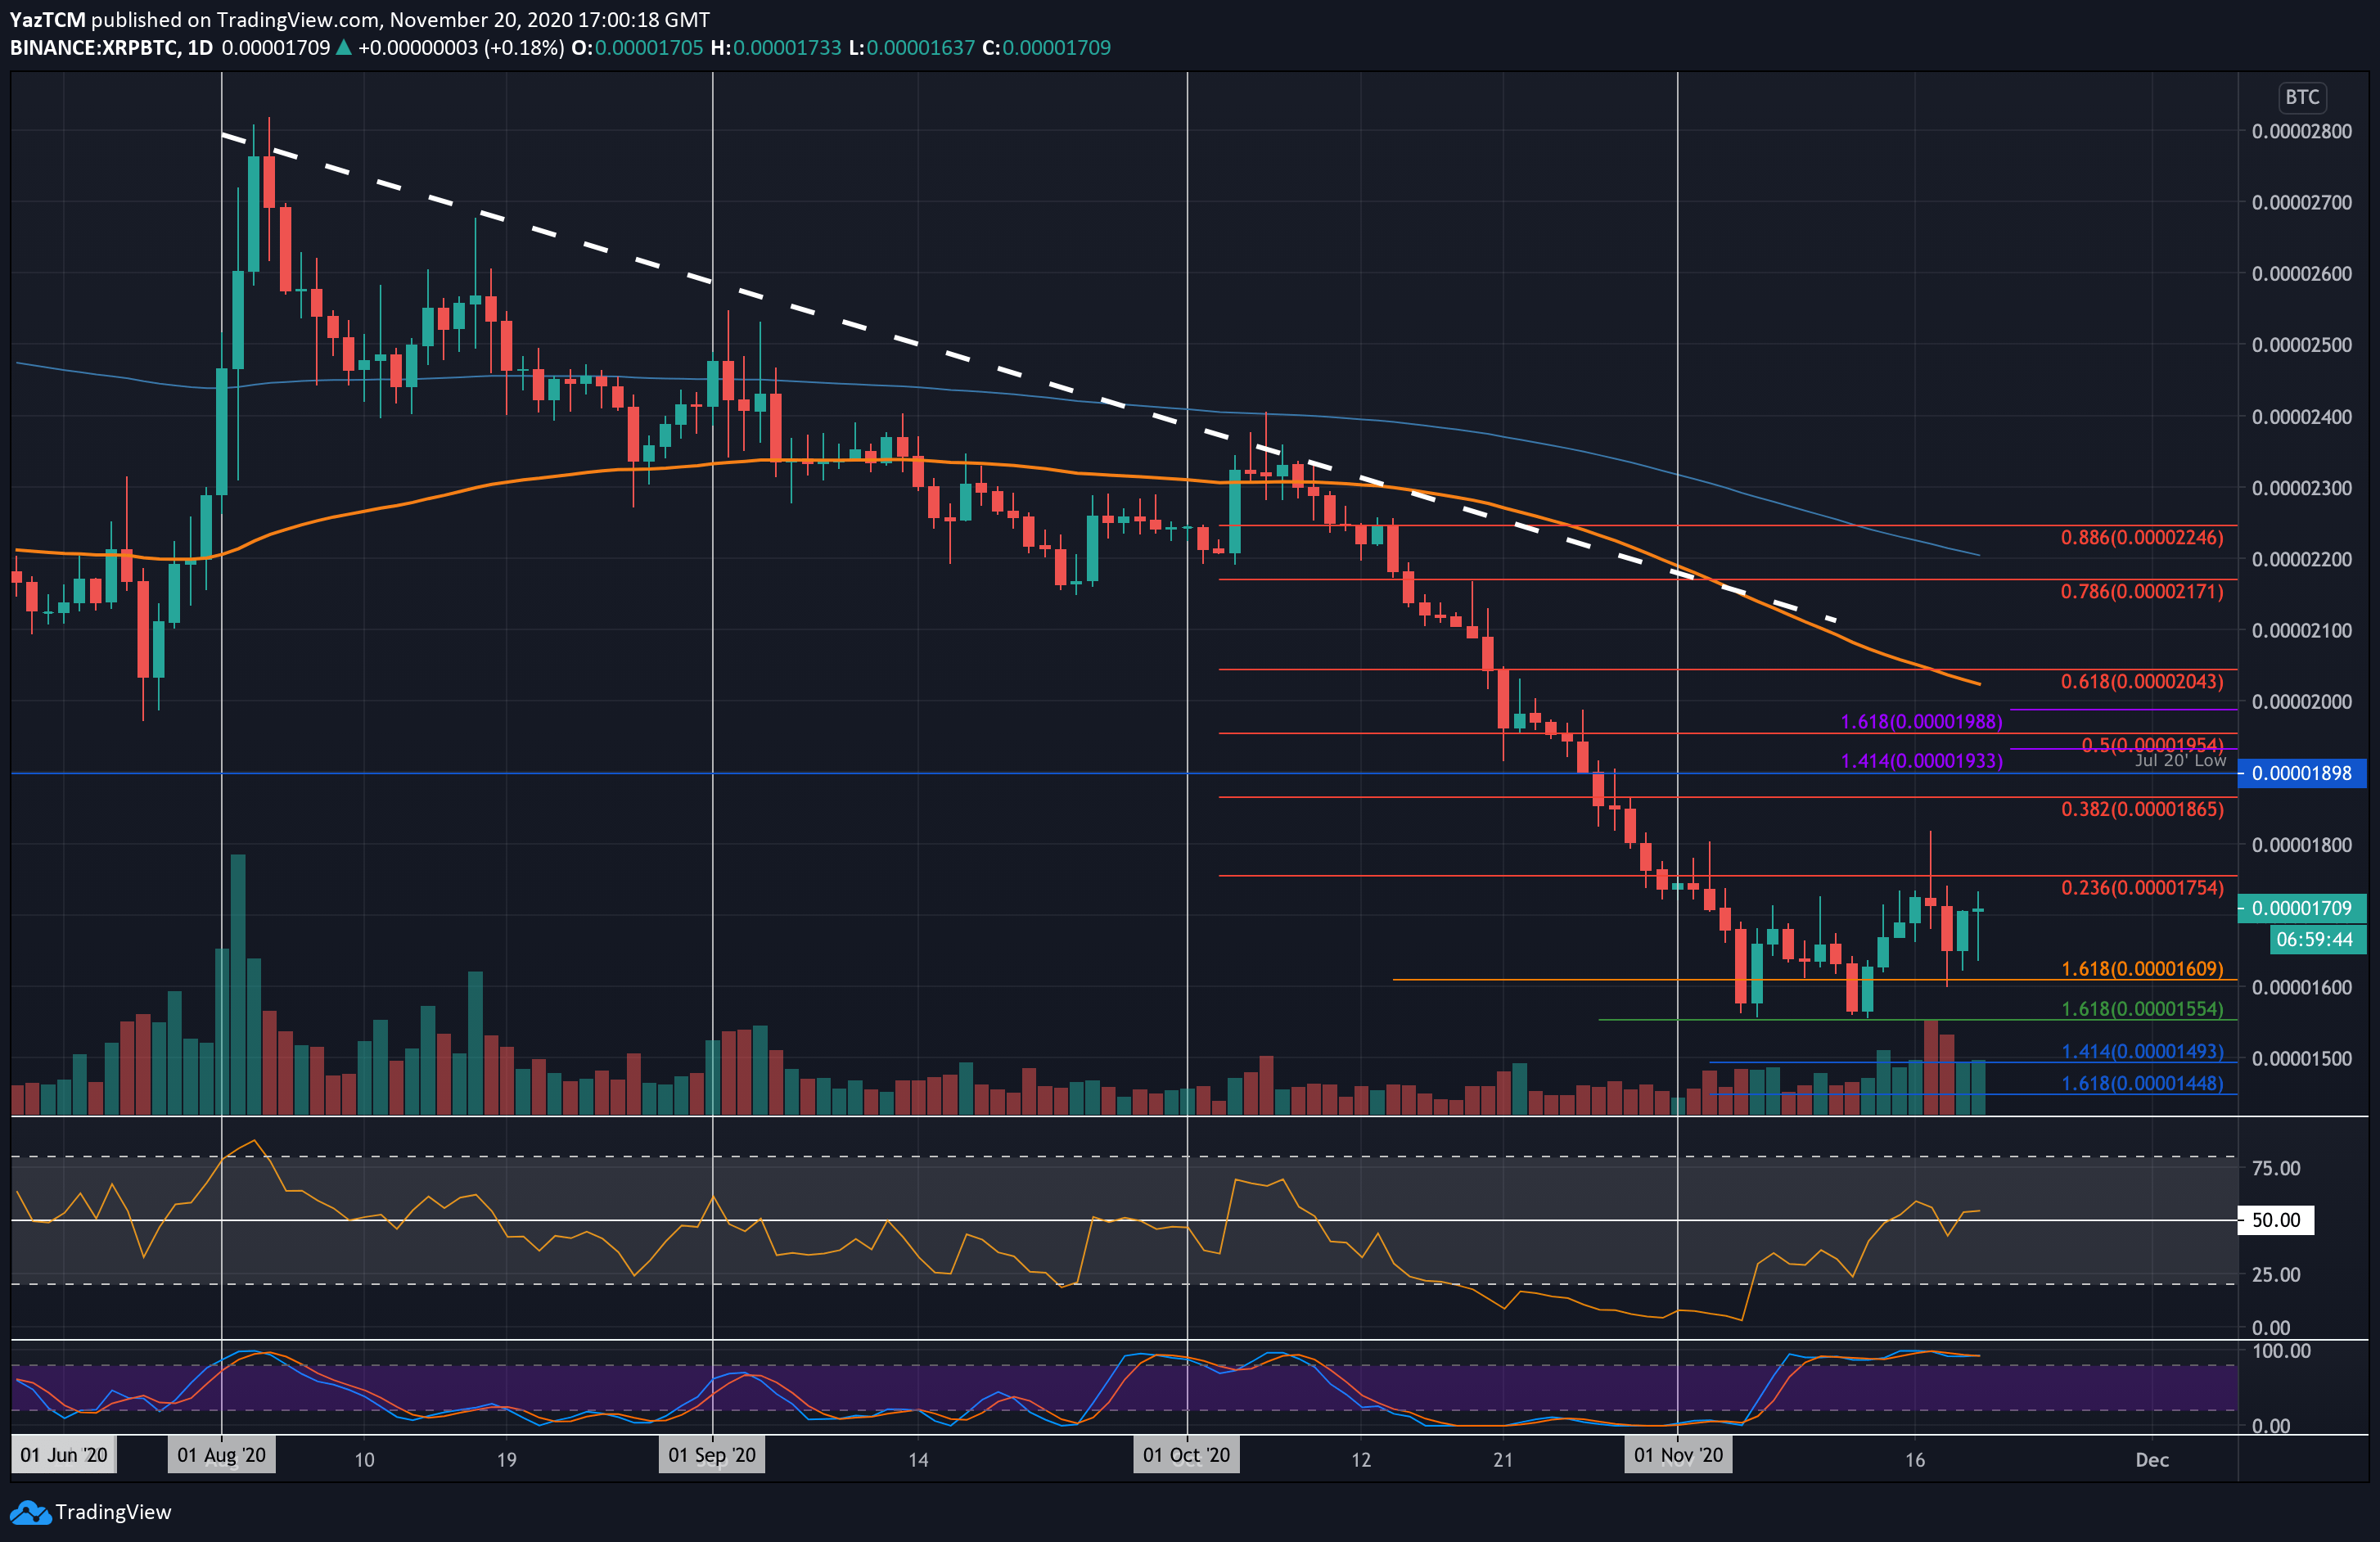
Against BTC, the XRP bulls attempt to jump-start a reversal from the 4-month downtrend it has experienced. The cryptocurrency pushed higher from the 2020 low at 1555 SAT last week and reached as high as 1800 SAT.
The market is now trading in a range between 1755 SAT and 1555 SAT and has been doing so throughout November. The market will need to break this range to dictate the next direction for the coin.
If the buyers push higher, the first level of resistance is expected at 1755 SAT (bearish .236 Fib Retracement). Above this, resistance lies at 1800 SAT, 1865 SAT (bearish .382 Fib), 1900 SAT (July 2020 low), and 1955 SAT (bearish .5 Fib).
On the other side, the first level of support lies at 1650 SAT. Following this, support is found at 1610 SAT, 1555 SAT, 1490 SAT, and 1450 SAT.
Litecoin
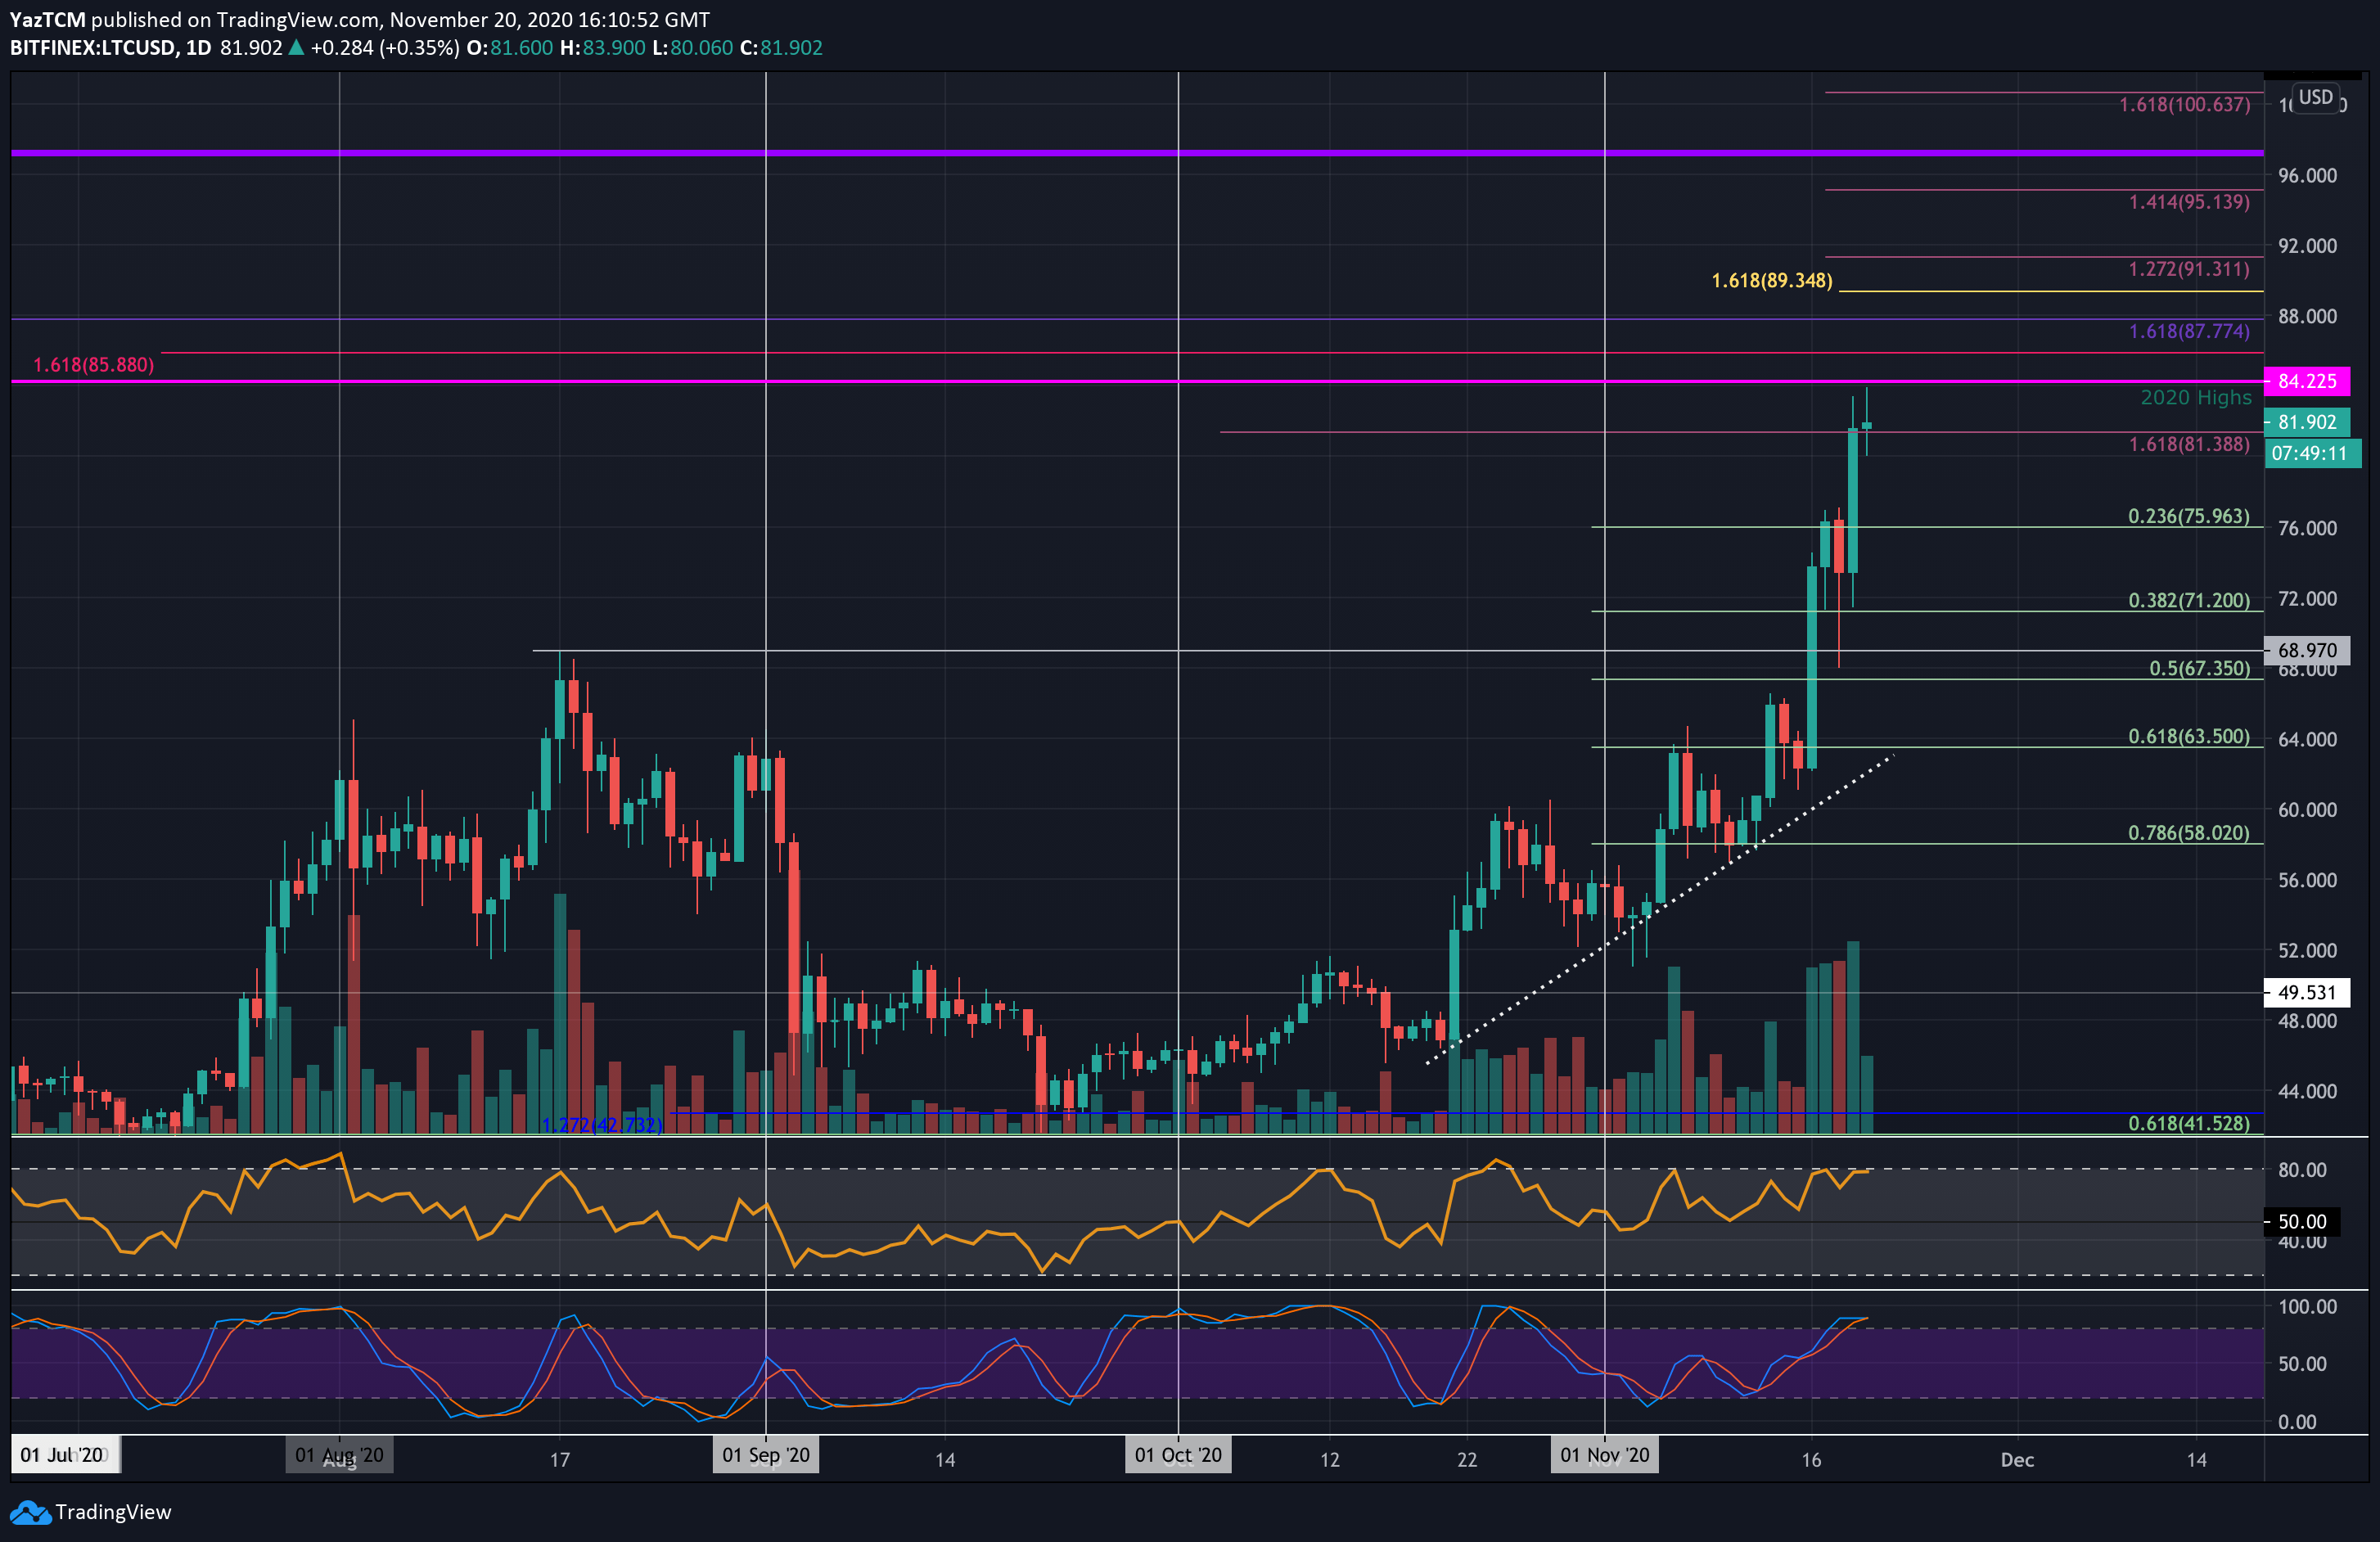
Litecoin is the strongest performer out of the top-20 ranked coins after it surged by a solid 41% to reach the current $81.90 level. The coin had pushed higher from the $63 level last Friday as it began to climb.
On Monday, Litecoin saw a massive surge that allowed the coin to break $64 and reach as high as $74. Yesterday, Litecoin continued further to break $76 and reach the resistance at $81.38. The buyers spiked slightly higher today as they approached the resistance at the 2020 high, around $84.22.
Looking ahead, if the bulls can break the 2020 high, the first level of resistance lies at $85.88. Above this, resistance can be found at $87.77, $90, $91.31, and $95.13. This is followed by resistance at the $100 level.
On the other side, the first level of support lies at $80. Beneath this, support is found at $76 (.236 Fib), $71.20 (.382 Fib), $68.97, and $67.35 (.5 Fib).
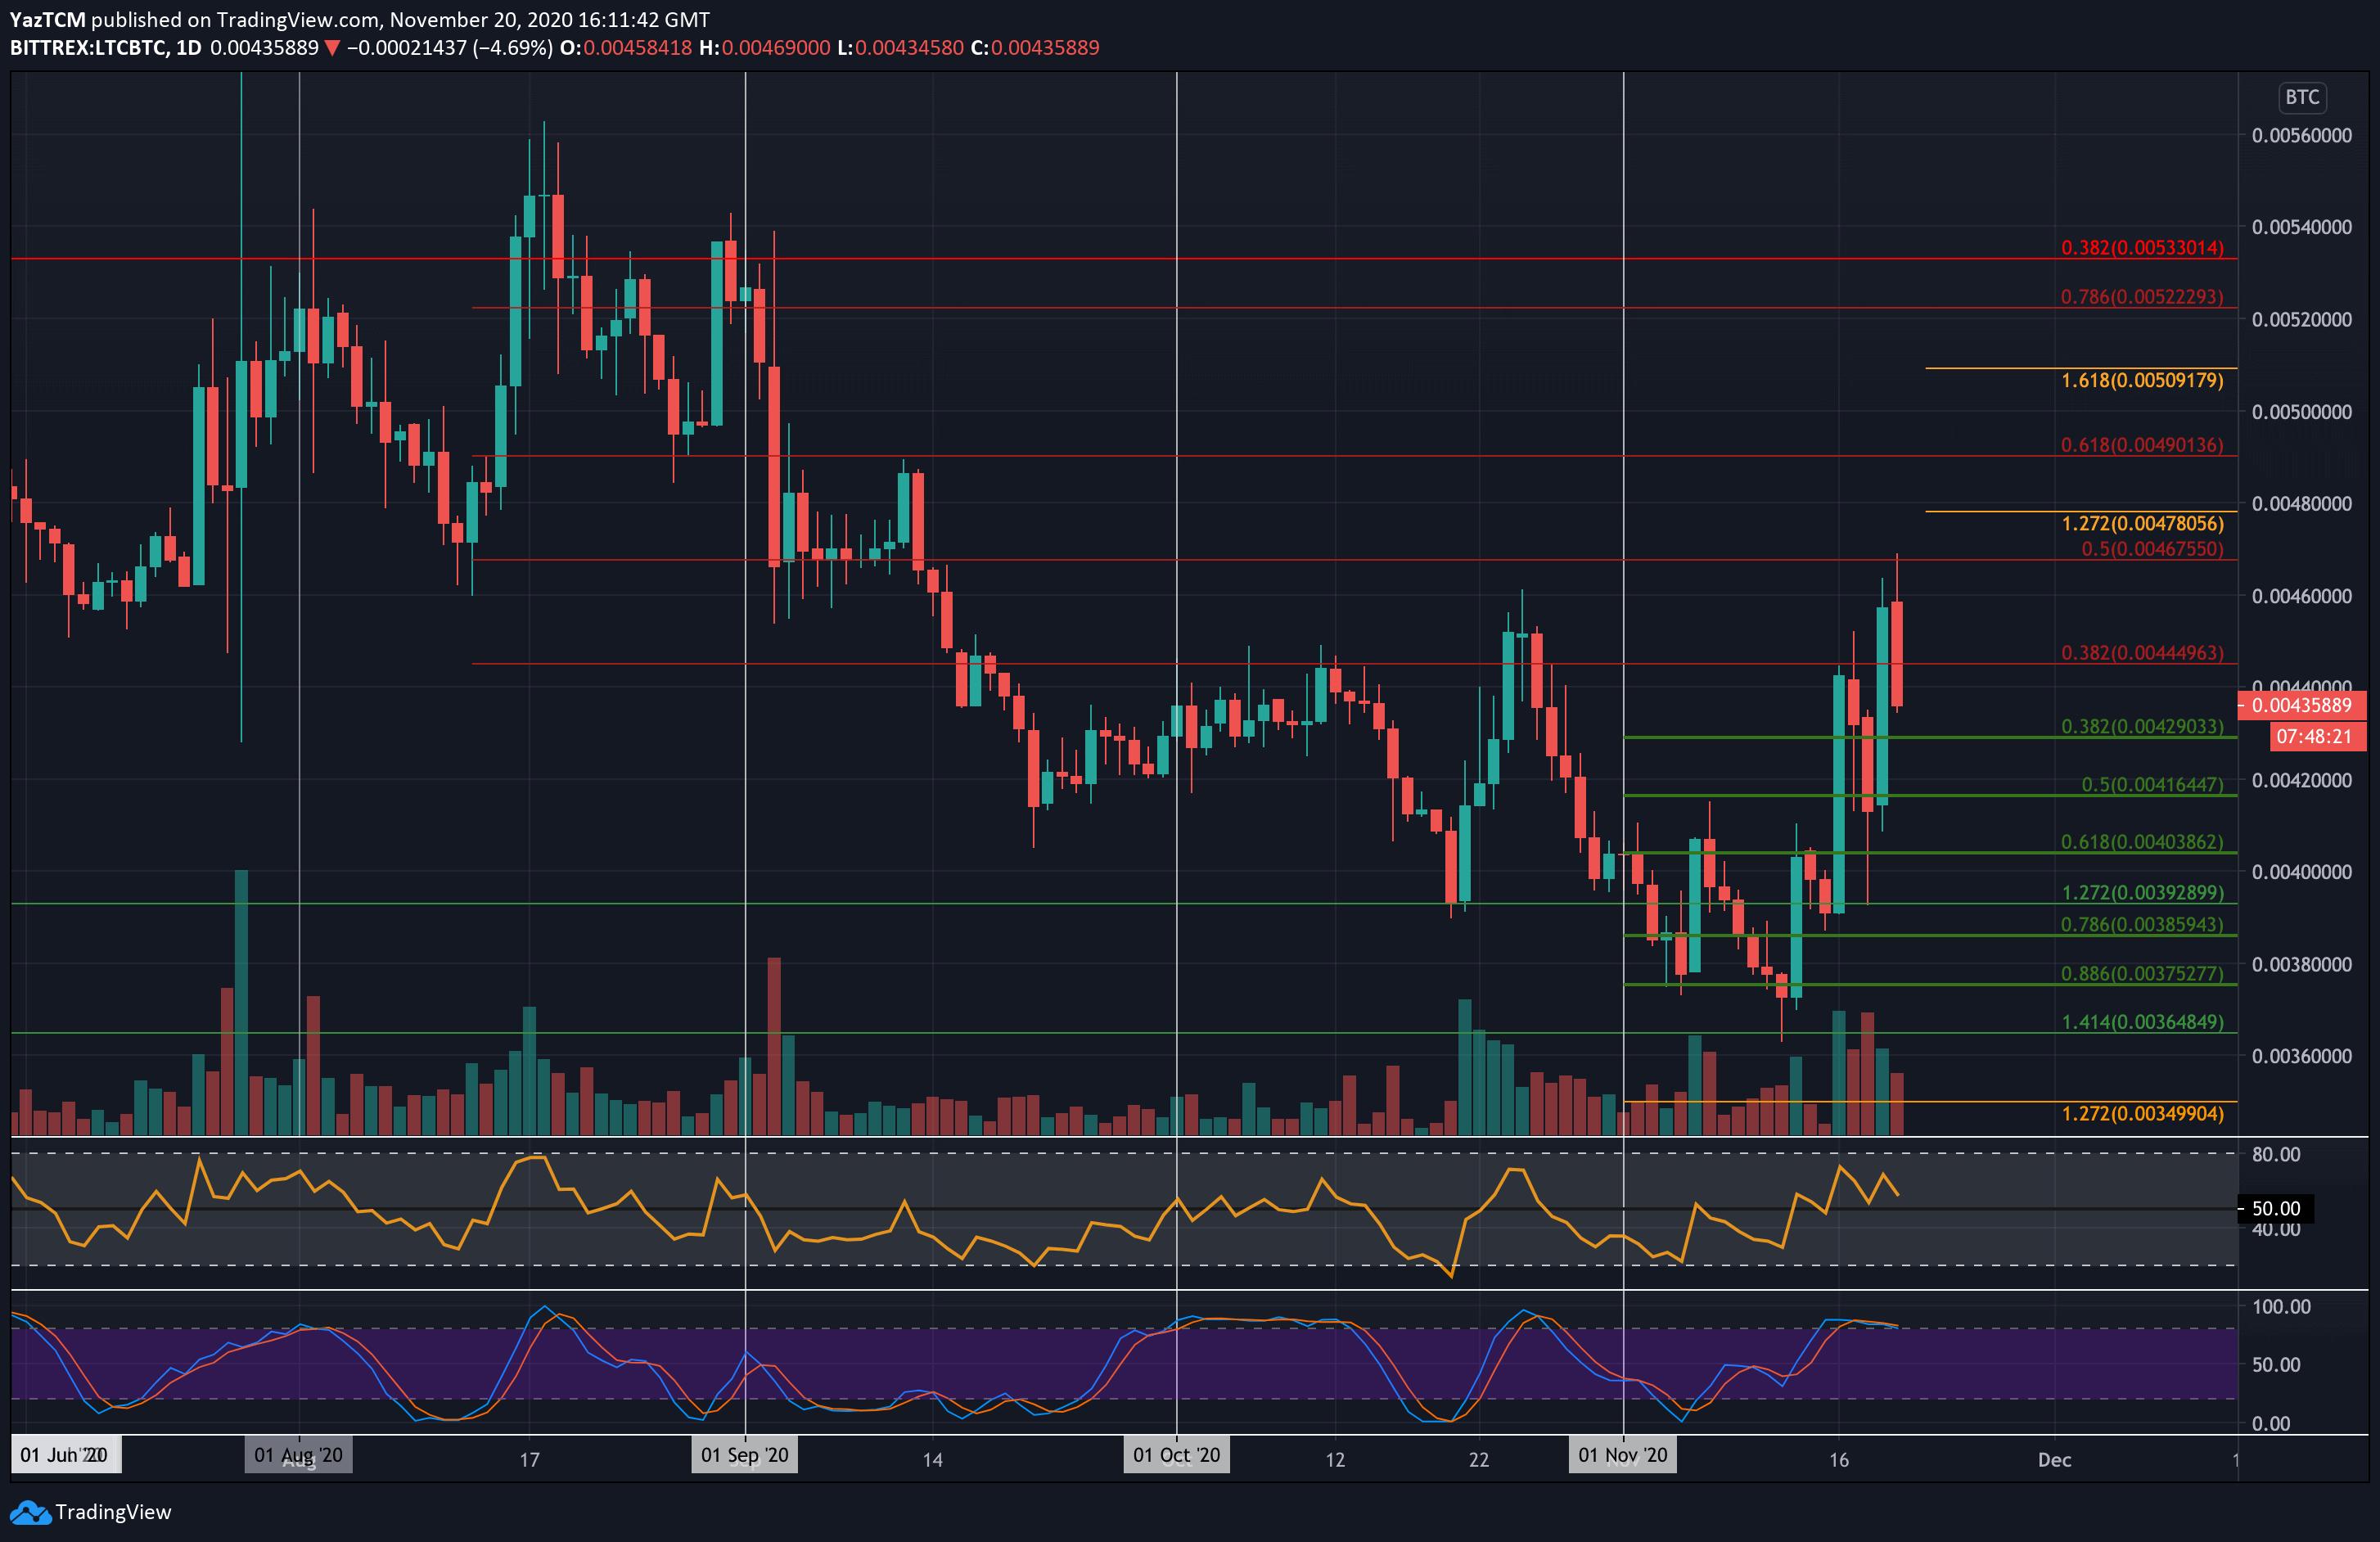
Litecoin has also been surging higher against Bitcoin as it managed to break the October highs today to reach 0.00467 BTC. The cryptocurrency had pushed higher from the 0.0038 BTC level last Friday as it started to skyrocket throughout the week.
On Monday, it found resistance at 0.0044 BTC (bearish .382 Fib) and struggled to pass here until yesterday. Today, it continued higher until it reached the resistance at 0.00467 BTC (bearish .5 Fib). It has since dropped from here and is trading at 0.00435 BTC.
Looking ahead, if the buyers push higher again, resistance is expected at 0.00444 BTC (bearish .382 Fib), 0.0046 BTC, and 0.00467 BTC (bearish .5 Fib). Additional resistance is expected at 0.00478 BTC (1.272 Fib Extension), 0.0049 BTC (bearish .618 Fib Retracement), and 0.00509 BTC (1.618 Fib Extension).
On the other side, the first level of support lies at 0.00429 BTC (.382 Fib). Beneath this, support lies at 0.00416 BTC (.5 Fib), 0.0040 BTC (.618 Fib), and 0.00385 BTC.
Polkadot
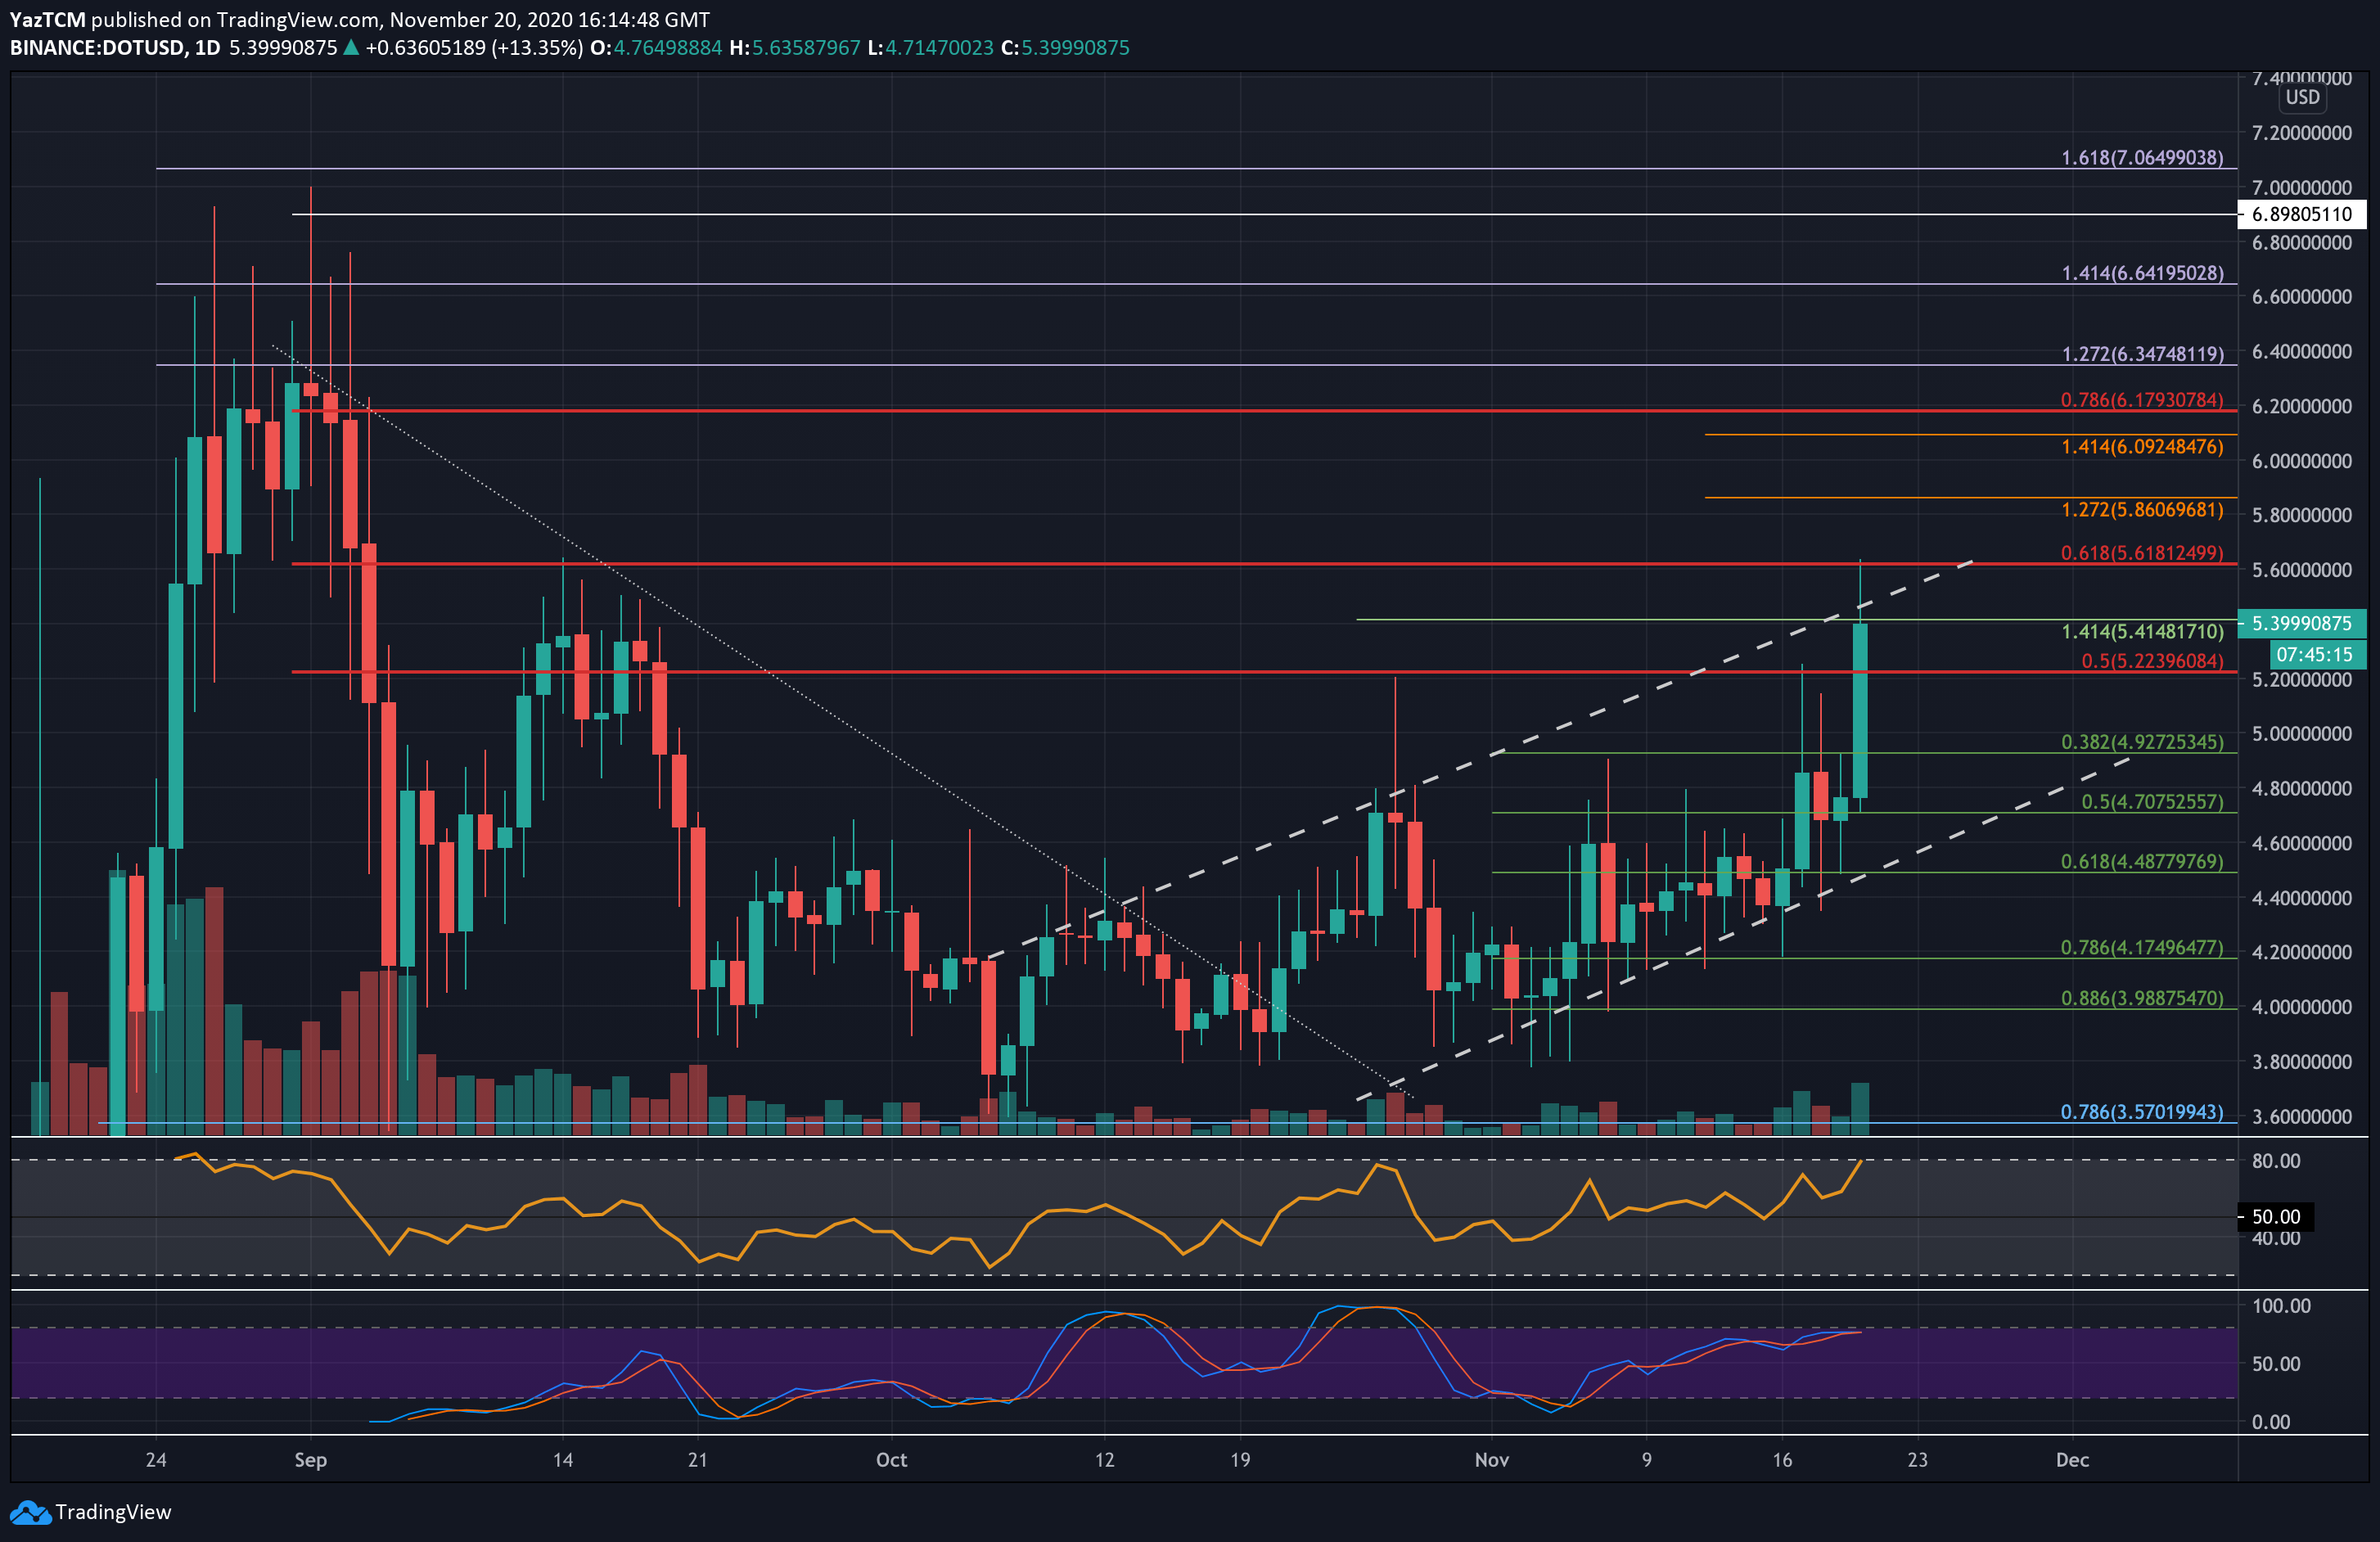
Polkadot saw a smaller 22.9% price hike this week – but it still managed to outperform Bitcoin. The coin has been trading within an ascending price channel since mid-October, and it bounced higher from the lower boundary of this channel this week.
The cryptocurrency surged higher today to spike as high as $5.61 (bearish .618 Fib Retracement). It has since dropped lower to trade around $5.41 (1.414 Fib Extension) near the price channel’s upper boundary.
Looking ahead, if the bulls push higher, the first level of resistance lies at the upper boundary of the price channel. Above this, resistance is found at $5.61 (bearish .618 Fib), $5.86 (1.272 Fib Extension), $6.10 (1.414 Fib extension), and $6.18 (bearish .786 Fib Retracement).
On the other side, the first level of support is found at $5.22. Beneath this, support lies at $5.00, $4.92 (.382 Fib), $4.70 (.5 Fib), and $4.50.
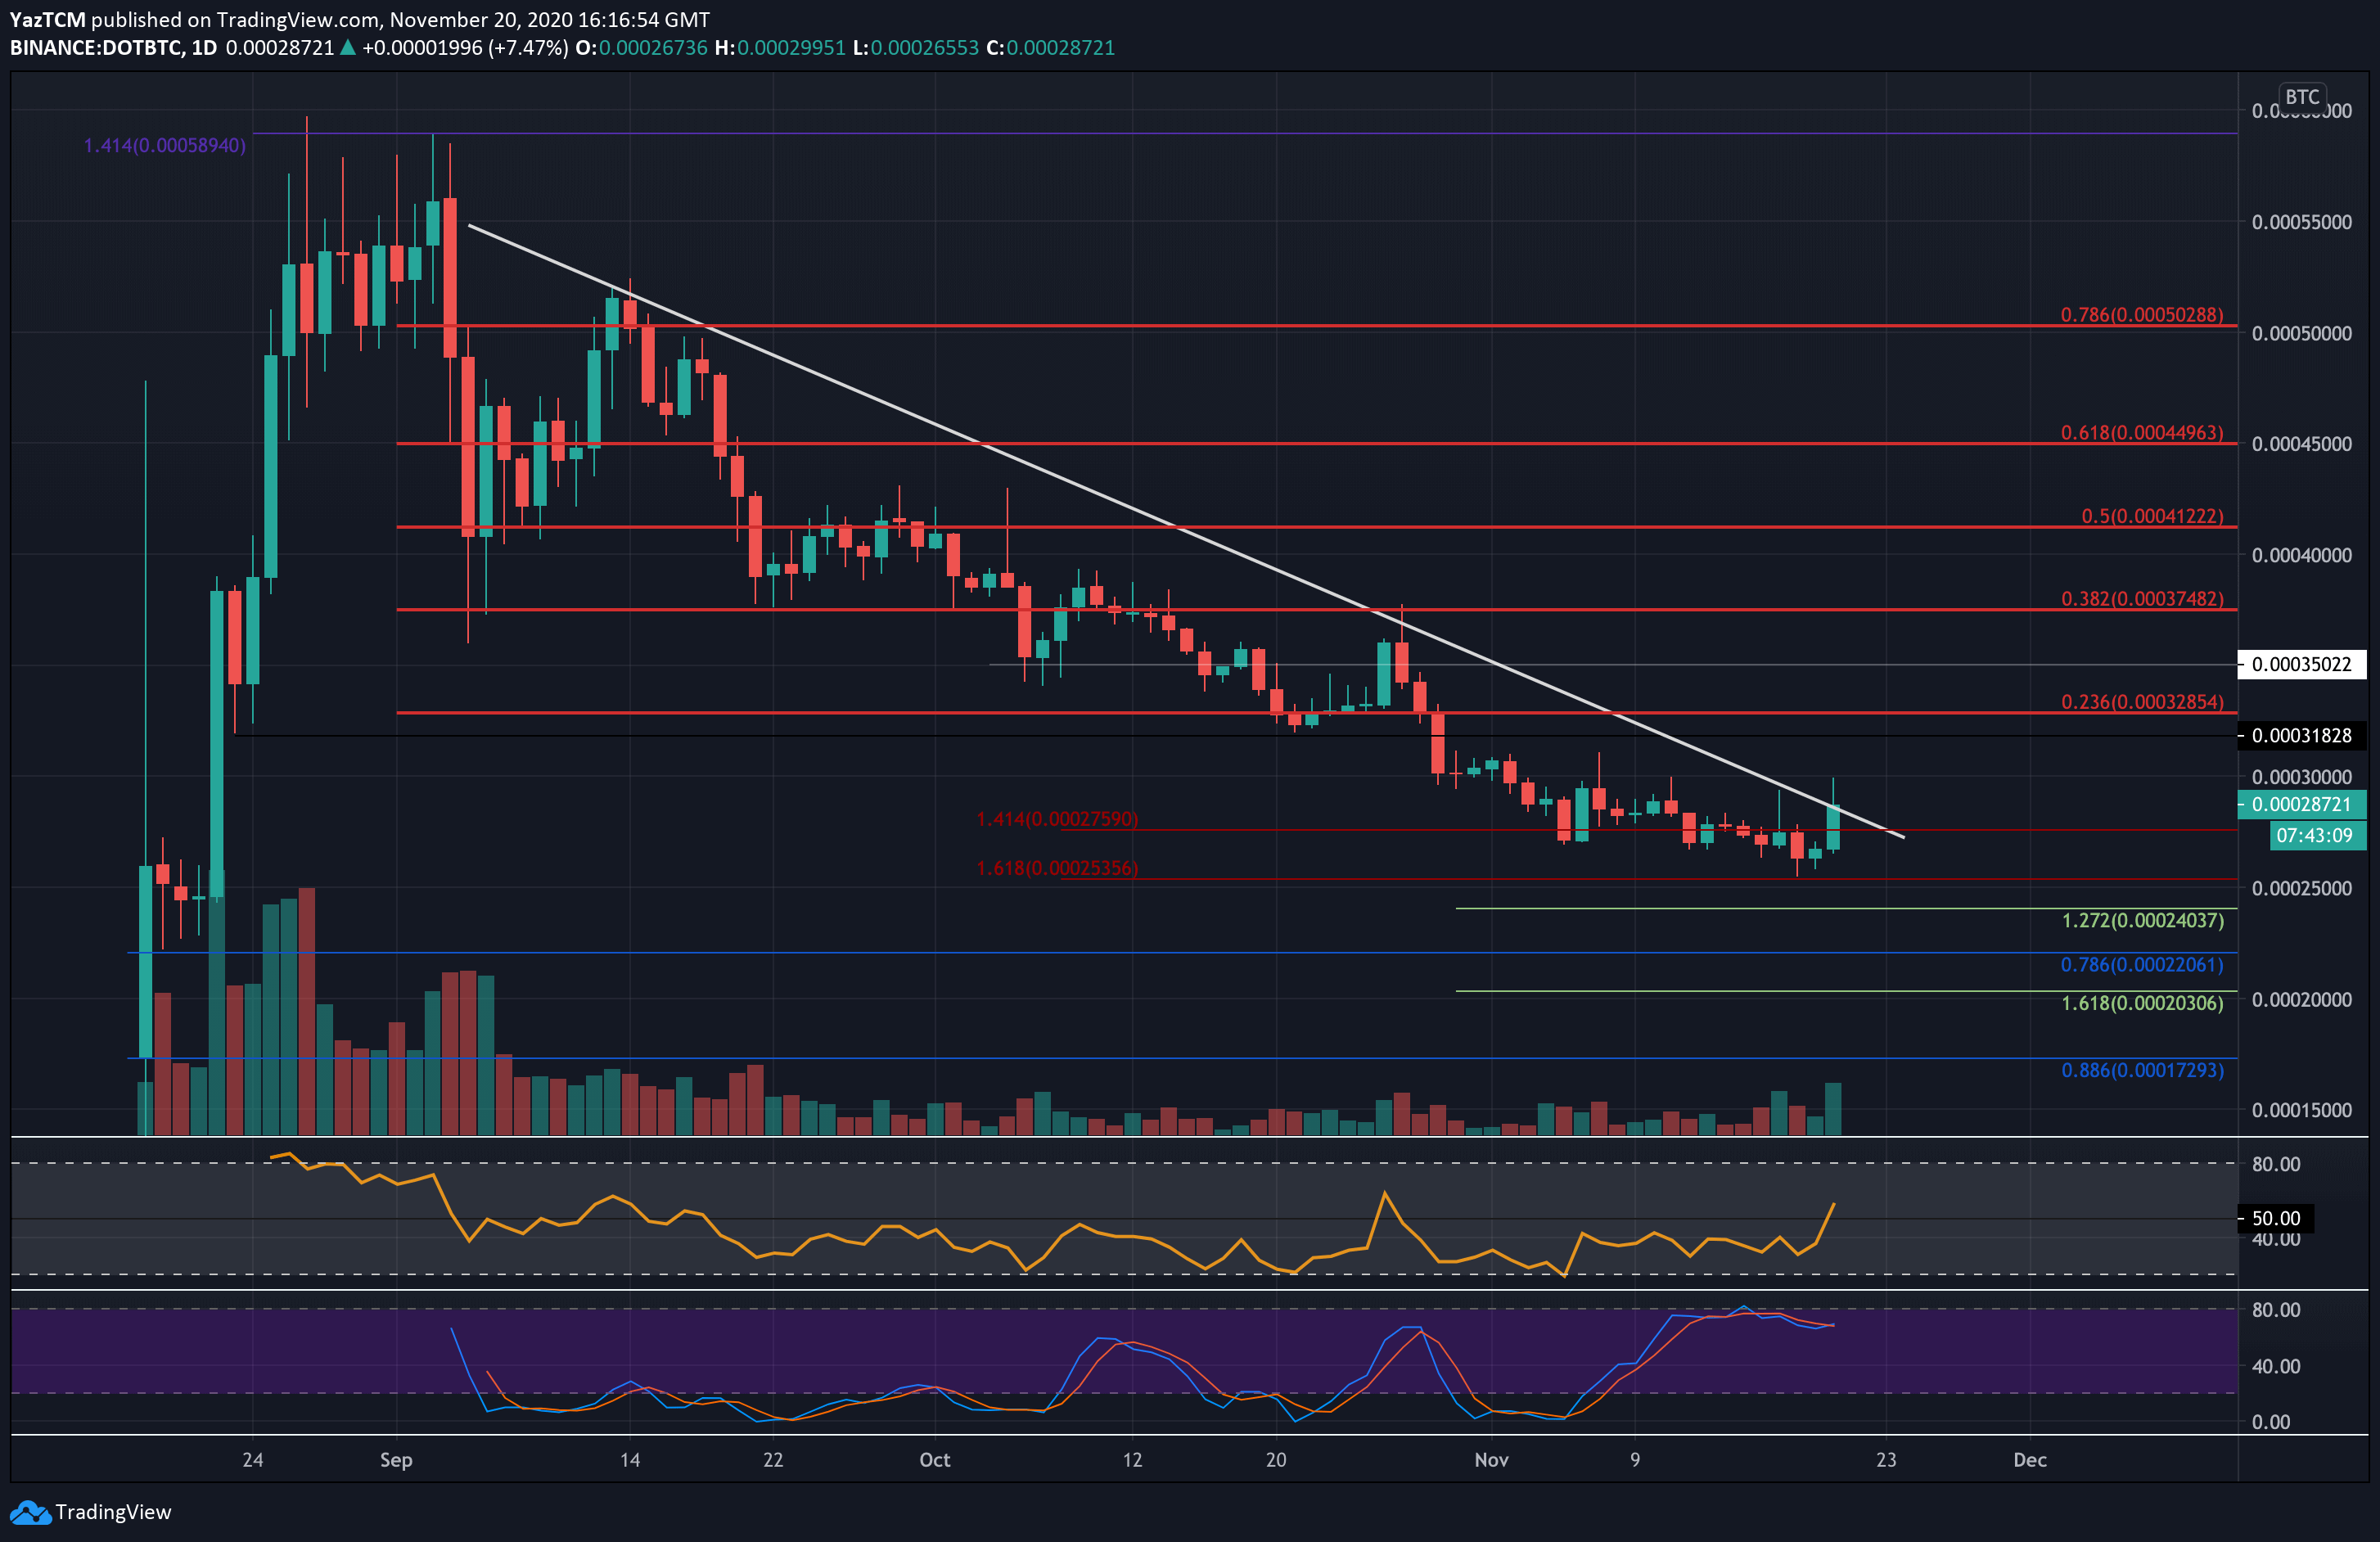
Against Bitcoin, DOT has been in a freefall since September. The coin recently fell into the support at 25,355 SAT (downside 1.618 FIb extension), which allowed the coin to rebound today. Regardless of the rebound, DOT remains trapped beneath a 3-month-old falling trend line and must pass this to start its recovery.
Moving forward, if DOT can break the trend line, the first level of resistance is expected at 30,000 SAT. Above this, resistance lies at 32,855 SAT (bearish .236 Fib), 35,000 SAT, and 37,480 SAT (bearish .382 Fib).
On the other side, the first level of support is expected at 27,590 SAT. Beneath this, support is found at 25,356 SAT (downside 1.618 Fib Extension), 24,000 SAT, and 22,060 SAT.
Disclaimer: Information found on CryptoPotato is those of writers quoted. It does not represent the opinions of CryptoPotato on whether to buy, sell, or hold any investments. You are advised to conduct your own research before making any investment decisions. Use provided information at your own risk. See Disclaimer for more information.
Cryptocurrency charts by TradingView.


