

Bitcoin
The trading range is between $3,800 – $4,000, where the resistance can also be found. Trading volume declined, which implies some fear in the market. The RSI is falling, and that is a positive sign that the rate is holding. However, it should be taken into account that breaking the support will lead to a support test around $3,700, from which there is no clear support for BTC price until the $3,300 area.

Ethereum
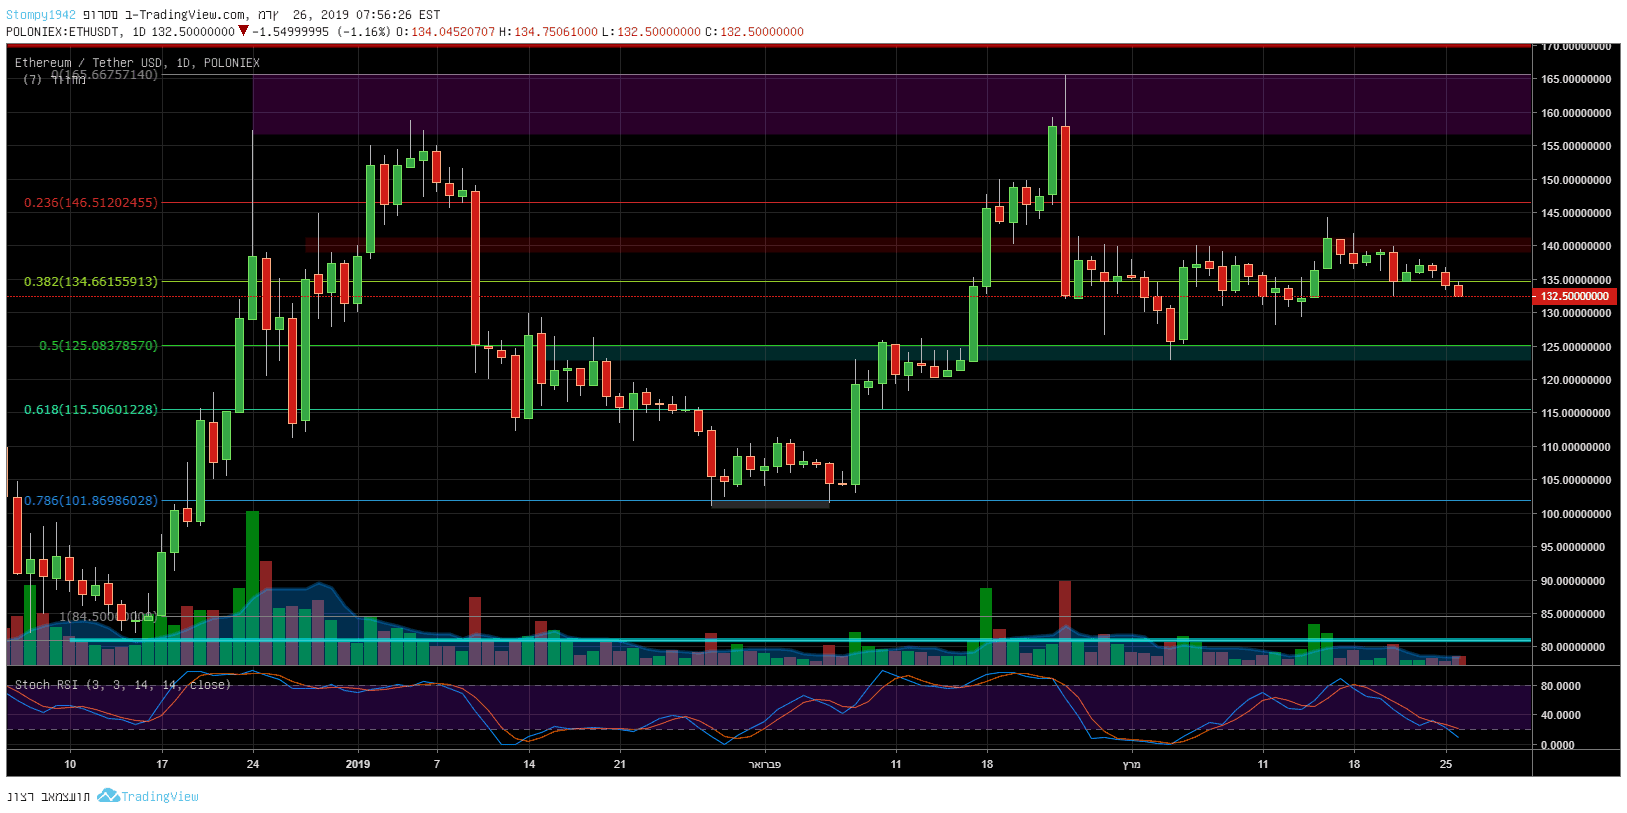
Against the dollar, the graph gets a double top pattern and support holds around $130, up $5 from last week. Resistance around $140 in a positive trend.
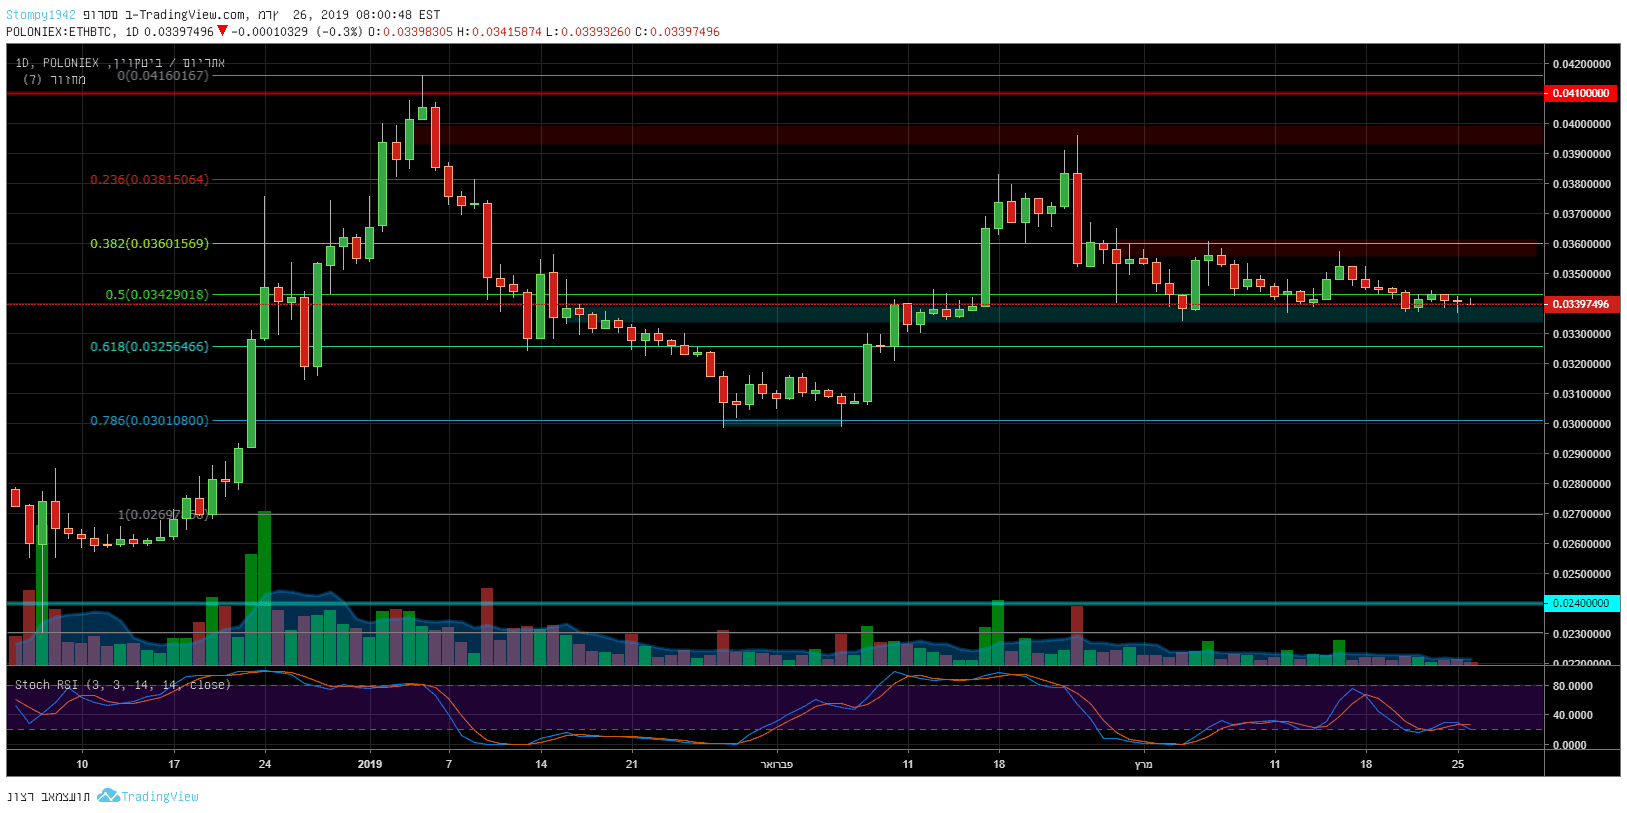
Against Bitcoin things have not changed much in the past week, the resistance is around 0.036BTC and the support at 0.033BTC. Here, too, it seems that the trading volume moved to the Alts’ party where prices show massive gains. But, past experience shows that when the realizations begin, the money returns to Bitcoin and/or to relatively stable Alts such as Ethereum.
Litecoin
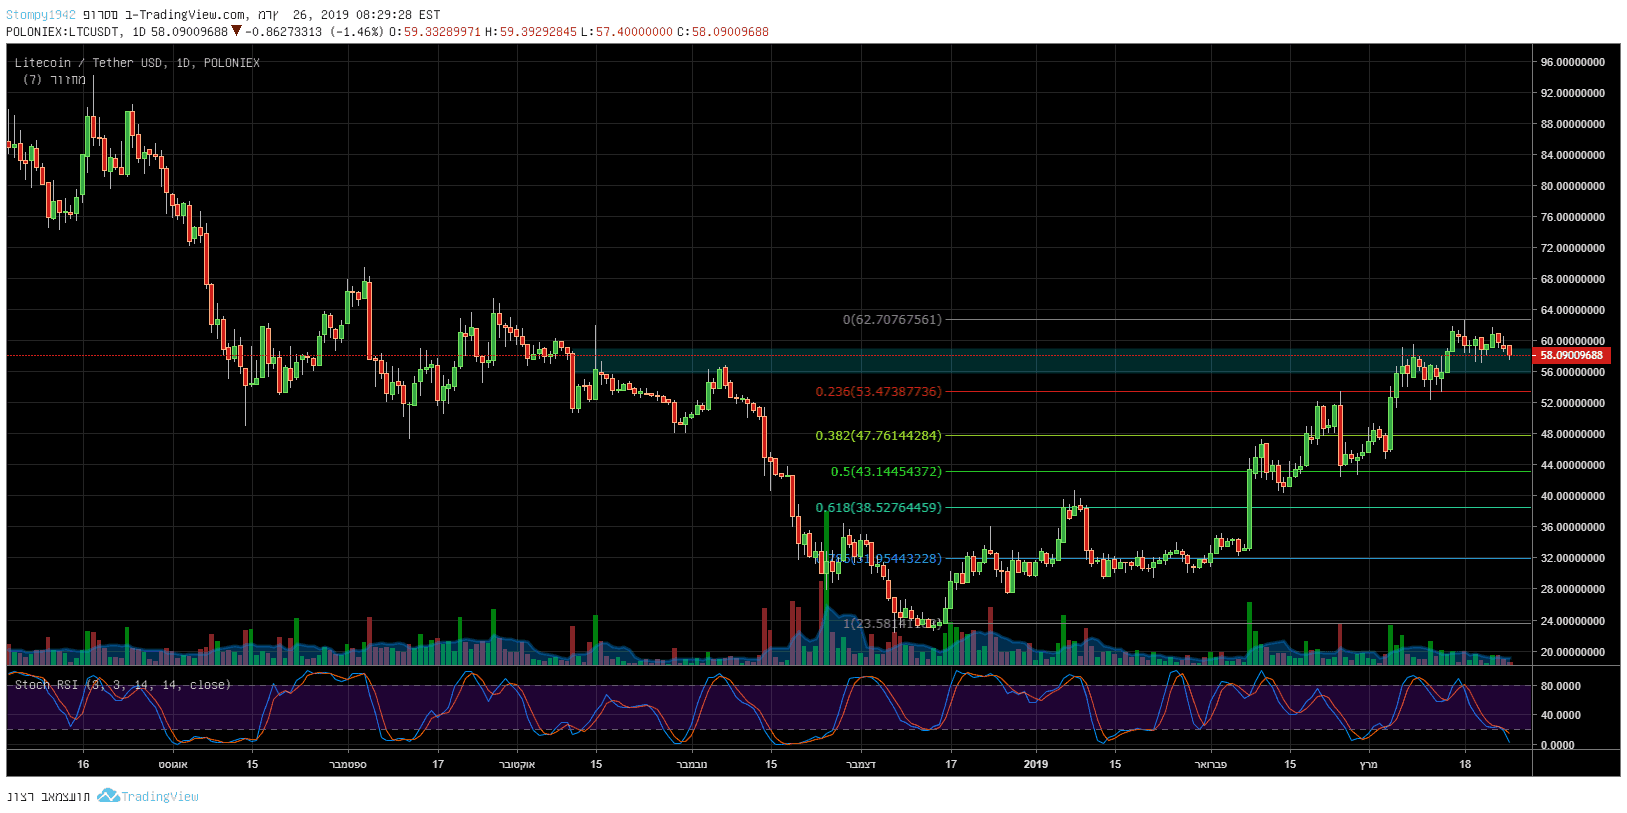
Against the dollar, it is possible to take Litecoin as an example of what is happening in the market. The graph says it all, and since the beginning of February Litecoin has been the first to identify the current Alts season, and we seem to have reached the level of resistance from which a break out will indicate a real trend change, and in this sense, the market is waiting for approval from Litecoin. Support at $50, resistance at $60 and subsequent resistance levels at $80.
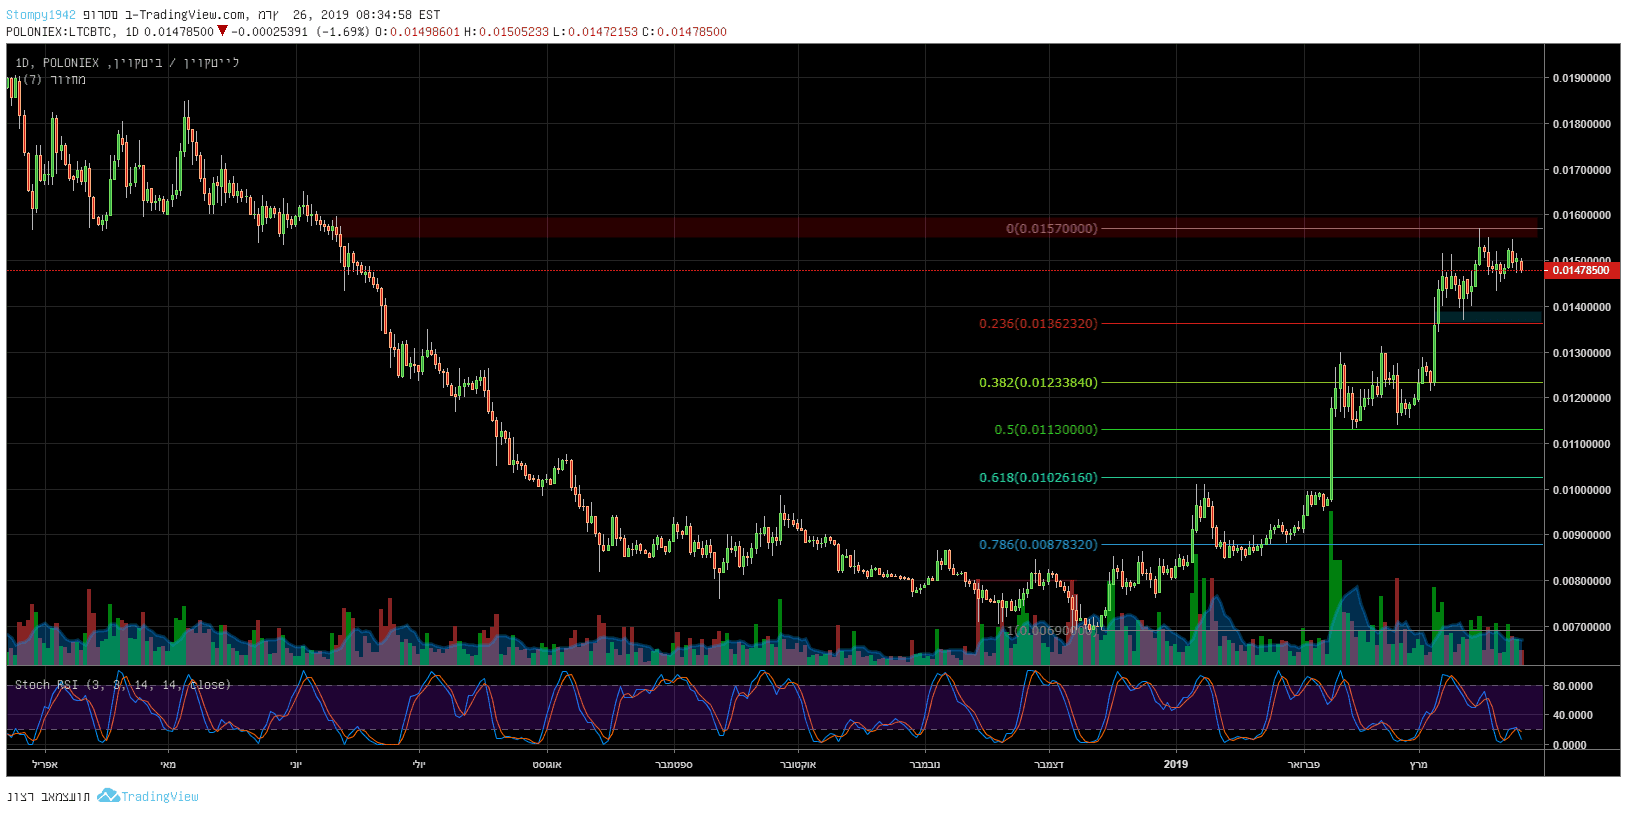
Against Bitcoin, we returned to the point from which the June 2017 rises began, and since then the correction has been continuous, and the RSI is low. Support this range at 0.0136BTC and resistance around 0.0156BTC.
Ripple
Against the dollar, a sharp decline in RSI and a return to support marked around $0.29, raising concern that the December floor at $0.28 is close. Resistance in this range is around $0.32.
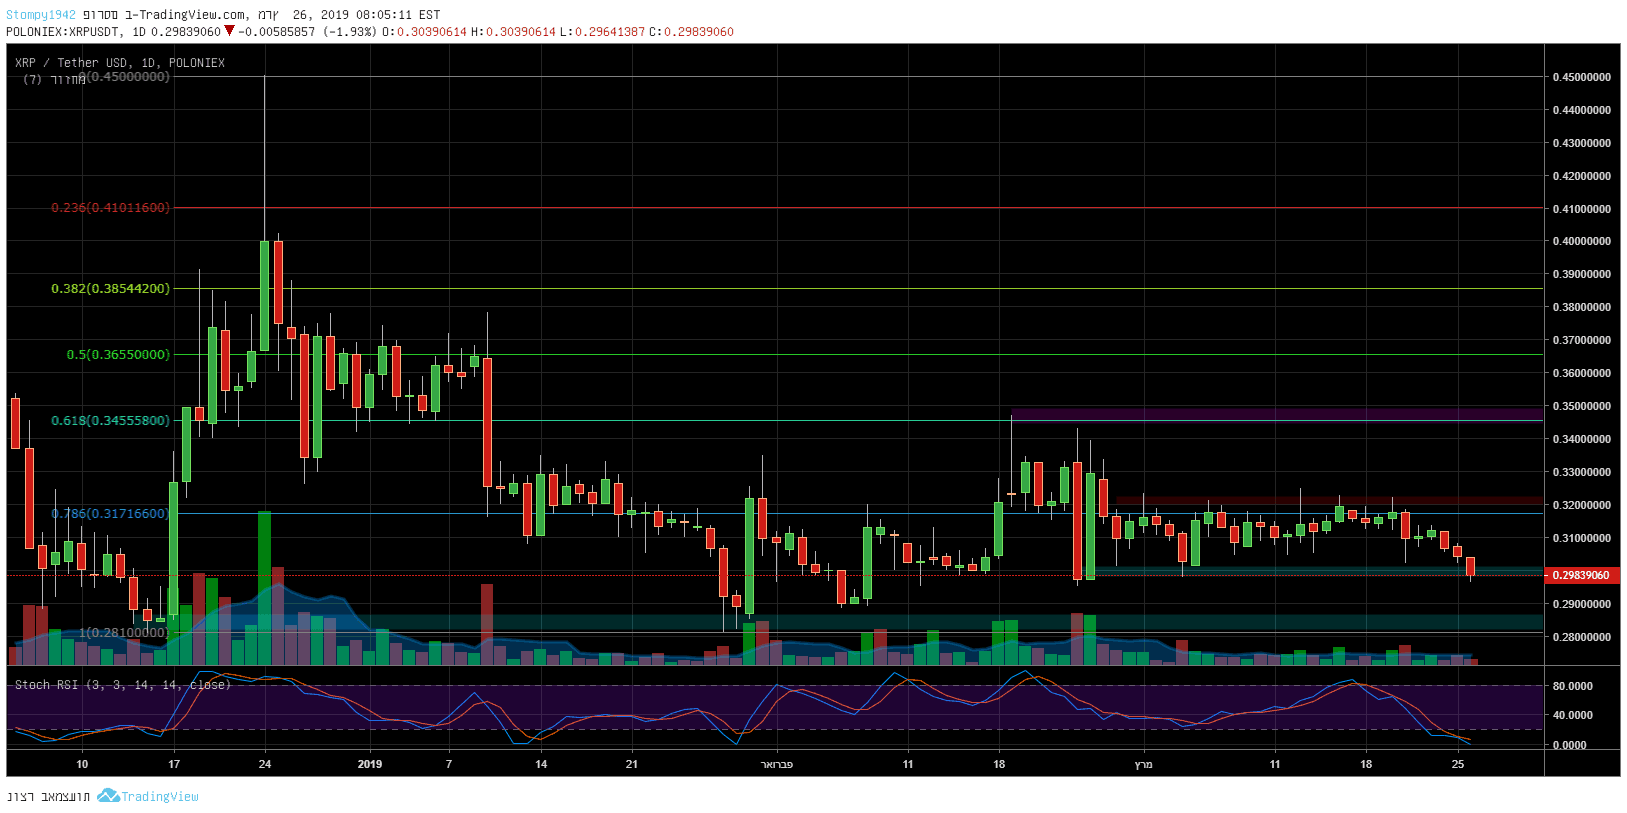
Against Bitcoin, the RSI has also dropped, and the support around the 8,000SAT that has been in place since December has broken down and turned into resistance. The next levels of support are around 7200 .SAT.

EOS
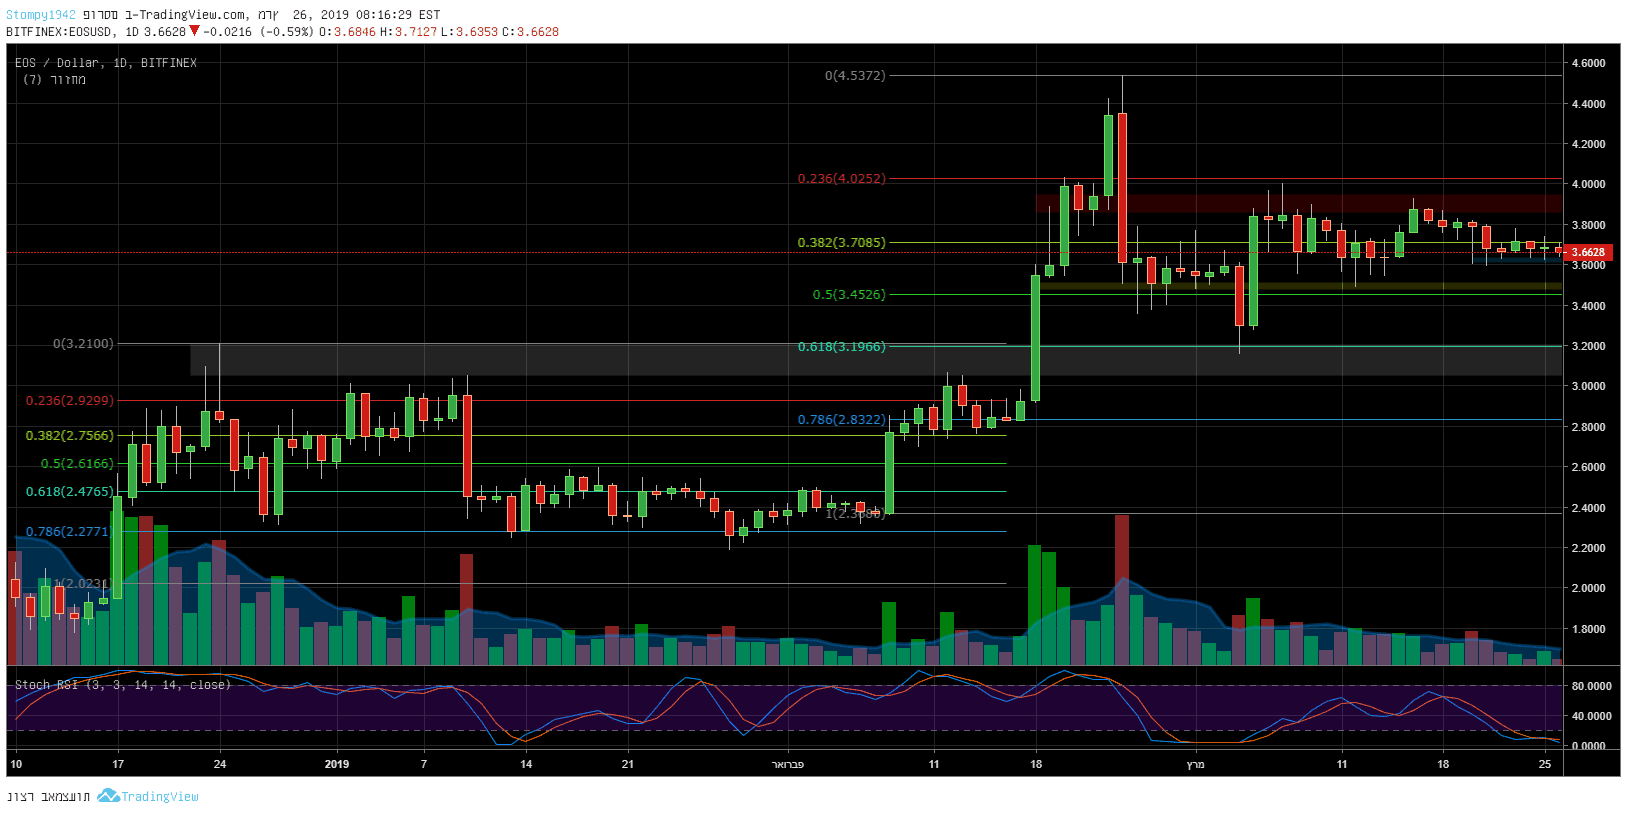
Against the dollar, the graph appears to be relatively bullish and builds up a strong trend. Resistance levels currently mark high demand and strong support around $3.5, resistance in this range at $3.9. If this resistance is breached, the next levels will be around $4.5.
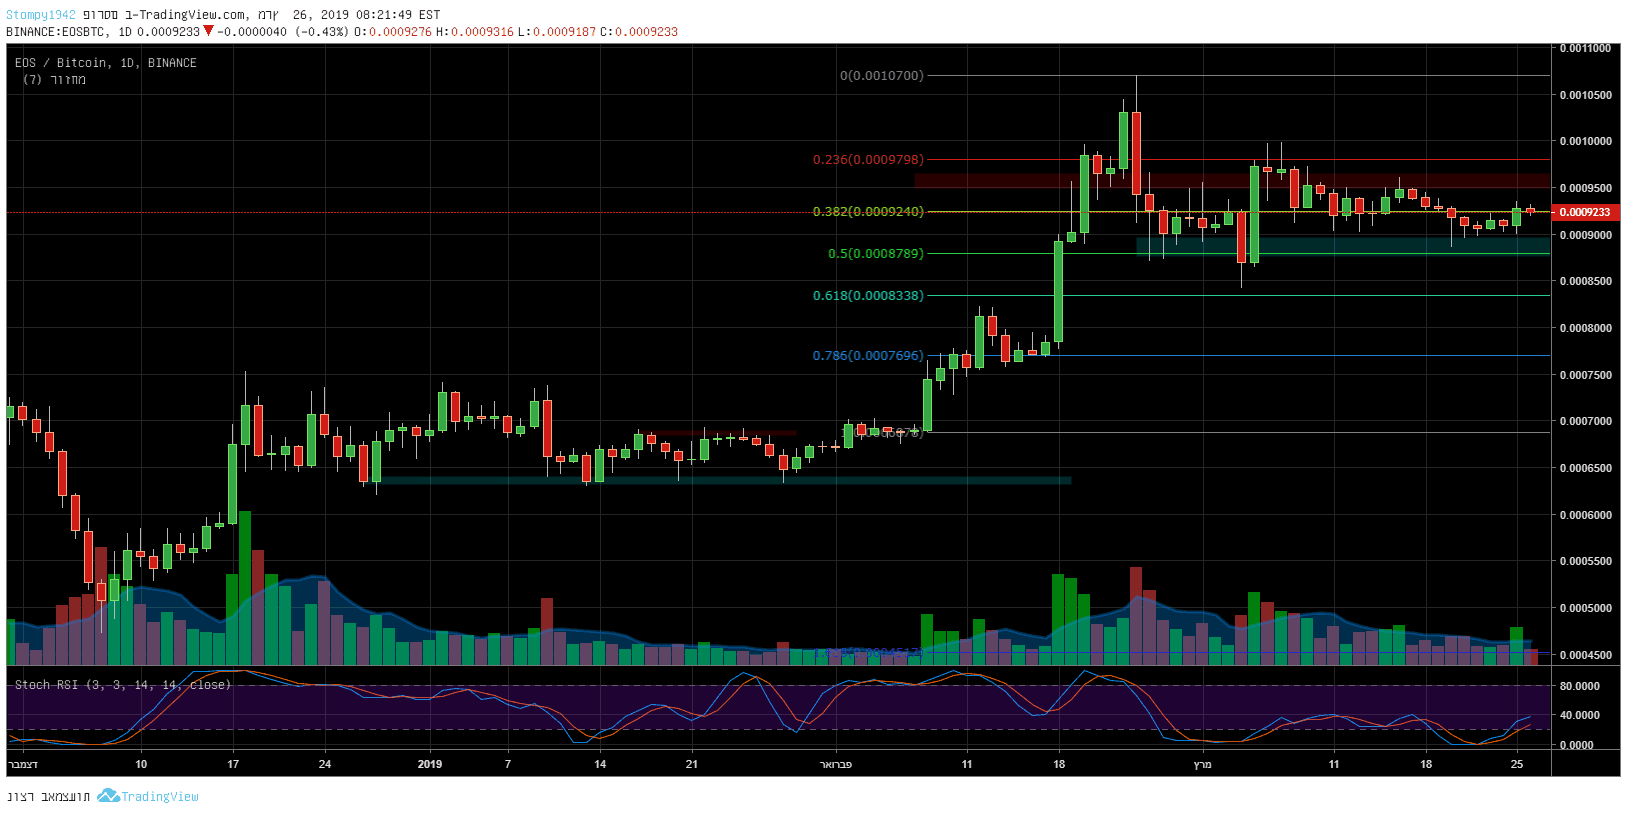
Against Bitcoin, it is technically similar to what happens in the dollar. Support around 0.00088BTC in the previous test of support in this range seems to be a little fragile to 0.00084BTC. Resistance at 0.00095BTC if the following levels break out at 0.001BTC.
Disclaimer: Information found on CryptoPotato is those of writers quoted. It does not represent the opinions of CryptoPotato on whether to buy, sell, or hold any investments. You are advised to conduct your own research before making any investment decisions. Use provided information at your own risk. See Disclaimer for more information.
Cryptocurrency charts by TradingView.


