

Bitcoin
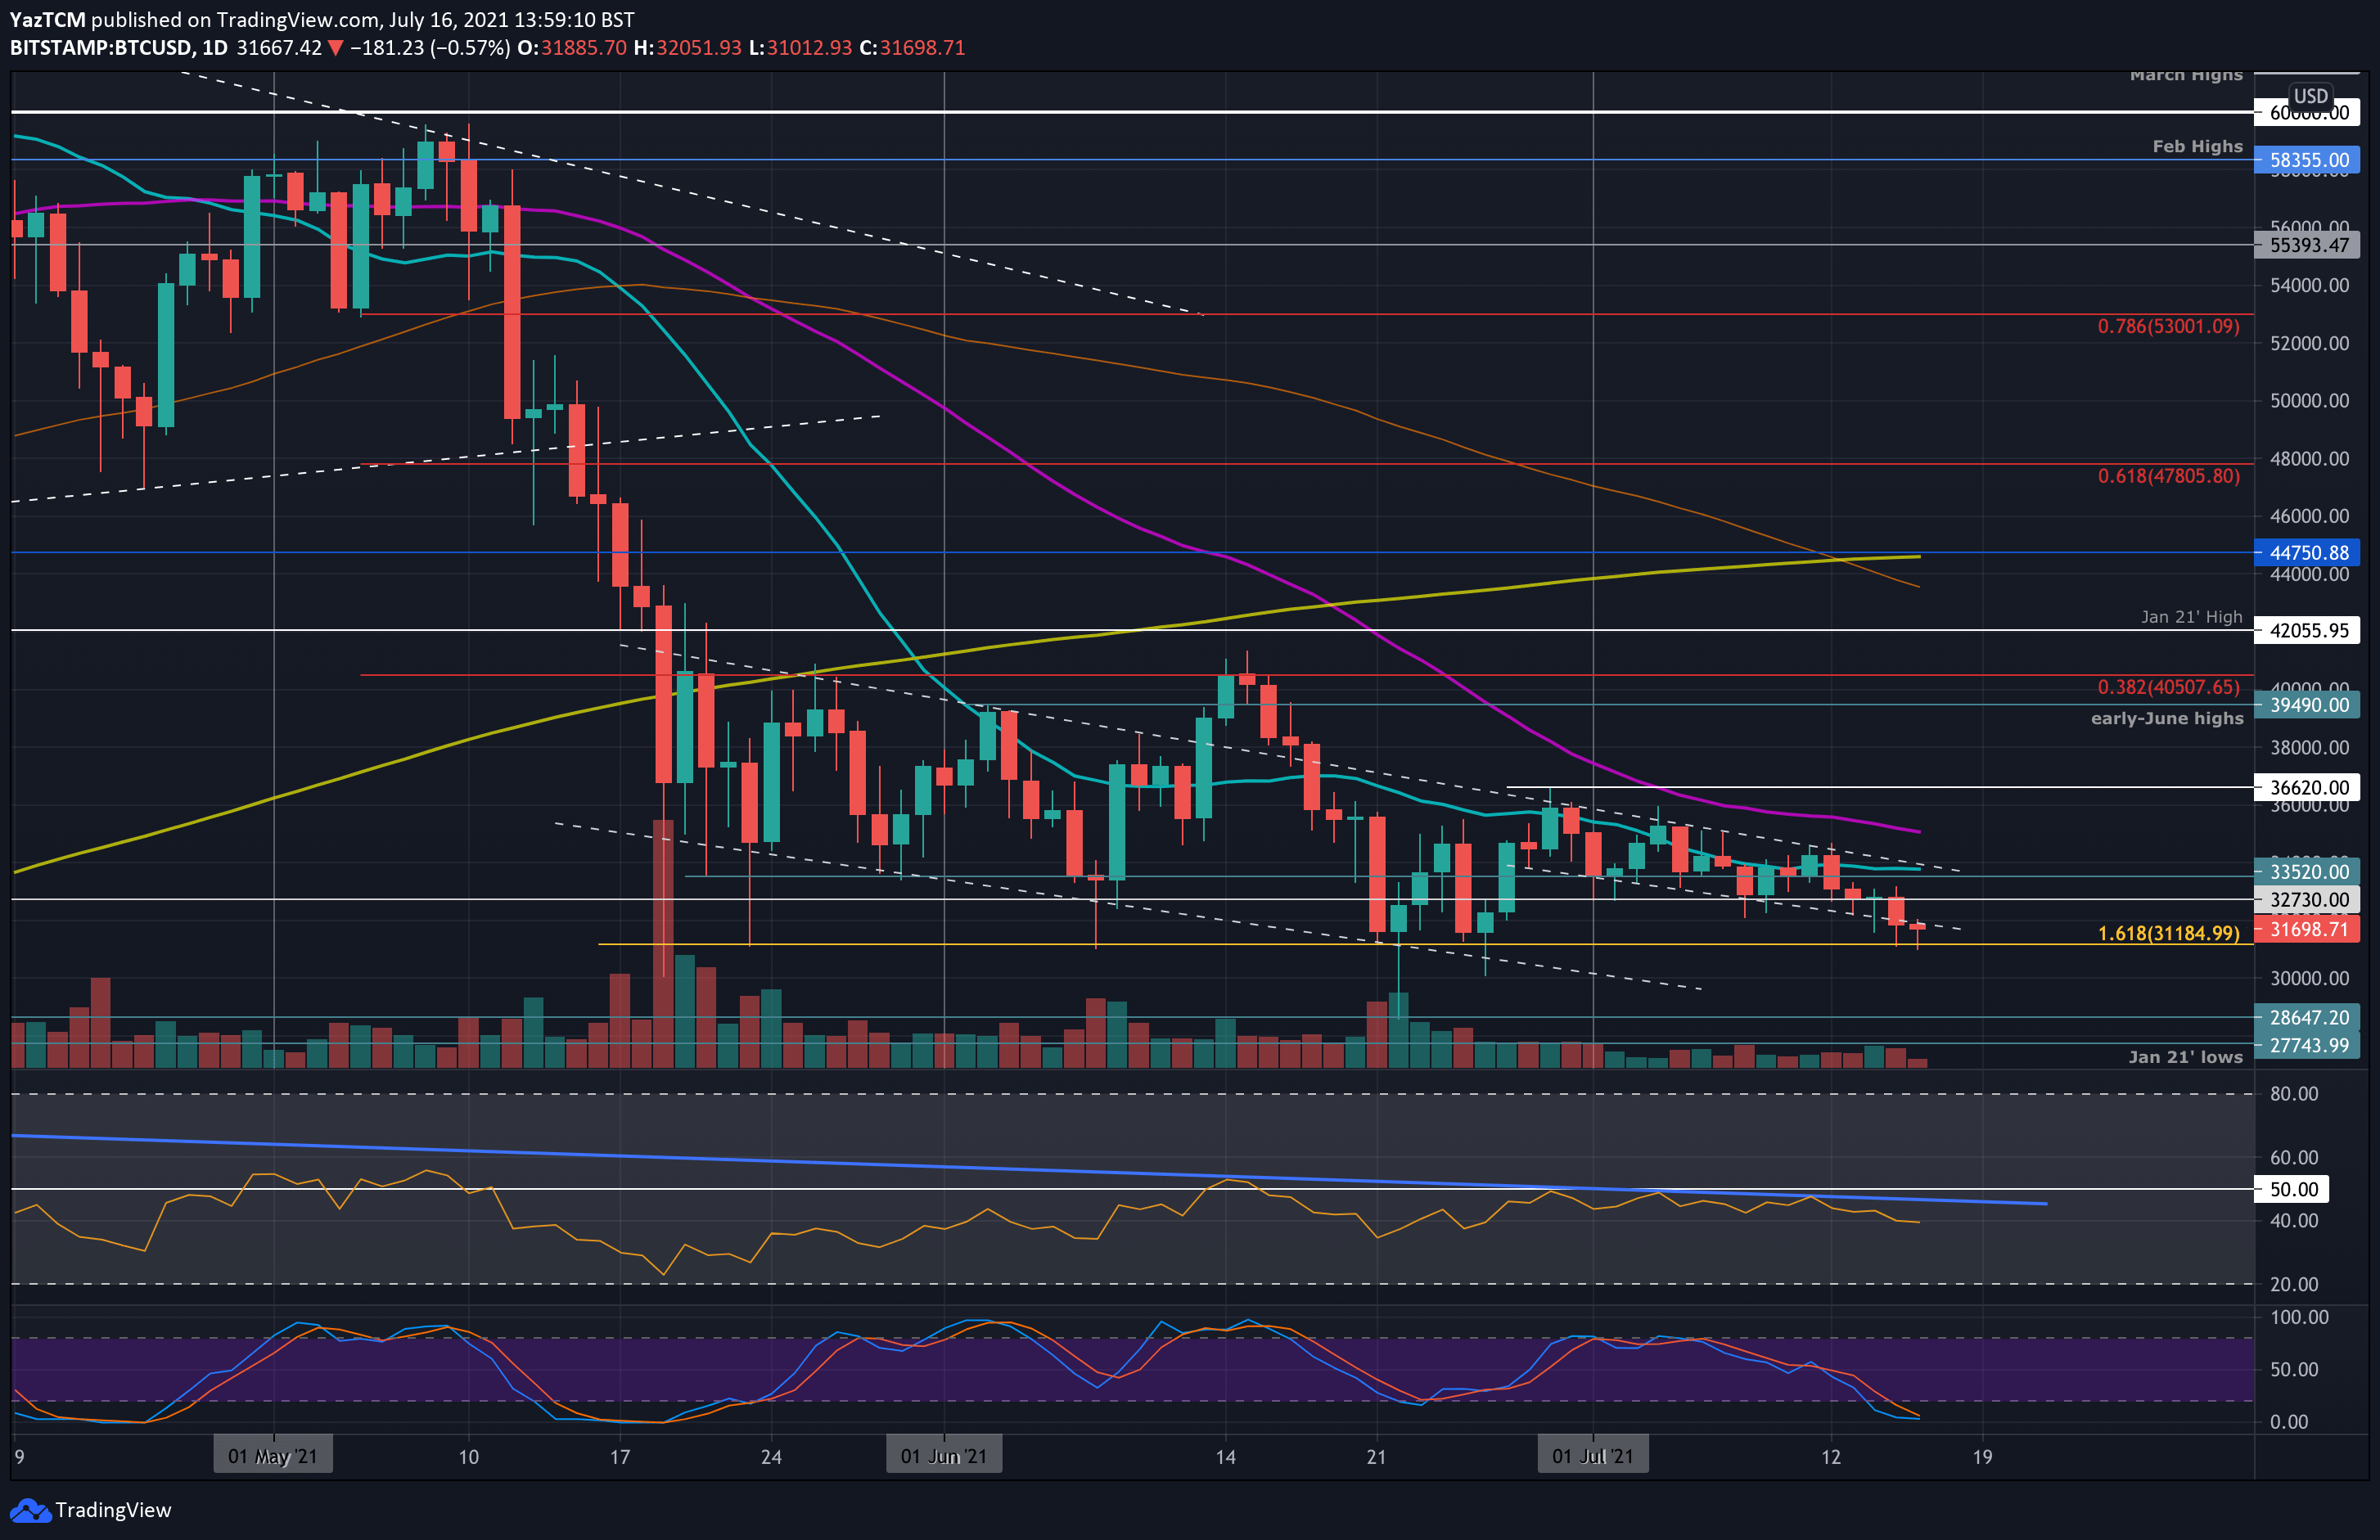
Bitcoin dropped by 3% this week, reaching as low as $31,000. The cryptocurrency popped above the 20-day MA on Sunday but quickly reversed and dropped beneath it on Monday.
It found support mid-week at $32,700 but continued beneath there yesterday to reach $31,185 (downside 1.618 Fib Extension) today.
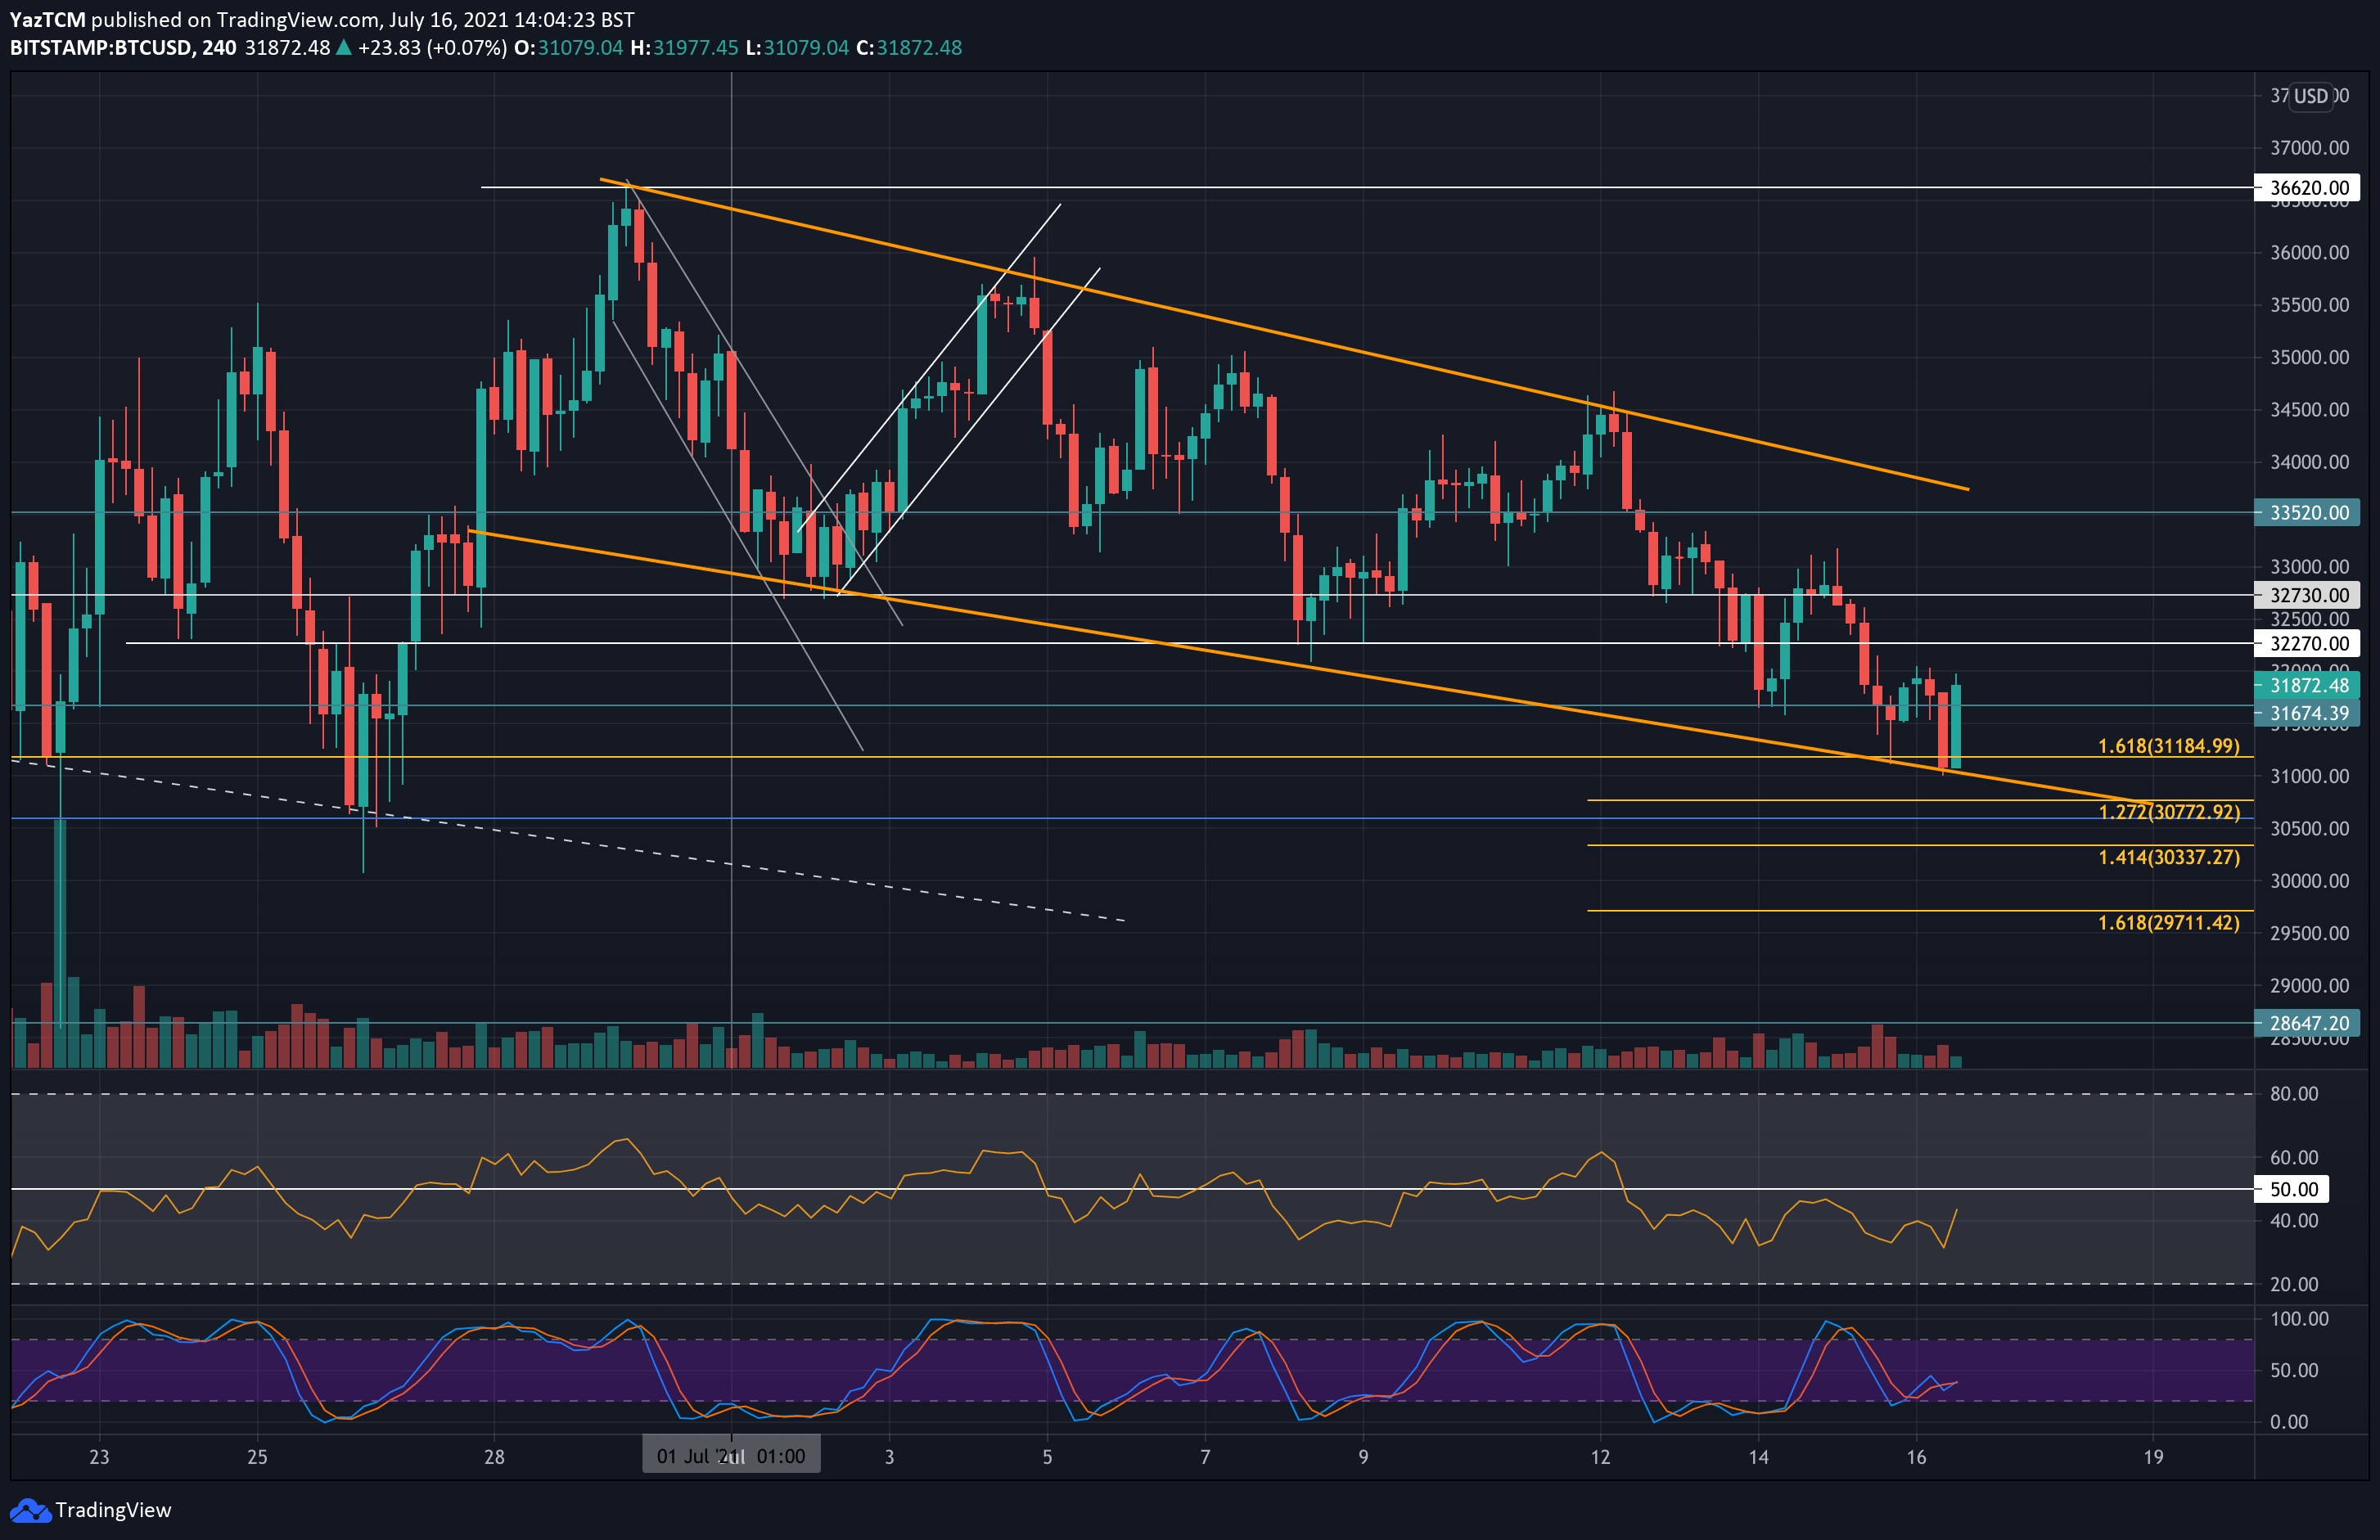
The short-term chart provides a closer perspective of what is going on. It shows BTC trading inside a falling price channel since the start of July. When BTC broke the 20-day MA on Sunday, it found resistance at the upper angle of the price channel and started to head lower.
Today, BTC hit the support at the lower angle of this price channel and the buyers are attempting to defend it. As a result, they have rebounded aggressively and are pushing higher.
Looking ahead, the first resistance lies at $32,300 This is followed by $32,700 and $33,520-$33,800 (20-day). Next, resistance lies at the upper angle of the price channel and then at $35,00 (50-day MA).
On the other side, the first support lies at $31,675. This is followed by $31,185, $31,000 (lower angle of the price channel), $30,500, $30,000, and $29,700 (downside 1.618 Fib Extension).
Ethereum
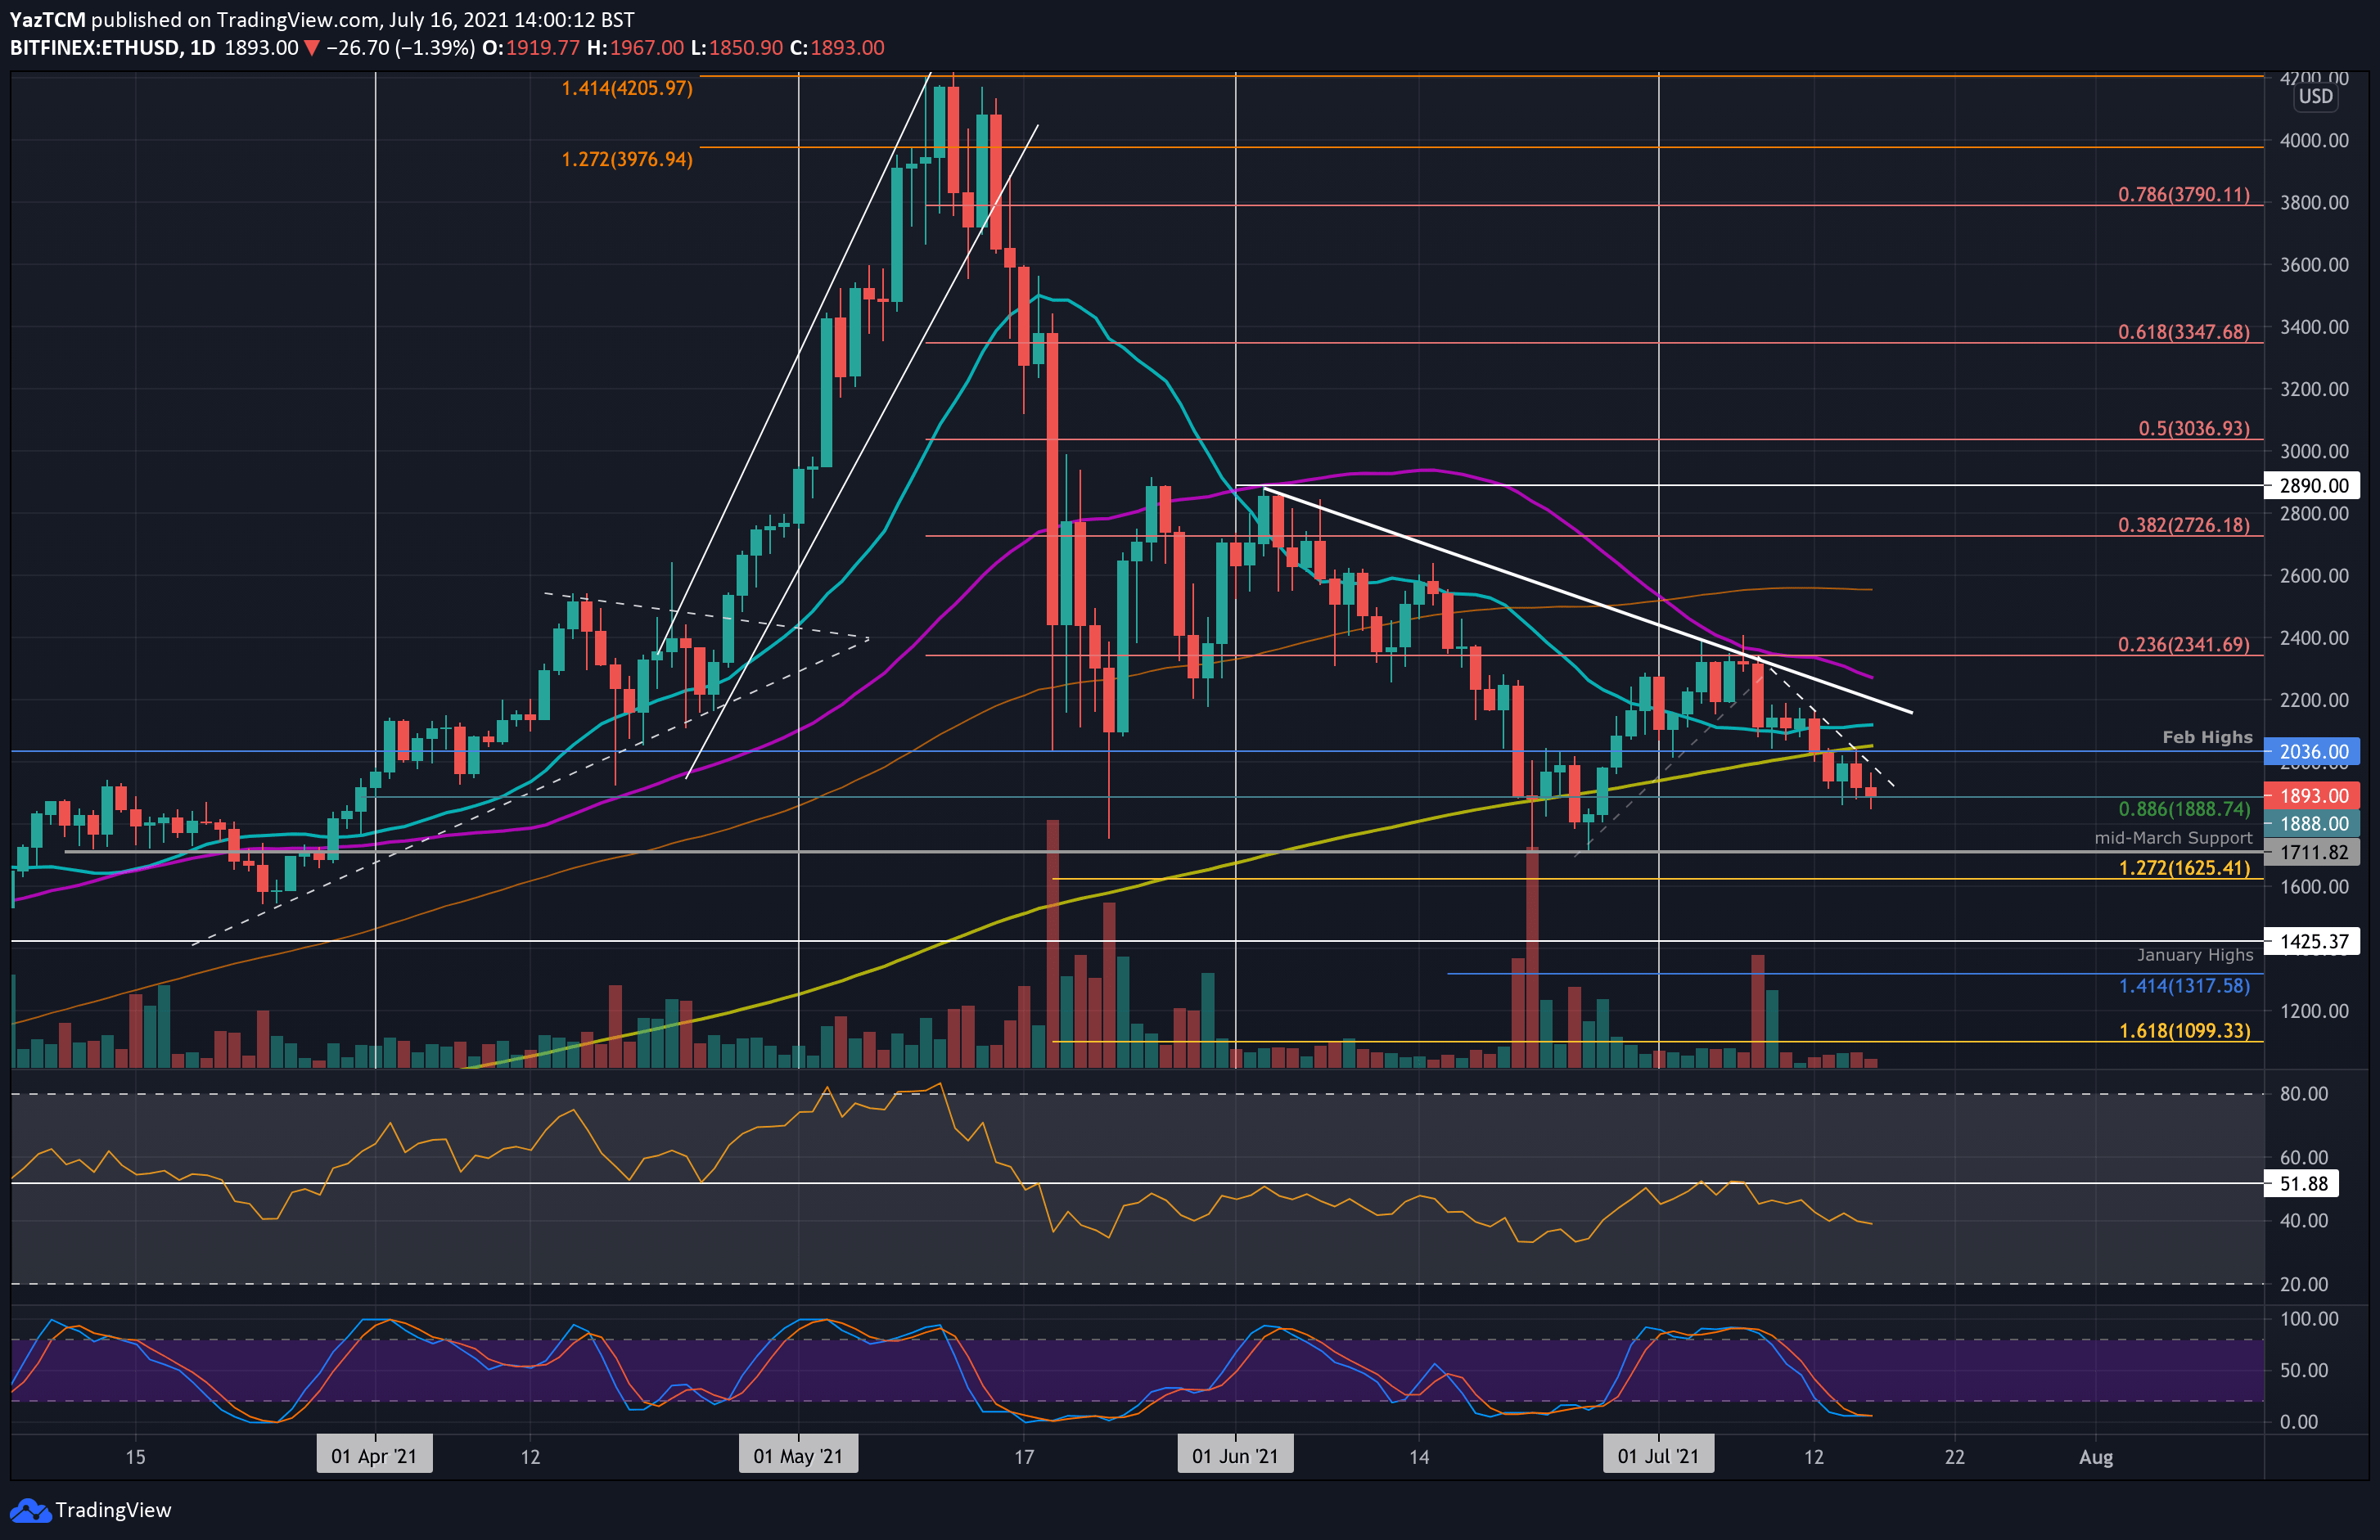
Ethereum is down by a very sharp 10% this week as it reached as low as $1850. The coin fell beneath the 20-day MA on Monday and dropped into the support at $2035 (Feb 2020 Highs). It continued lower on Tuesday to drop beneath the 200-day MA and fell until finding support today at $1888 (.886 Fib).
It did dip as low as $1850 today, but it seems that buyers are attempting to hold above $1888, which provided strong support in June.
Again, the 4-hour chart shows a better perspective of how ETH is trading – inside a falling wedge pattern, typically bullish once it breaks toward the upside.
Looking ahead, the first resistance lies at around $1950 (upside of the wedge). This is followed by $2000, $2035 (200-day MA), $2120 (20-day MA), and $2200 (long-term descending trend line).
On the other side, the first support lies at $1888. This is followed by $1850 (weekly low), $1710 (June support), and $1625 (downside 1.272 Fib Extension).

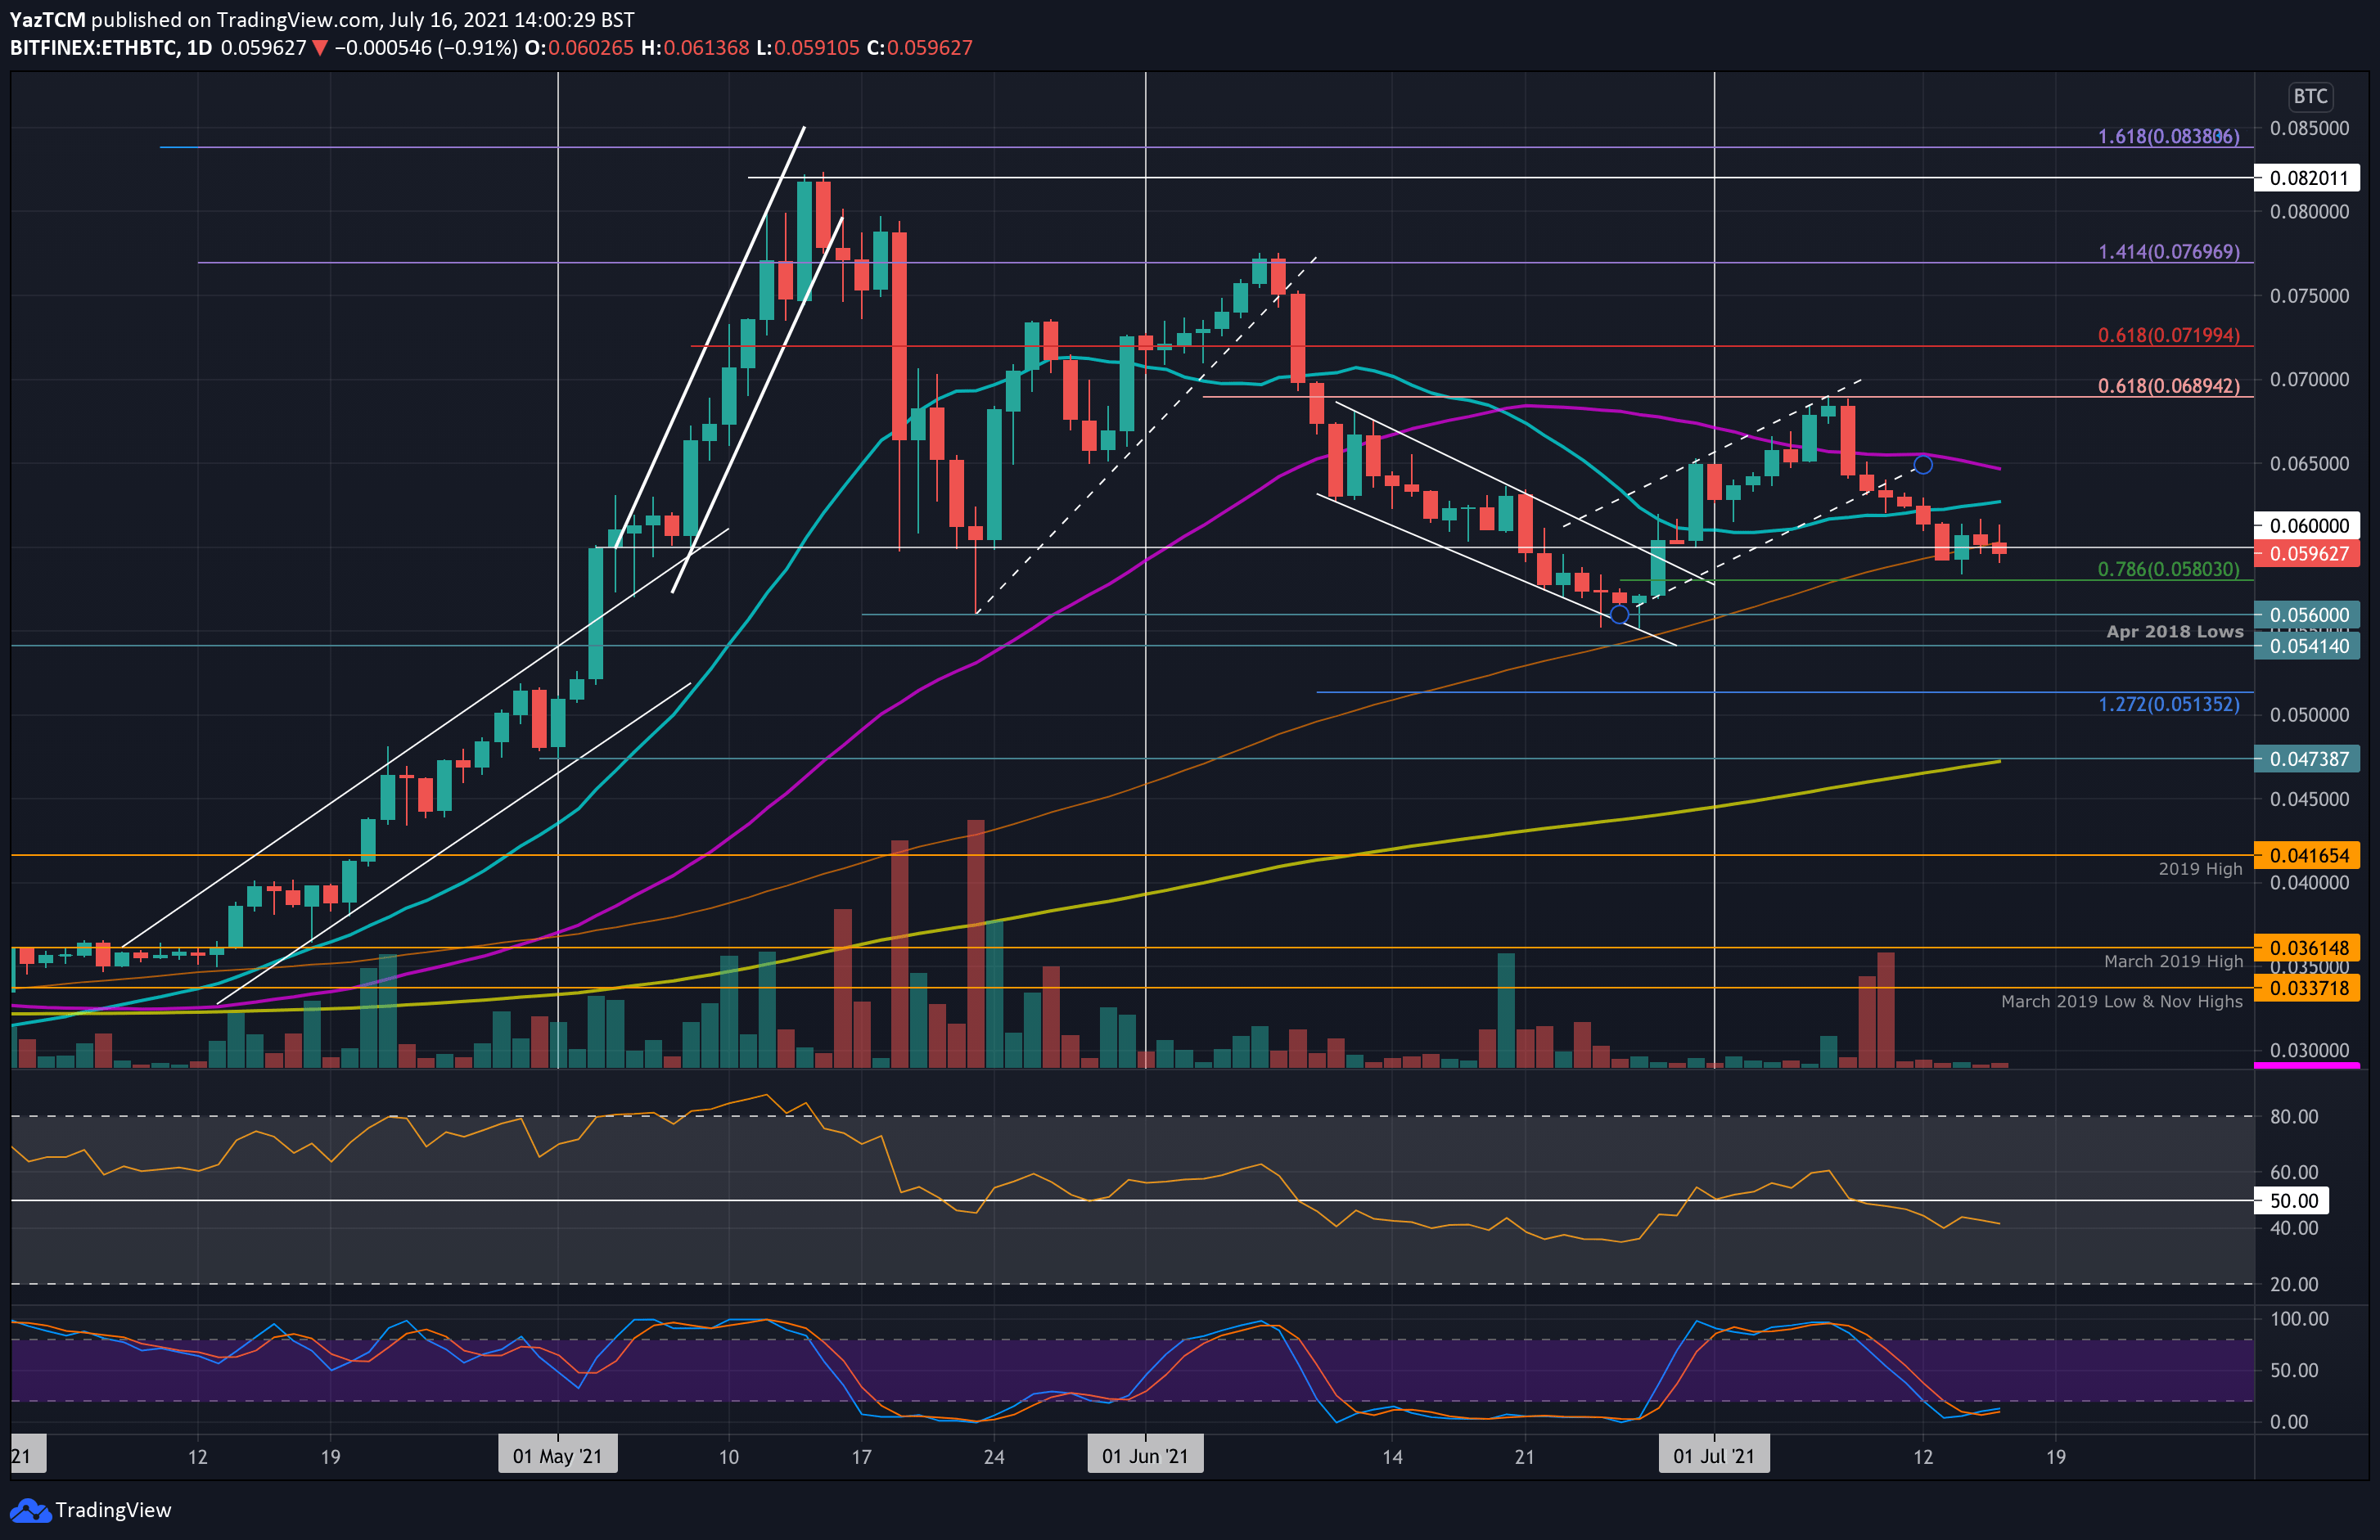
ETH is struggling against BTC after breaking beneath the support at 0.06 BTC (100-day MA) this week. The coin fell beneath an ascending price channel at the start of the week and started to head lower, reaching as low as 0.0584 BTC on Wednesday,
Looking ahead, the first resistance lies at 0.06 BTC (100-day MA). This is followed by 0.0627 BTC (20-day MA), 0.065 BTC (50-day MA), and 0.069 BTC (bearish .618 Fib & June Highs).
On the other side, the first support lies at 0.0585 BTC. This is followed by 0.058 BTC (.786 Fib), 0.056 BTC (June support), and 0.056 BTC.
Ripple
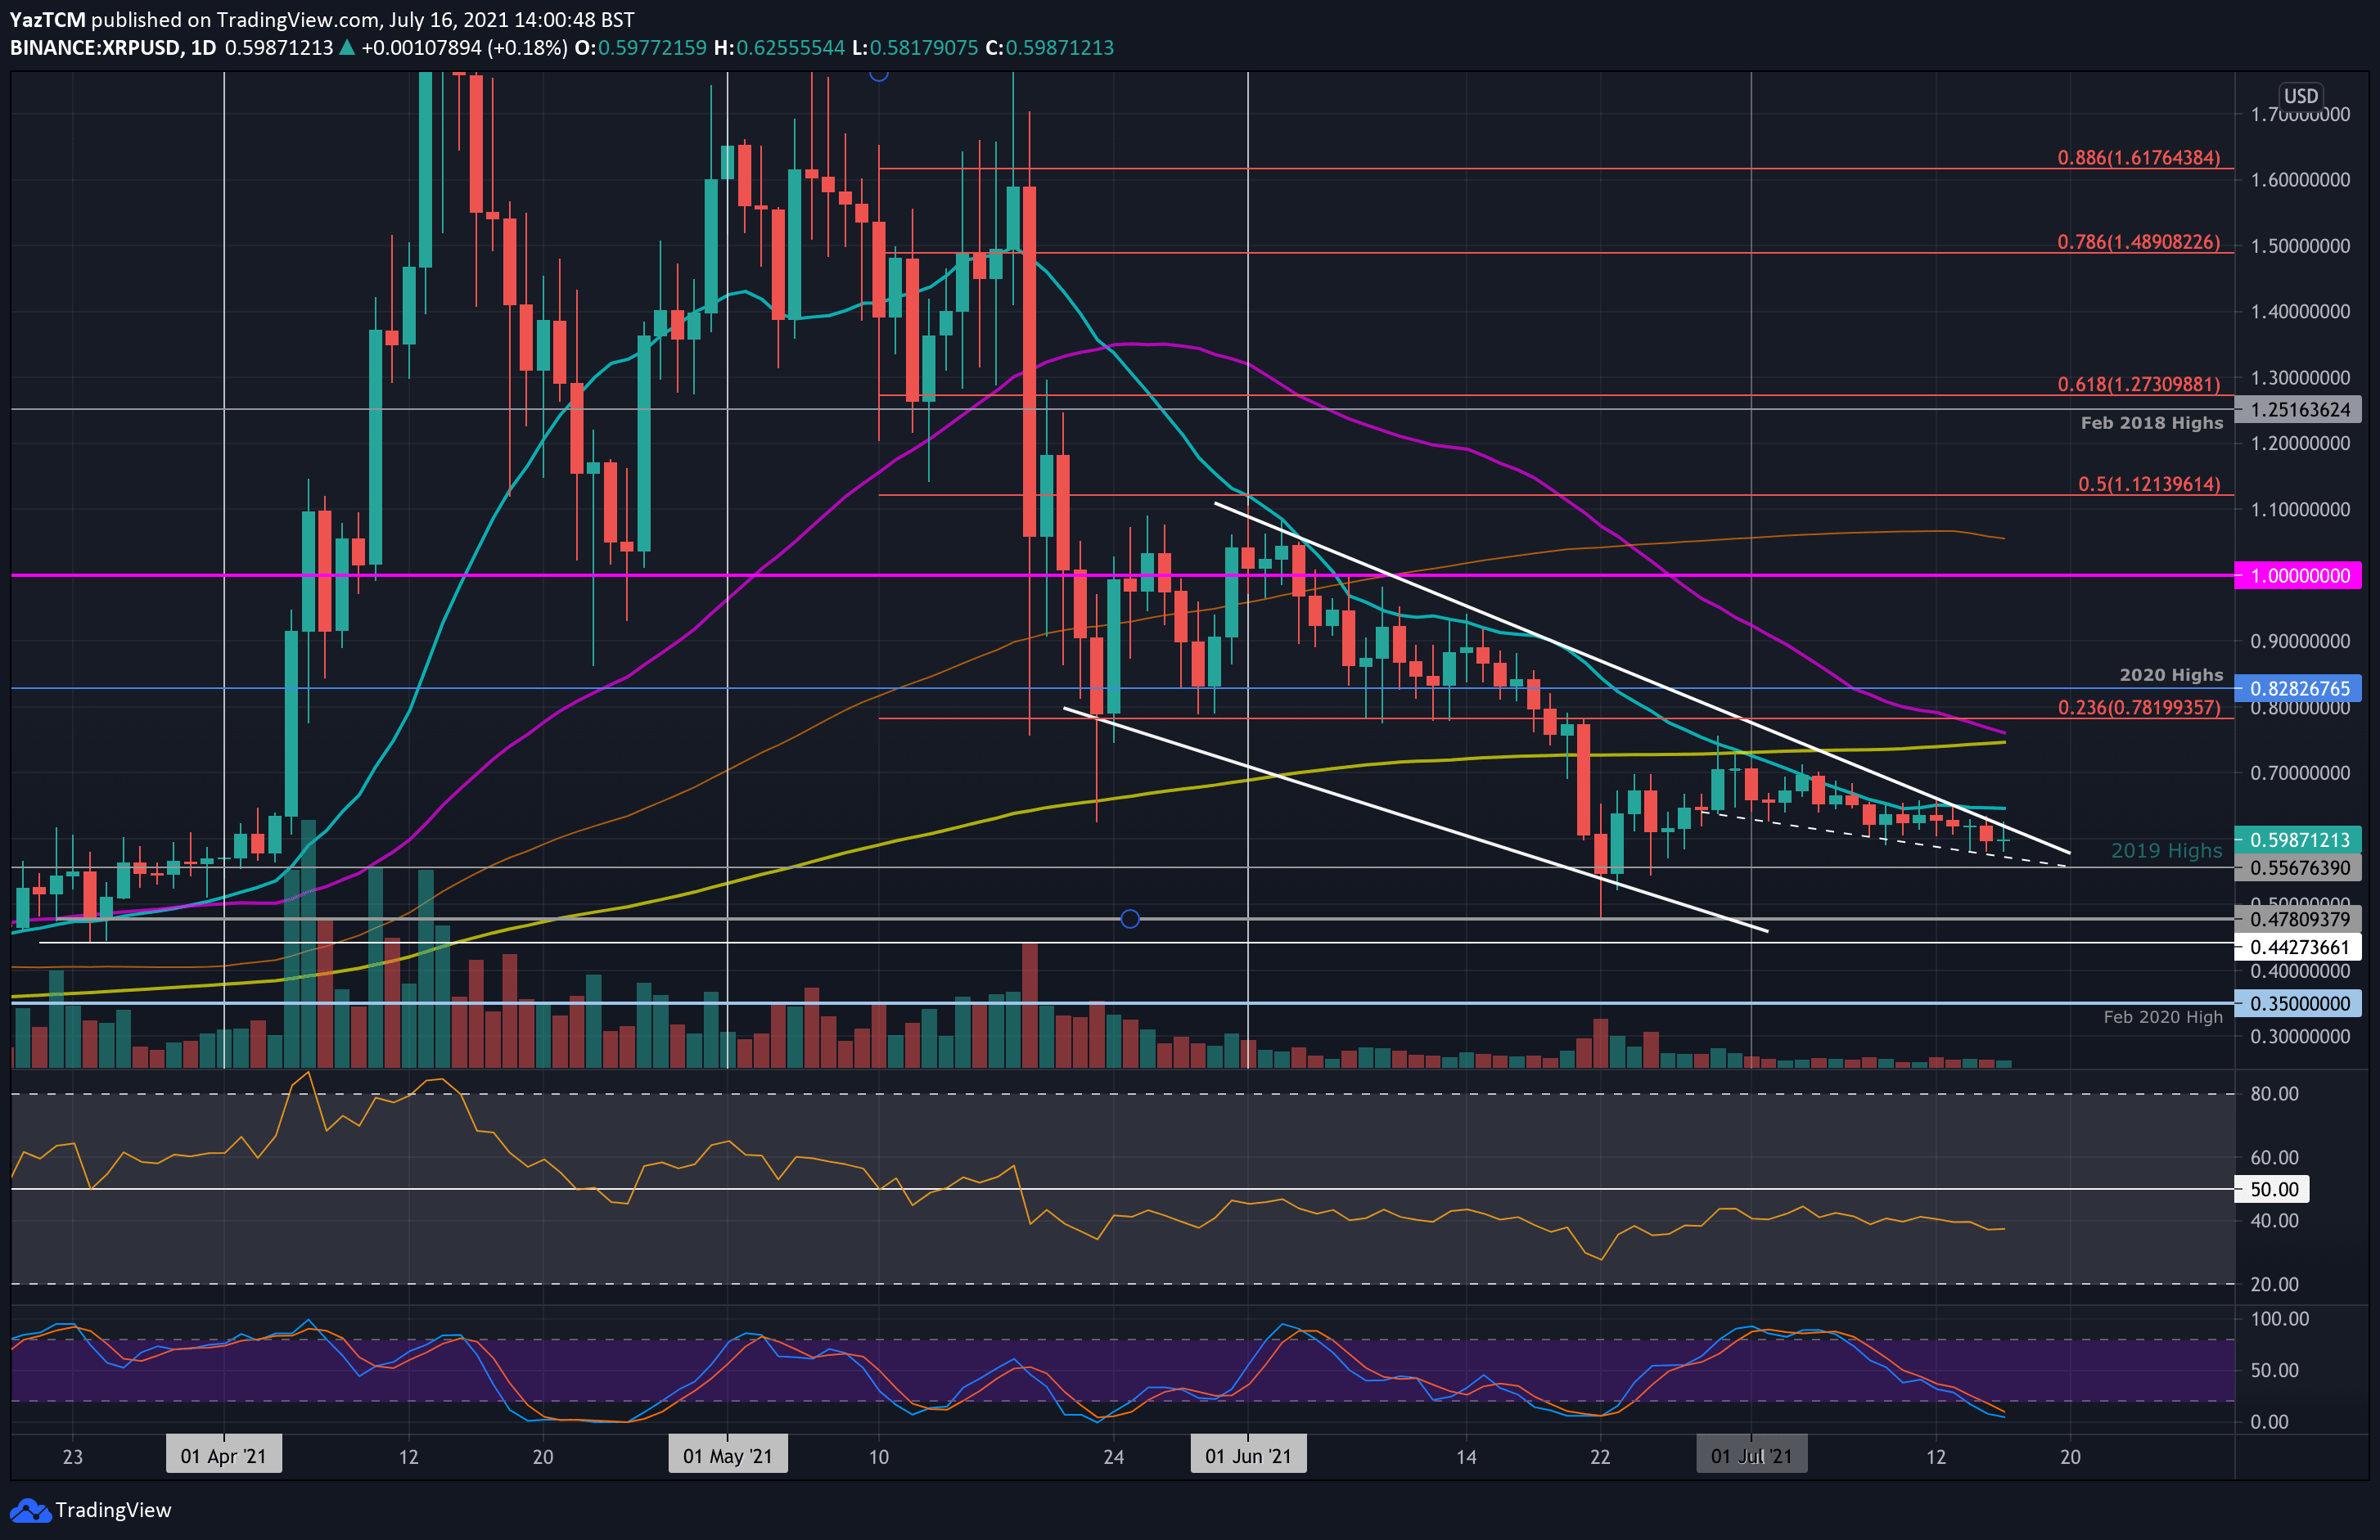
XRP fell by a total of 3.7% this week as it sits at around $0.6. The cryptocurrency has been trading inside a descending price channel since the start of July. Additionally, it has been trading inside a falling wedge since the start of June.
The coin attempting to break to the upside of the wedge during the week but failed on each attempt. However, it consistently found support at the lower angle of the wedge during the week.
A breakout to the upside is expected of this type of wedge pattern as XRP quickly approaches the apex.
Looking ahead, if the buyers can break the upside of the wedge, the first resistance lies at $0.647 (20-day MA). This is followed by $0.7 (July resistance) and $0.75 (200-day & 50-day MA confluence).
On the other side, the first support lies around $0.56 (lower angle of the wedge). This is followed by $0.55 (2019 highs), $0.5, and $0.478 (July lows).
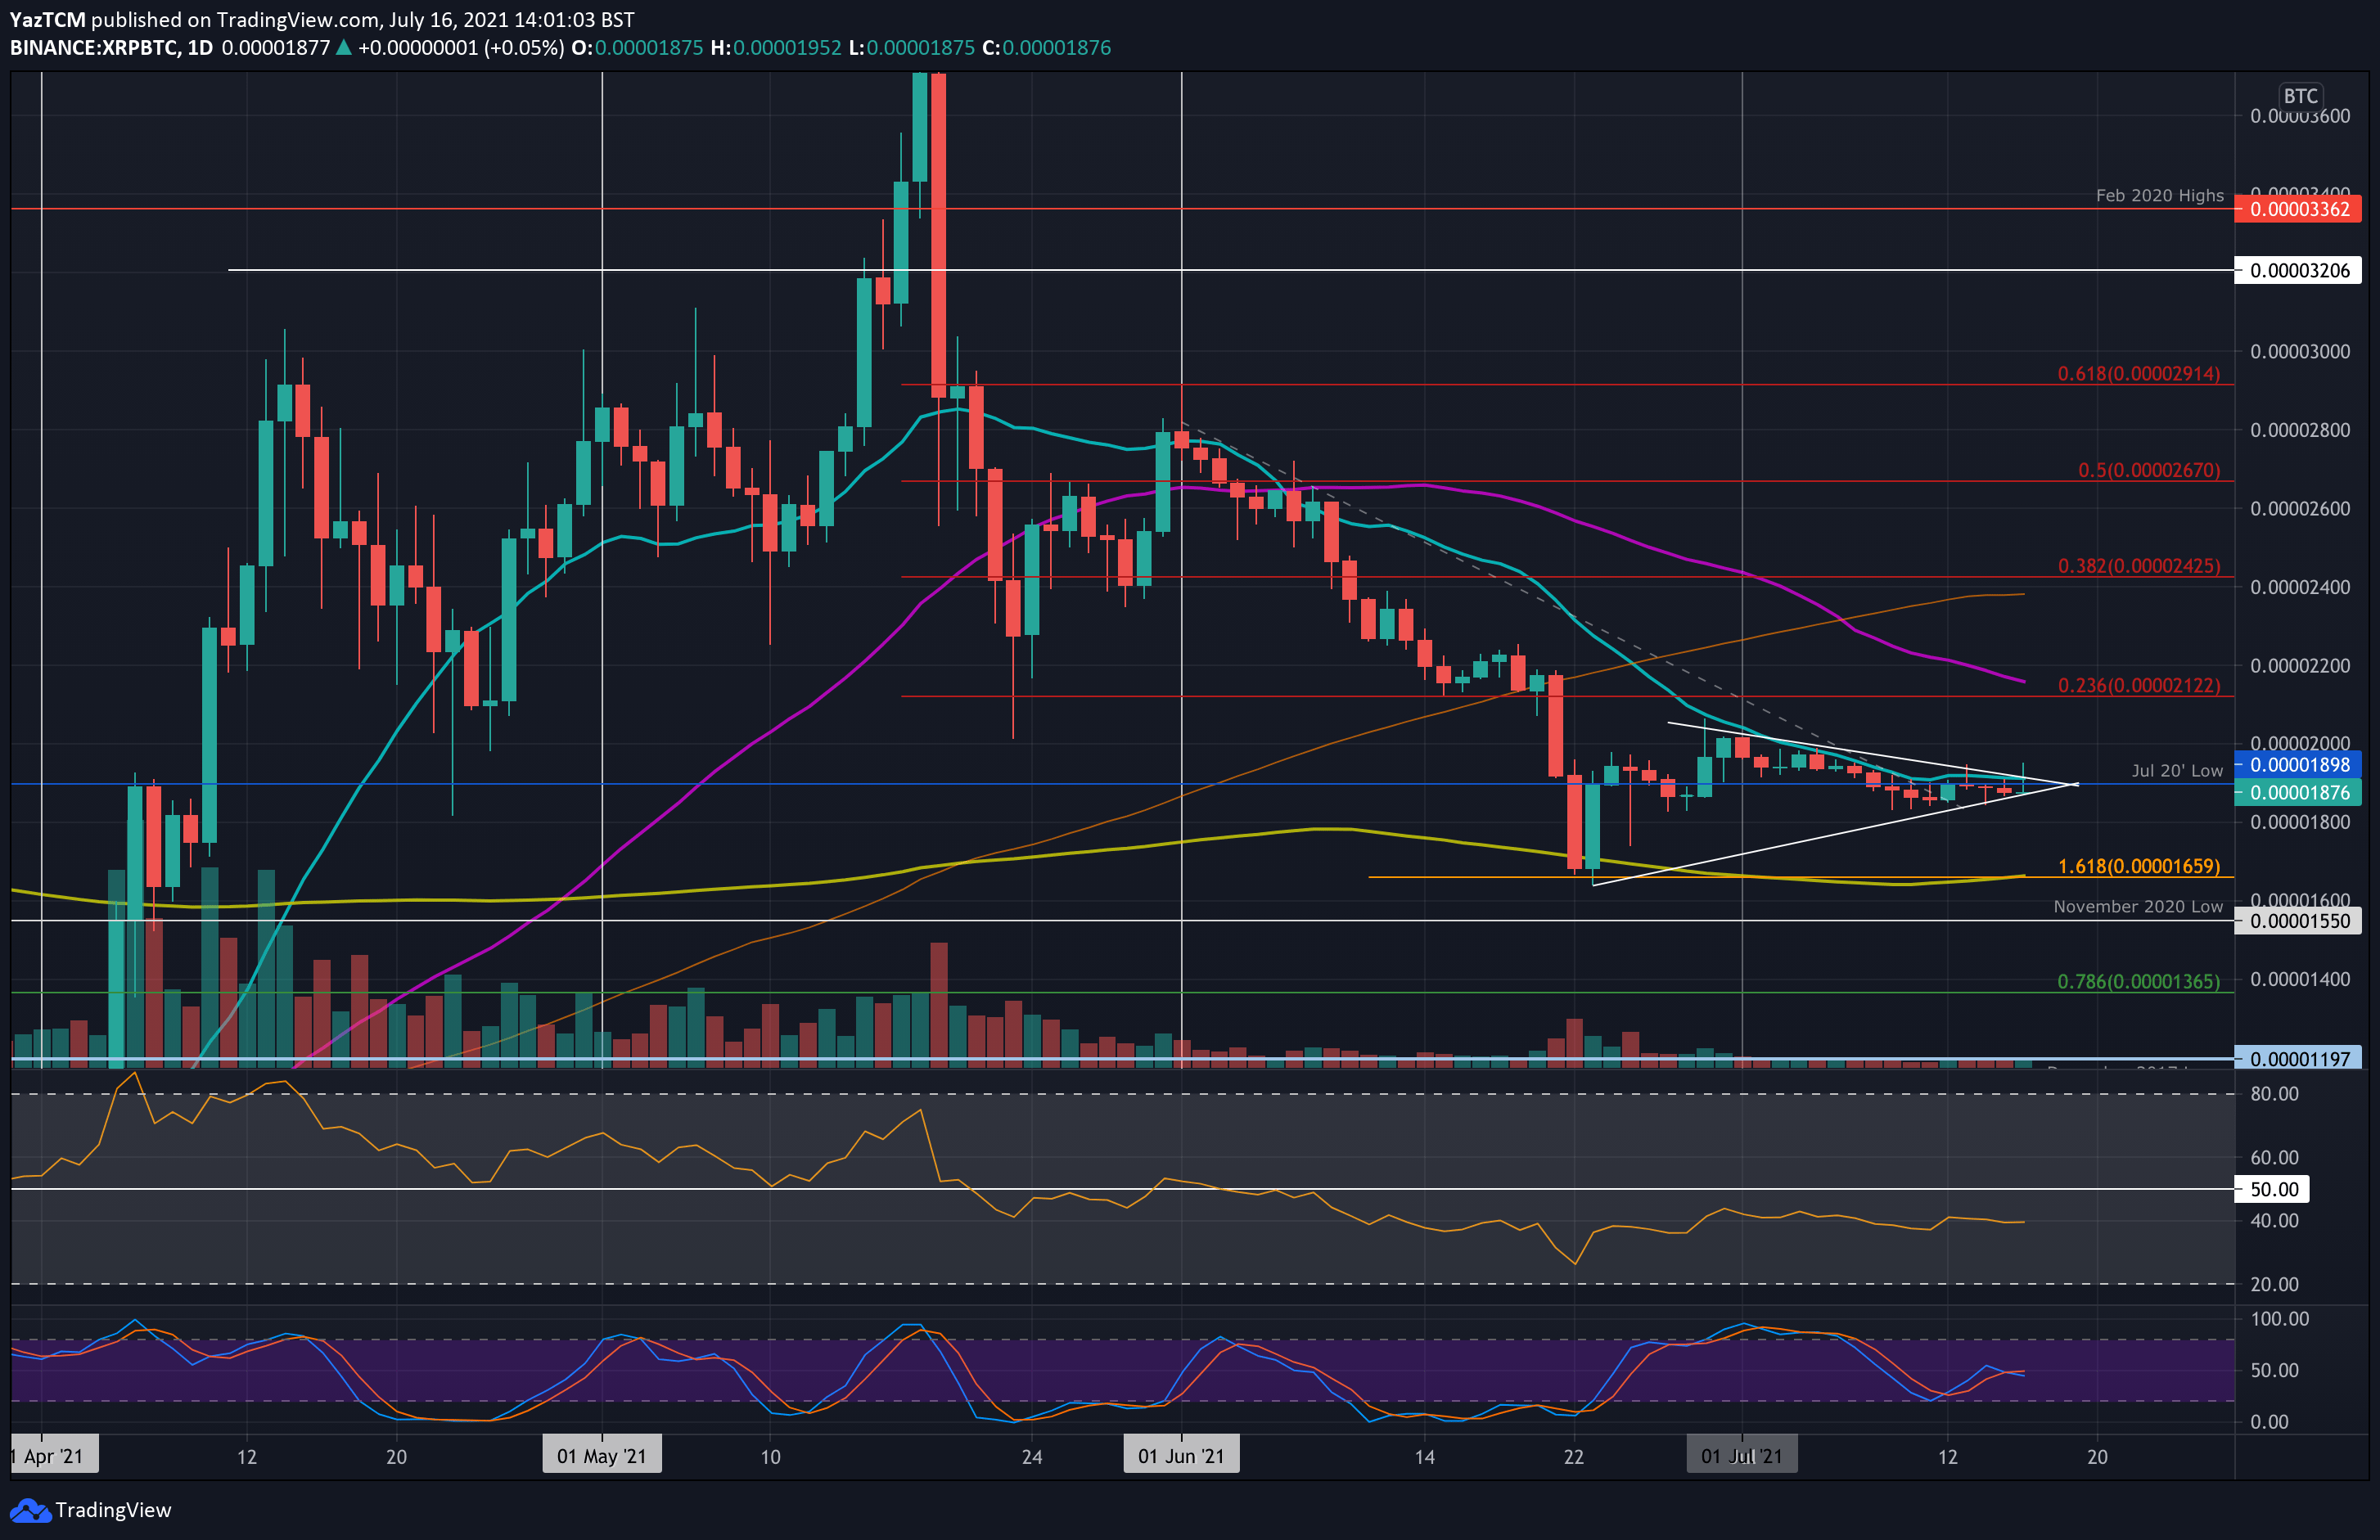
XRP is trading inside a short-term symmetrical triangle pattern against BTC and is at the apex, where the market can expect a breakout toward either side. The coin attempted to break resistance at 1900 SAT throughout the week but was rejected by the 20-day MA on each attempt.
Today, XRP spiked above the triangle but has since dropped back into the support at the lower angle.
Looking ahead, if the bears push beneath the triangle, the first support lies at 1800 SAT. This is followed by 1660 SAT (200-day MA & downside 1.618 Fib Extension), 1600 SAT, and 1550 SAT (Nov 2020 low).
On the other side, the first resistance lies at 1900 SAT (20-day MA, July 2020 low, & triangle angle). This is followed by 2000 SAT, 2120 SAT (bearish .236 Fib), 2160 SAT (50-day MA), and 2400 SAT (100-day MA).
Cardano
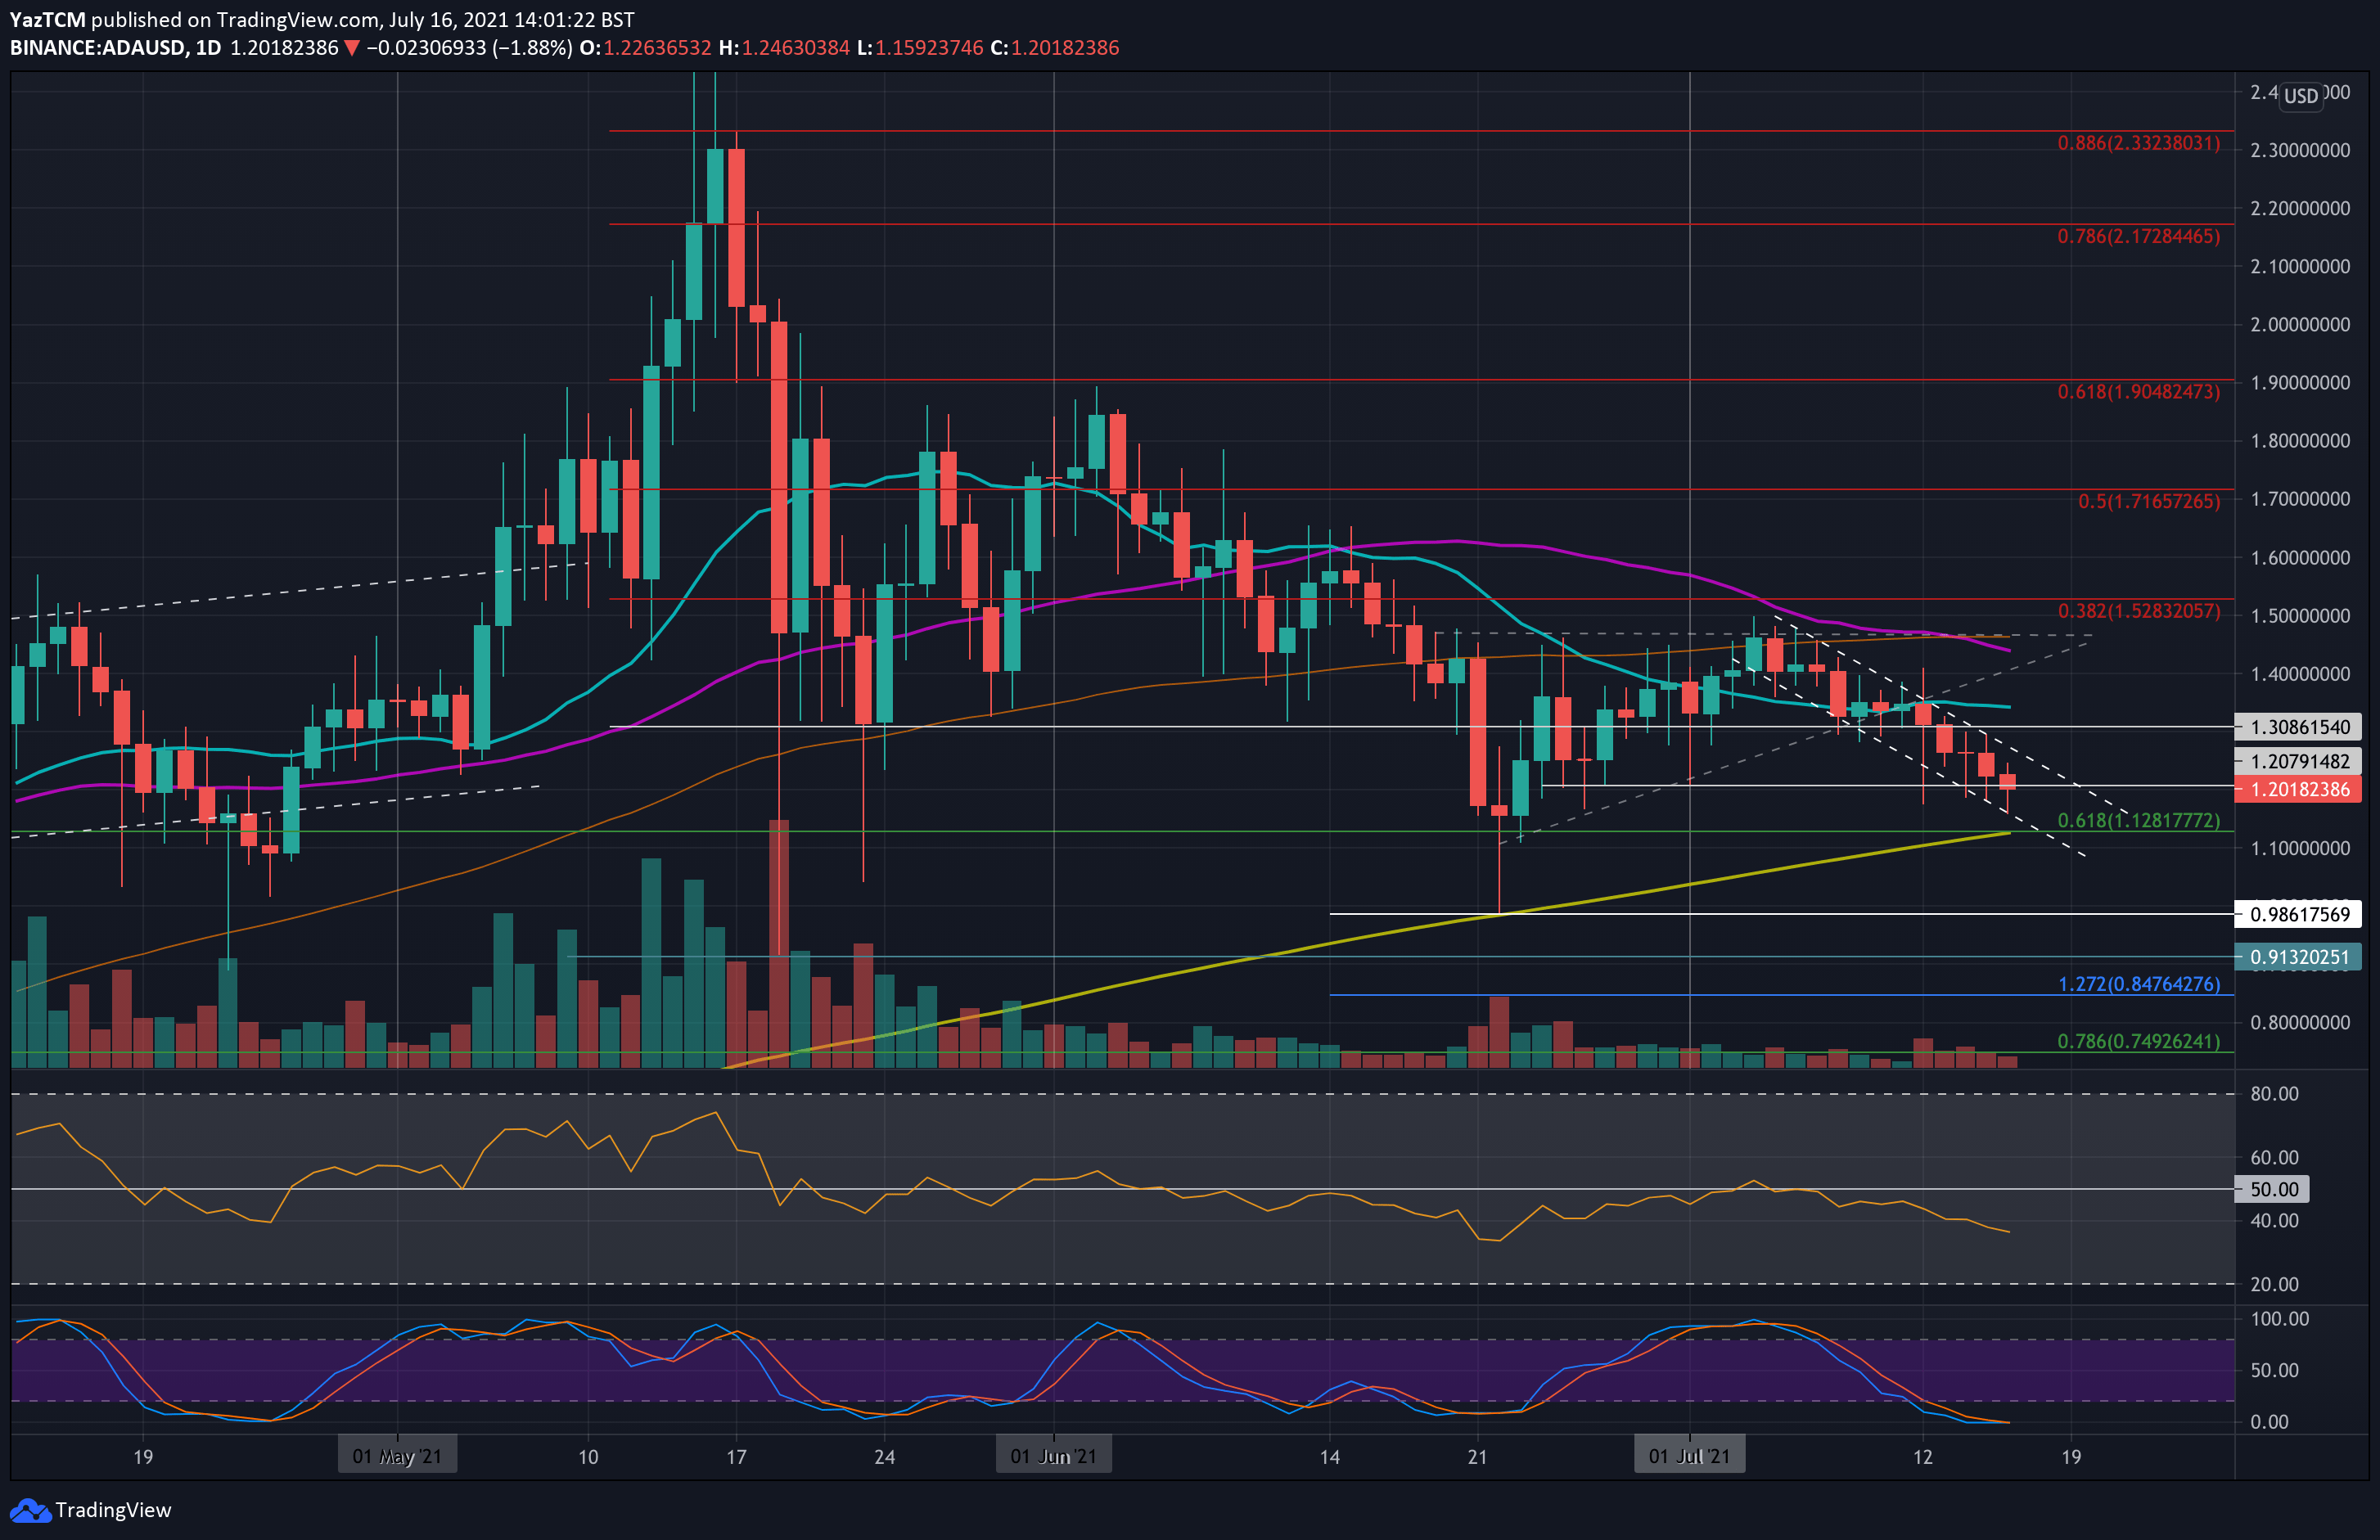
ADA fell by a steep 10.6% this week as the cryptocurrency currently trades at around $1.20. The coin attempted to break above the 20-day MA at around $1.35 on Monday but failed to close above it.
Since then, it has been trading lower inside the descending price channel. The lower angle of the channel continues to provide support while ADA fails to break the upper angle. The breakout toward the upside would be the first signal back toward $1.50 for ADA.
Looking ahead, the first support lies at $1.15. This is followed by $1.12 (200-day MA, .618 Fib, & lower boundary of the price channel). Beneath $1.12, added support lies at $1.00 and $0.986 (June lows).
On the other side, the first resistance lies at $1.25 (upper angle of the price channel). This is followed by $1.30, $1.35 (20-day MA), $1.45 (50-day MA), and $1.50.
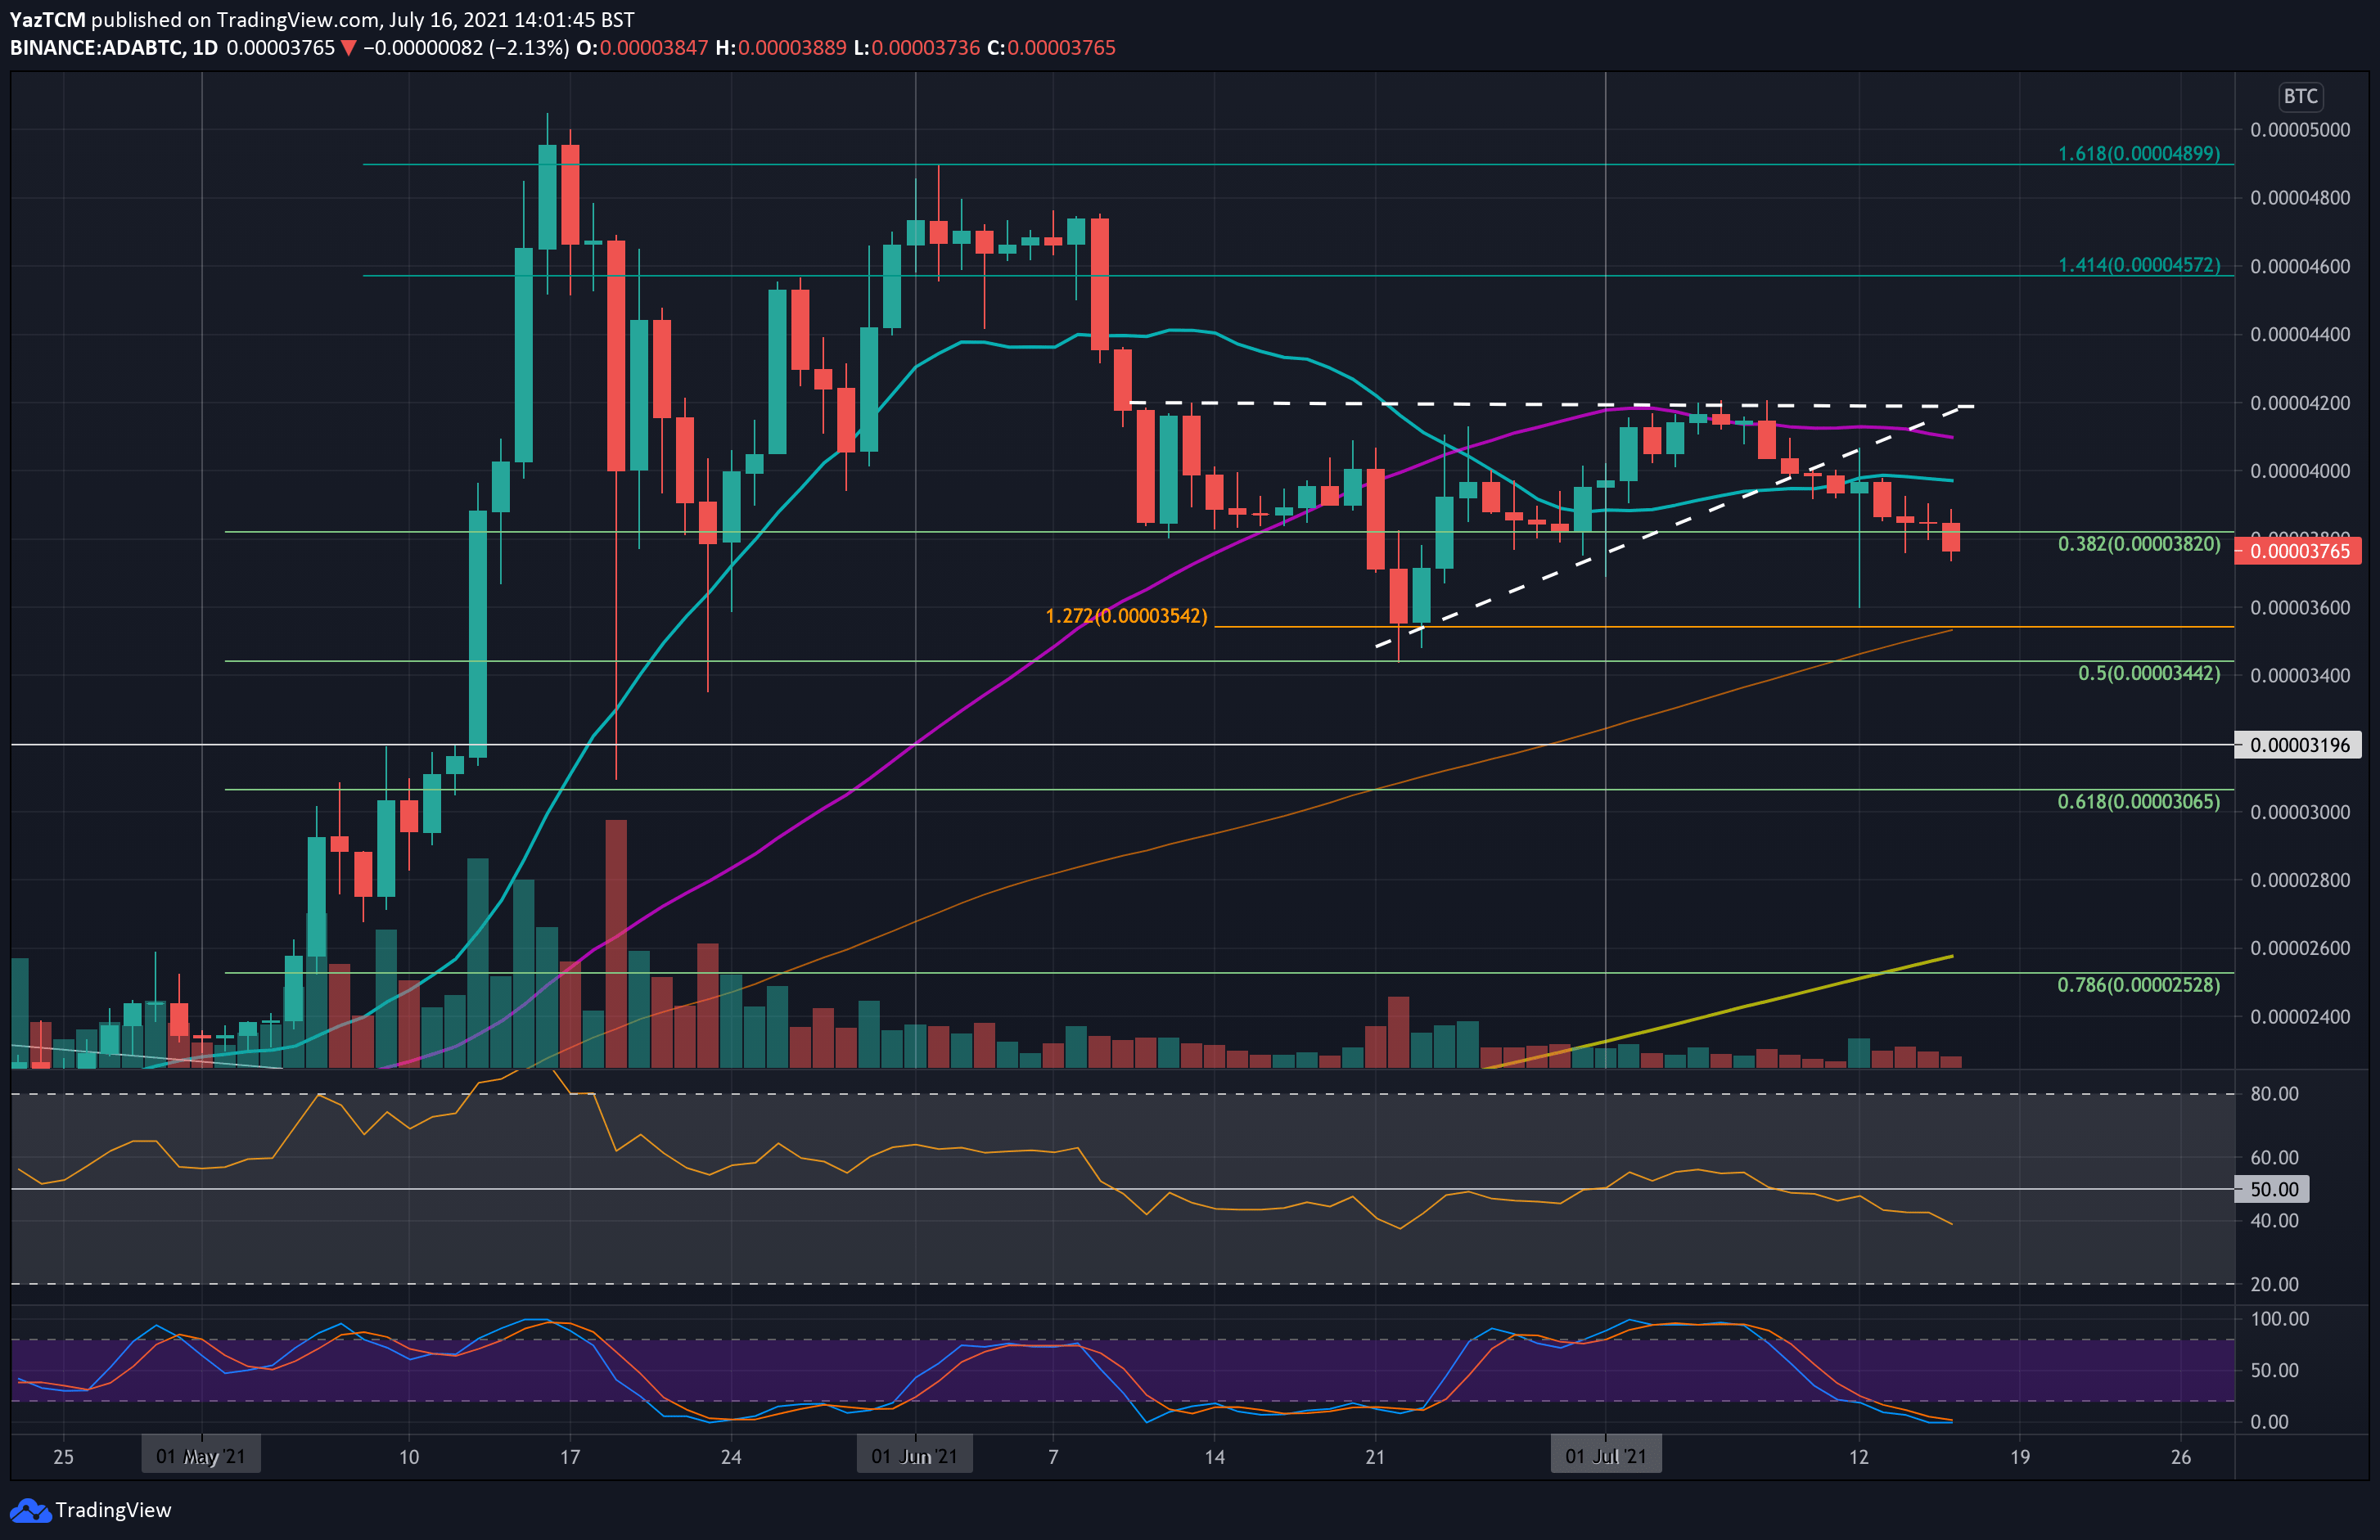
ADA is also struggling against BTC after falling beneath an ascending triangle at the start of the week. The coin fell beneath the 20-day MA on Tuesday and continued to drop throughout the week, reaching as low as 3730 SAT today.
Looking ahead, the first support lies at 3600 SAT (July lows). This is followed by 3540 SAT (10-day MA, downside 1.272 Fib Extension & June low-day closing price). Added support lies at 3440 SAT (.5 Fib).
On the other side, the first solid resistance lies at 3900 SAT. This is followed by 4000 SAT (20-day MA), 4100 SAT (50-day MA), and 4200 SAT (July resistance).
Polkadot
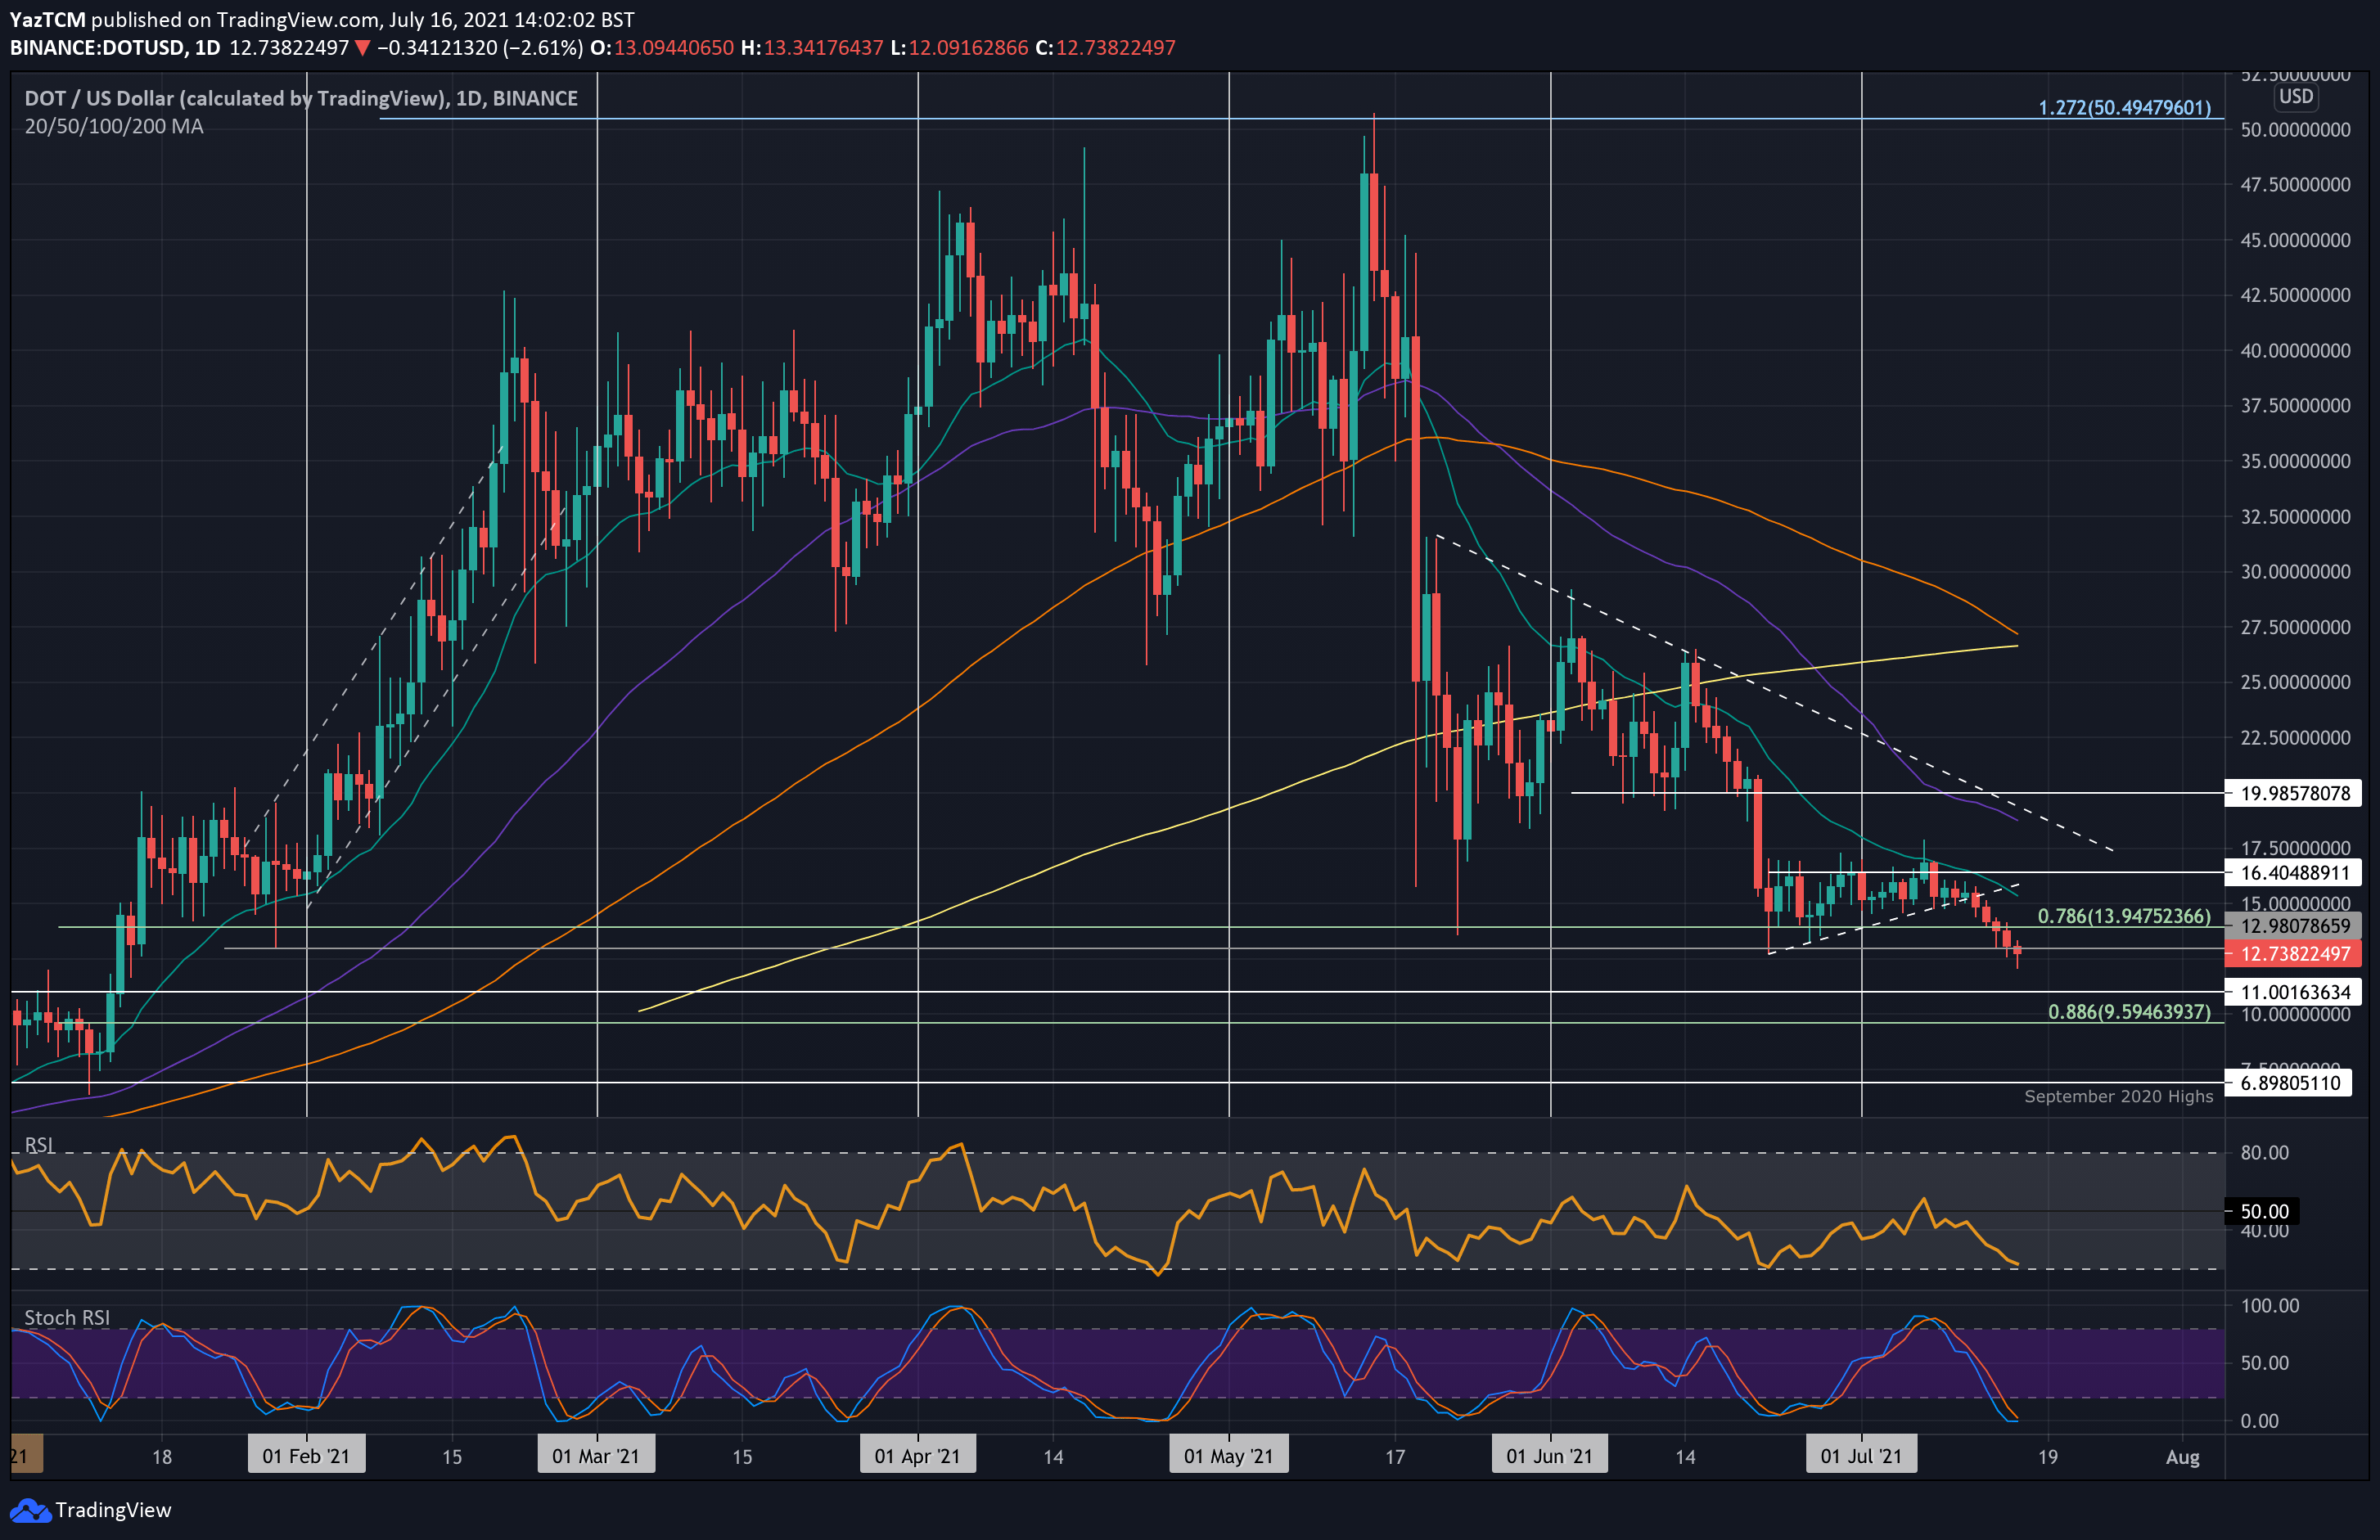
DOT is down a heavy 18% this week as it currently trades at around $12.70. It fell beneath an ascending triangle pattern at the start of the week and continued beneath the $14 (.786 Fib & June low-day close) support yesterday.
Today, DOT dipped as low as $12.10, creating a fresh six-month low price.
Looking ahead, if the bears continue lower, the first support lies at $11. This is followed by $10, $9.60 (.886 Fib), and $7.50.
On the other side, the first resistance lies at $14. This is followed by $15 (20-day MA), $16.40, and $17 (July resistance).
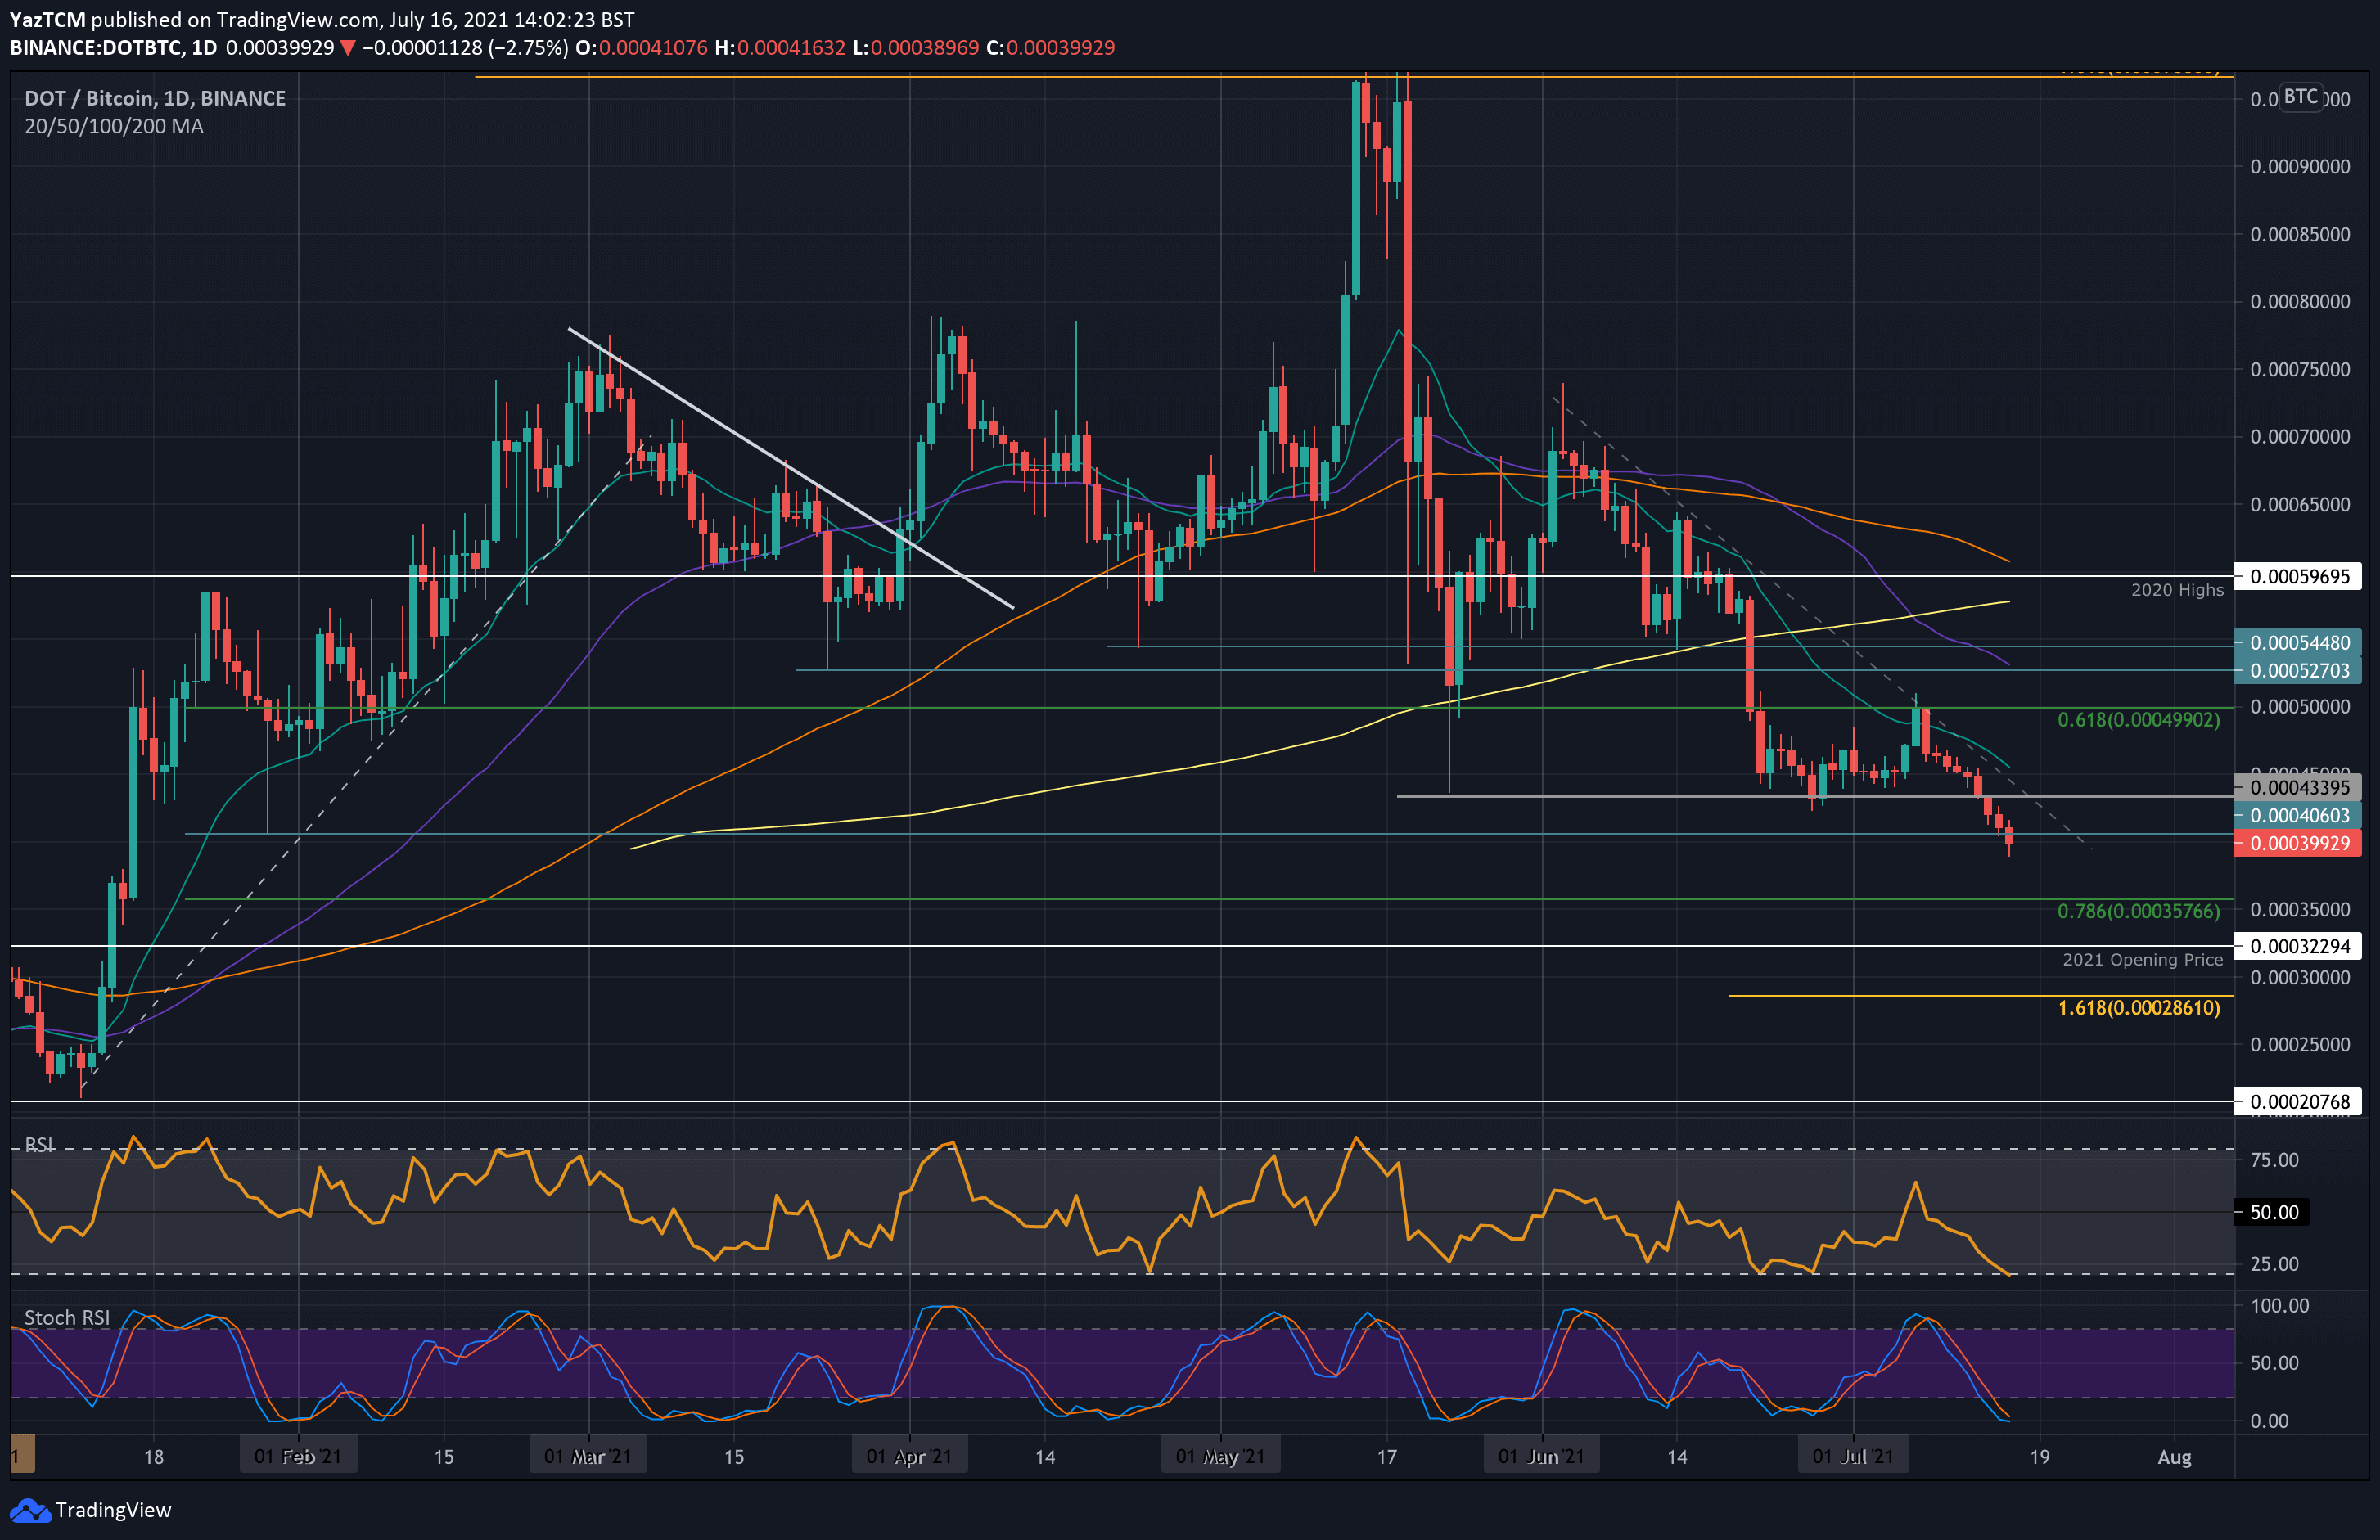
Against BTC, DOT also created a fresh six-month low after dropping beneath 0.0004 BTC today. The coin failed to break resistance at 0.0005 BTC at the start of the month and has been sliding ever since.
It dropped beneath the July support at 0.000433 BTC on Wednesday, which allowed it to continue beneath 0.0004 BTC today.
Looking ahead, if the bears keep driving DOT lower, the first solid support lies at 0.000357 BTC (.786 Fib). This is followed by 0.00035 BTC, 0.000322 BTC (2021 Opening price), and 0.0003 BTC.
On the other side, the first resistance lies at 0.0004 BTC. This is followed by 0.000433 BTC (July support – now resistance) and 0.00045 BTC (20-day MA).
Disclaimer: Information found on CryptoPotato is those of writers quoted. It does not represent the opinions of CryptoPotato on whether to buy, sell, or hold any investments. You are advised to conduct your own research before making any investment decisions. Use provided information at your own risk. See Disclaimer for more information.
Cryptocurrency charts by TradingView.


