

Bitcoin
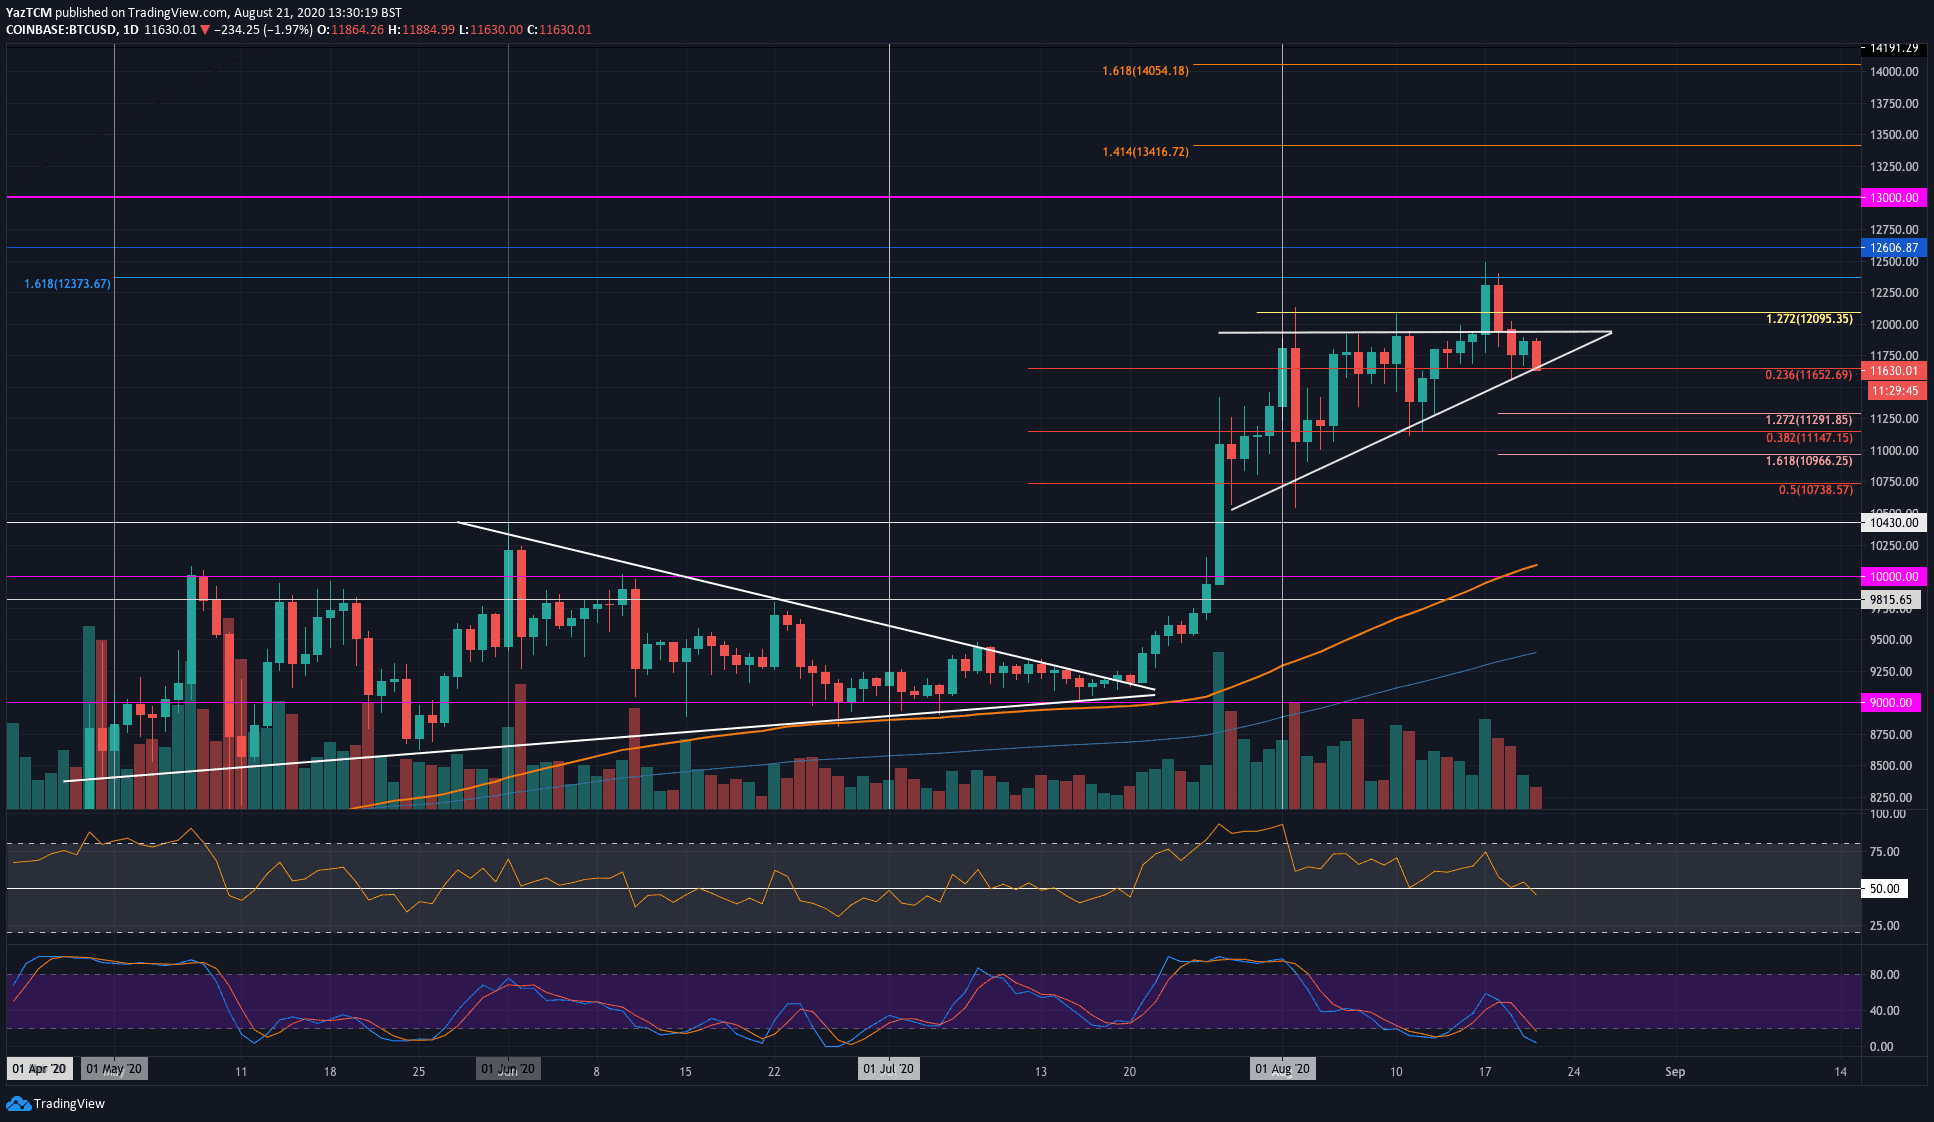
Bitcoin continued its sideways movement this week as it remained around the $11,600 level. However, during the week, the cryptocurrency did push higher as it penetrated above the $12,000 resistance to reach the $12,400 level.
Unfortunately, it was unable to sustain these highs as it rolled over to fall beneath $12,000 at the start of the week. Bitcoin has since dropped further as it reached the support at $11,650 (.236 Fib Retracement). A rising trend line also bolsters this support.
The fading momentum, coupled with falling volume, puts Bitcoin in a precarious situation that could lead to it dropping back toward $11,000.
If the sellers do break beenath $11,650, the first level of support lies at $11,300 (downside 1.172 FIb Extension). Added support is found at $11,150 (.382 Fib Retracement), $11,000, and $10,783 (.5 Fib Retracement).
On the other side, if the bulls can regroup at $11,650 and push higher, resistance lies at $11,800, $12,000, $12,100 (1.272 Fib Extension), and $12,400.
Ethereum
Ethereum dropped by 5.5% this week as it falls into the $408 support. Last week, the coin pushed higher above $400 to reach the resistance at $438, provided by the August 2018 high price. This allowed Ethereum to create a fresh 2-year high.
During the weekend, ETH rolled over from this resistance. The coin eventually found support at $408 (previous flipped resistance) as the buyers battle to defend this level.
Ethereum did spike lower during the week to reach the support at $395 (.236 Fib Retracement), but the bulls quickly stepped in and allowed it to rebound above $400.
A break beneath $409 is likely to drive Ethereum below $400. If this is the case, support lies at $395 (.236 Fib Retracement), $382 (downside 1.272 Fib Extension), $375 (downside 1.414 Fib Extension), and $363 (2019 high). The support at $363 is further bolstered by a downside 1.618 Fib Extension and the .382 Fib Retracement – adding further to this support.
On the other side, the first level of strong resistance lies at $438 (August 2018 high). This is followed by $445 ($450), $463 (1.272 Fib Extension), $490 (1.414 Fib Extension), and $500.

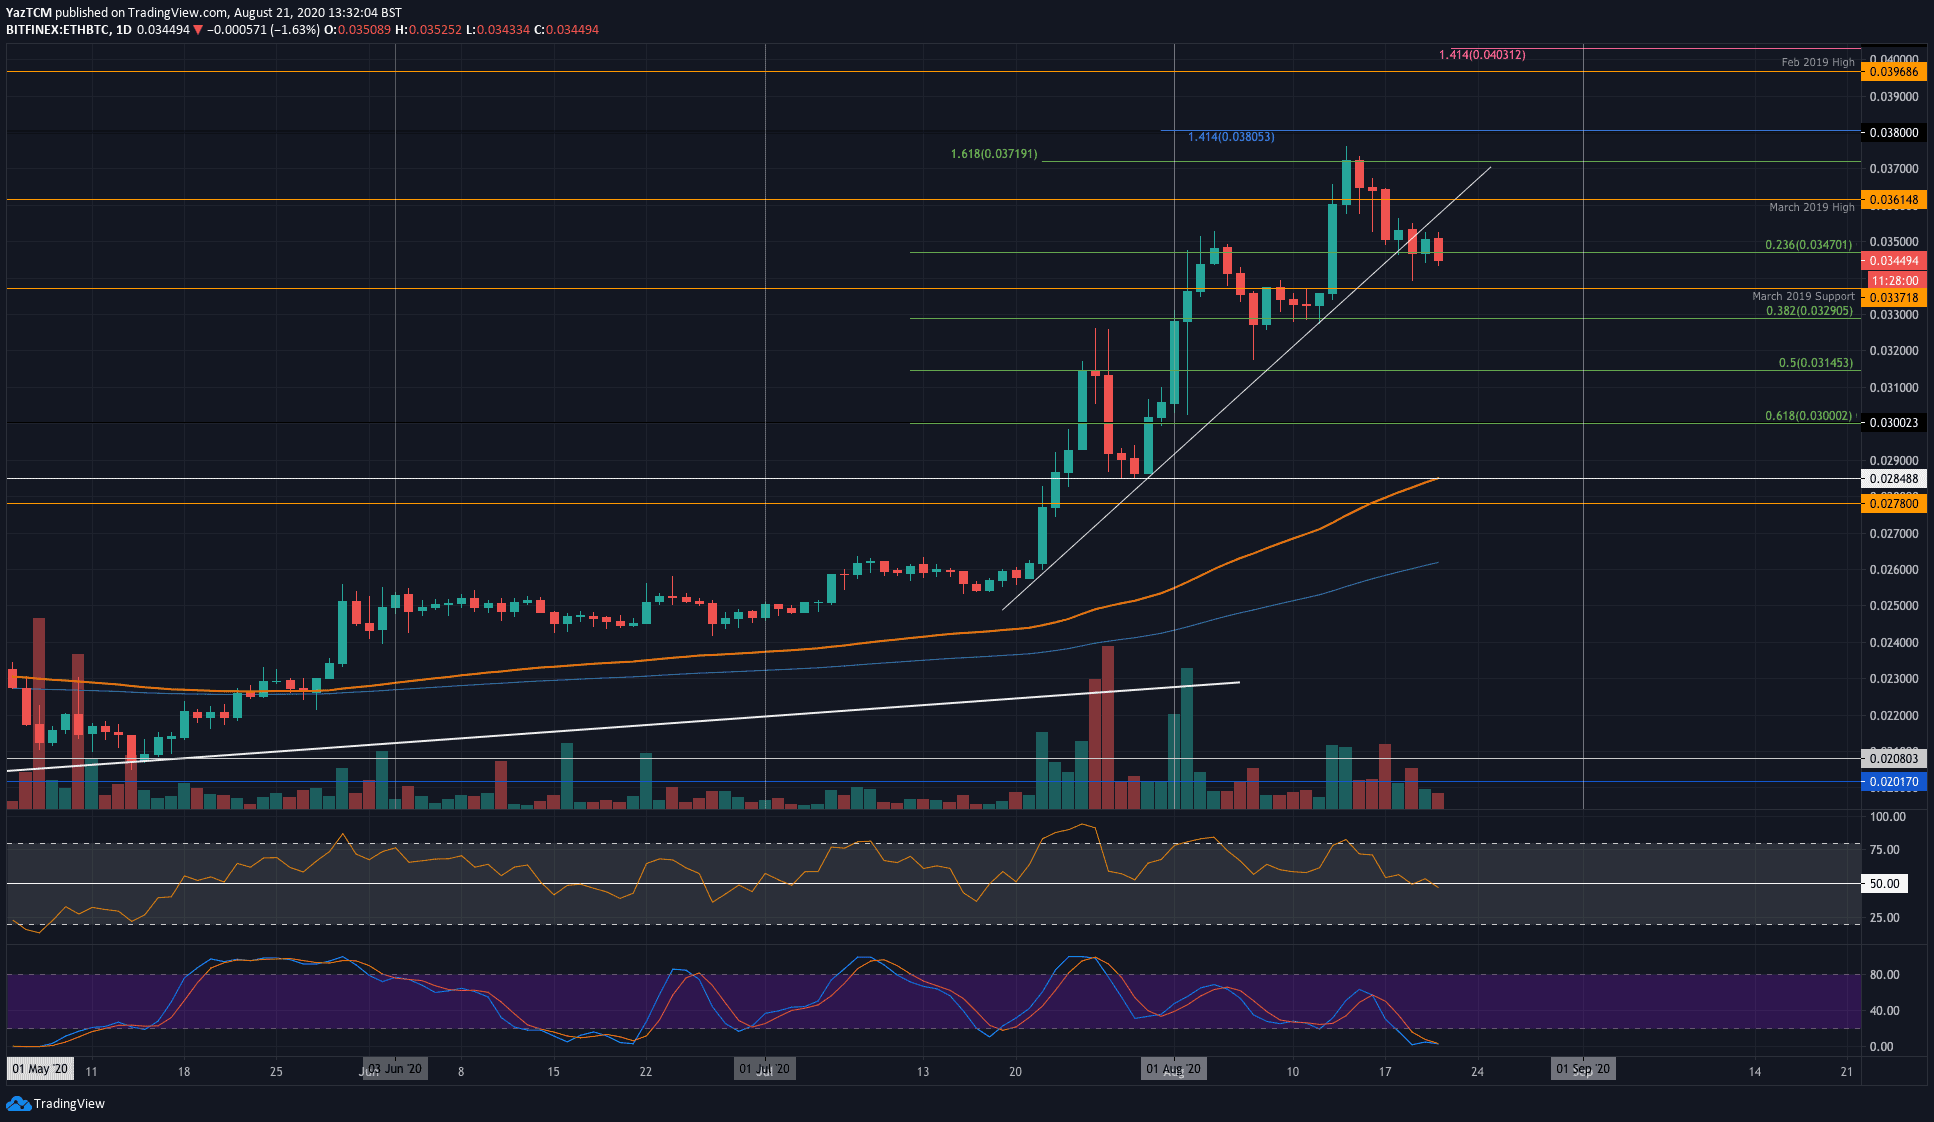
Against Bitcoin, ETH also fell lower from the high reached last week at the 0.0371 BTC level. During the week, the coin initially found support at 0.0347 BTC (.236 Fib Retracement). The buyers have defended this support over the past 4-days. However, the sideways movement has caused Etheruem to break beneath a steeply rising trend line that it was tracking since mid-July.
If the sellers push lower, the first level of support lies at 0.0337 BTC (March 2019 support). This is followed by support at 0.0329 BTC (.382 Fib Retracement), 0.032 BTC, and 0.0314 BTC (.5 Fib Retracement).
On the other side, resistance first lies at 0.035 BTC. Following this, additional resistance is located at 0.0361 BTC (March 2019 high), 0.0371 BTC, and 0.038 BTC.
Ripple
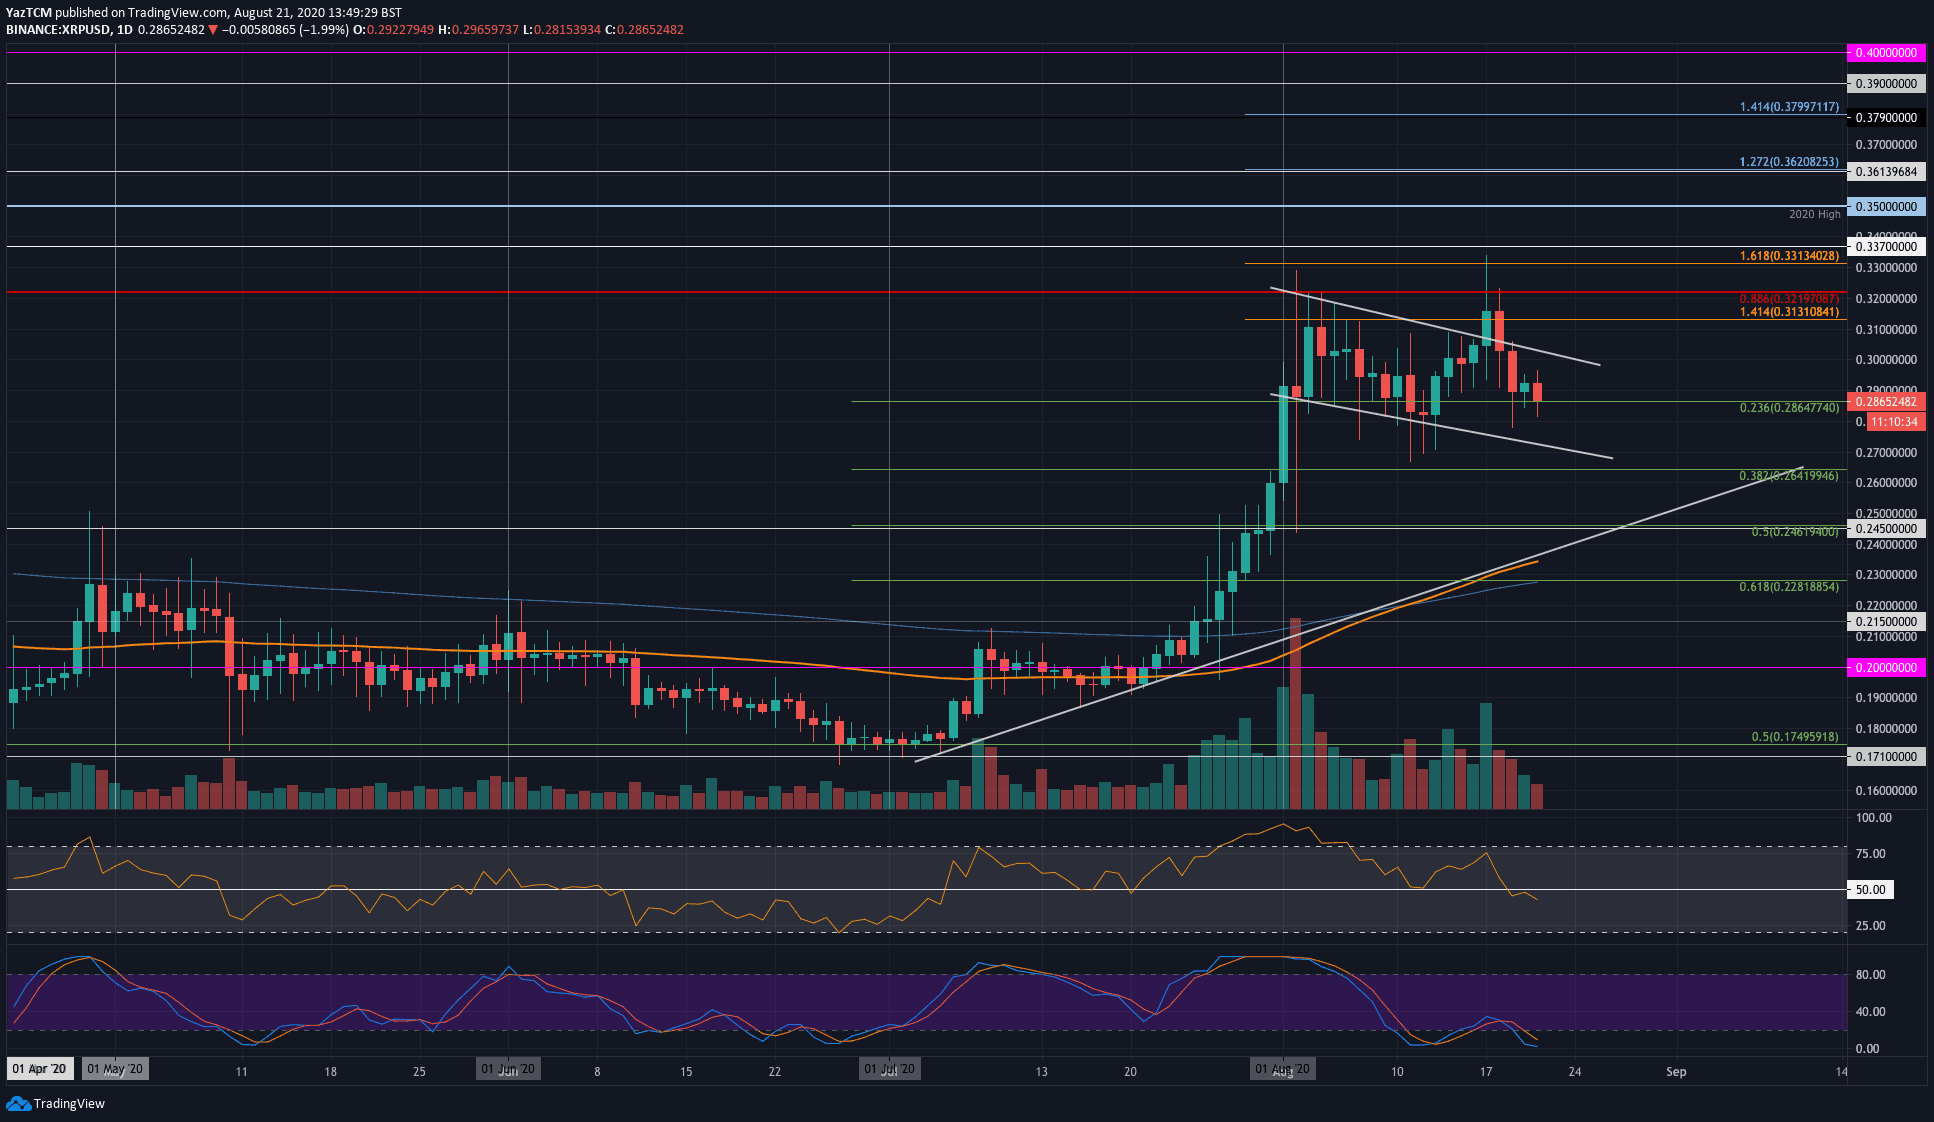
XRP suffered a smaller 4% price drop this week as it falls into the $0.286 support, provided by a .236 Fib Retracement. XRP started the week above $0.3 as it pushed above a shallow falling price channel. It managed to spike as high as $0.331 before the sellers stepped in and sold XRP lower.
On Tuesday, XRP penetrated beneath $0.3 as it fell back into the previous falling price channel. The coin continued to drop over the following days until reaching support at $0.286 (.236 Fib Retracement).
If the bulls can regroup at $0.286 and push higher, the first level of resistance lies at $0.3. Following this, resistance lies at $0.313 (1.414 Fib ExtensioN), $0.321 (bearish .886 Fib Retracement), and $0.331 (1.618 Fib Extension).
Alternatively, if the sellers break beneath $0.286, the first level of support lies at $0.28. This is followed by support at the lower boundary of the channel, $0.264 (.382 Fib Retracement), and $0.25.
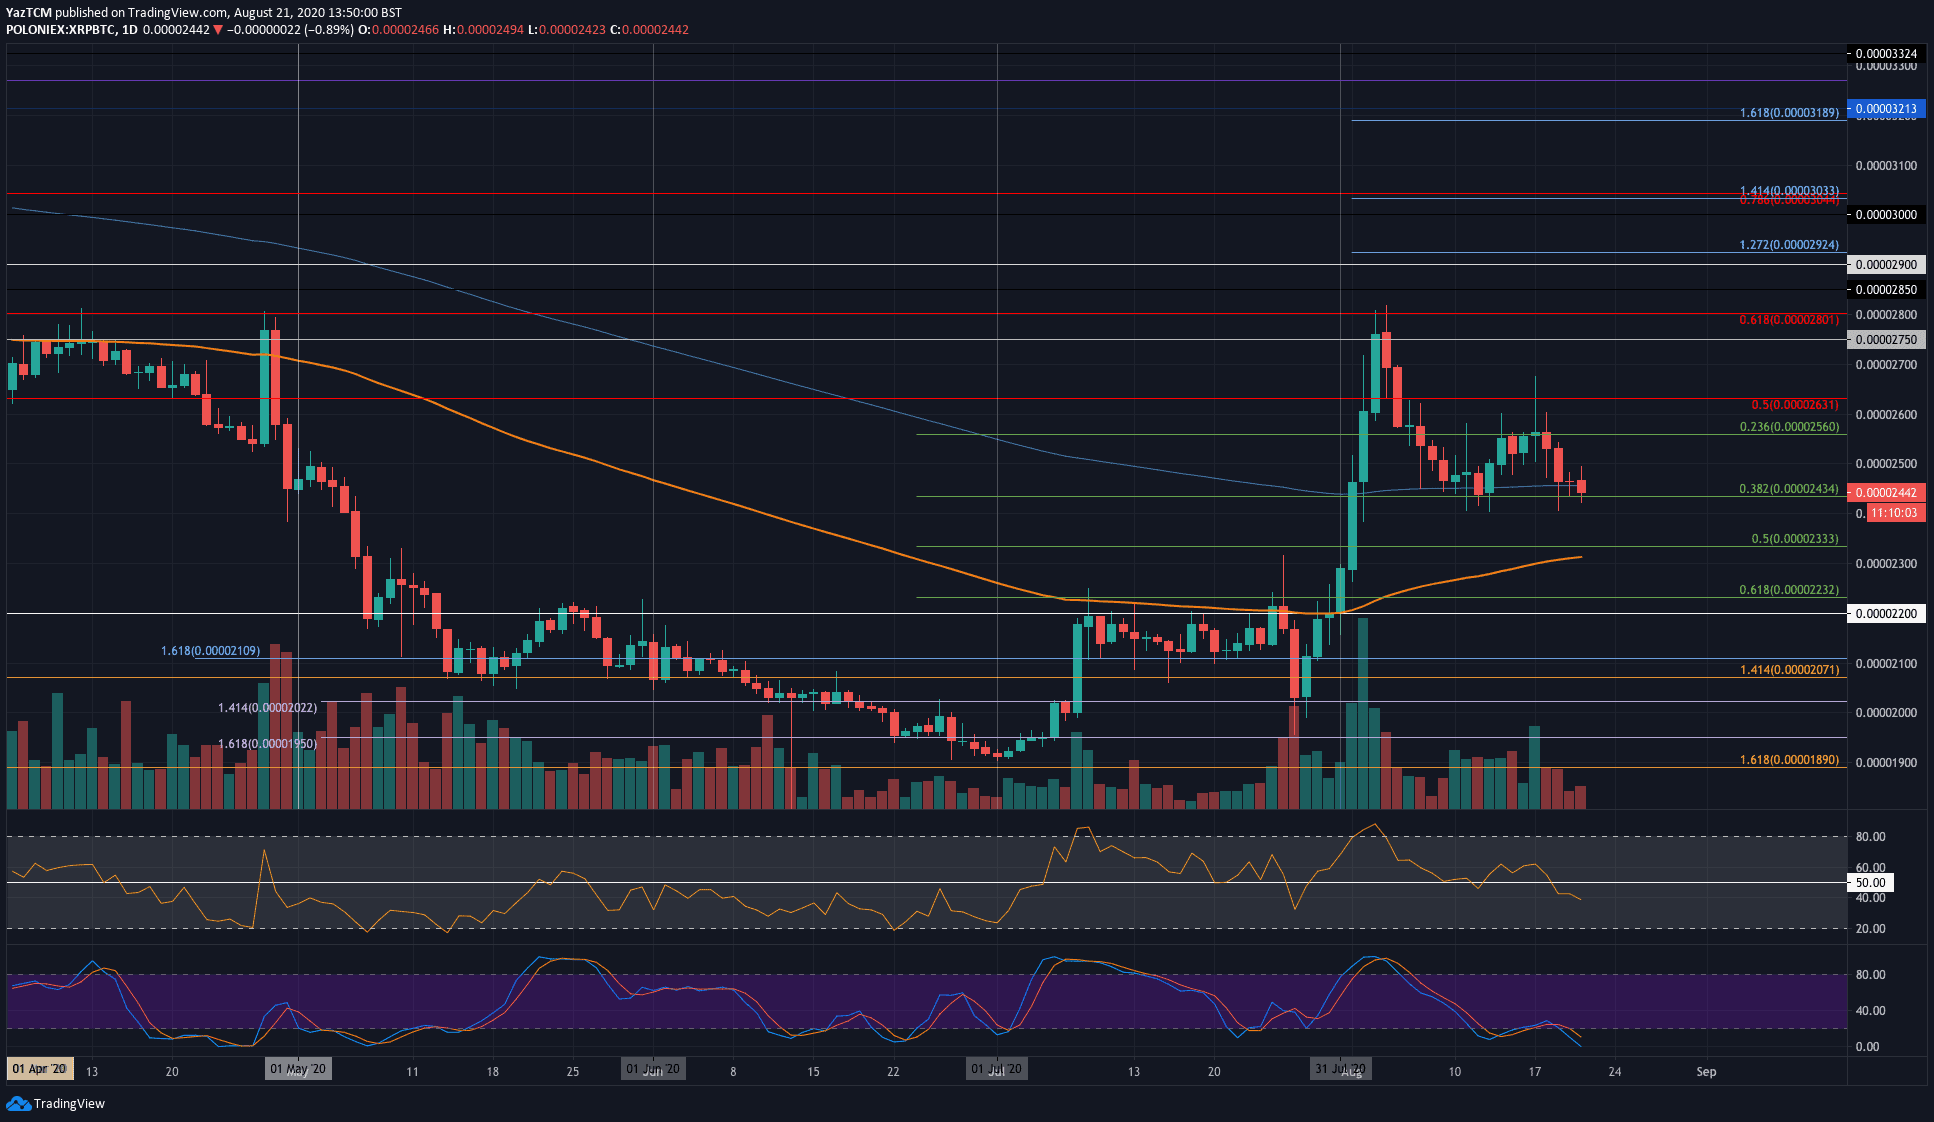
Against Bitcoin, XRP headed lower this week as it reached the 2435 SAT support (.382 Fib Retracement). The coin had attempted to push higher as it spiked toward 2700 SAT. However, the bears did not allow it to close a daily candle above 2560 SAT this week.
After rolling over from 2560 SAT, XRP headed lower and eventually broke beneath the 100-days EMA to reach the current 2435 SAT support (.382 Fib Retracement).
If the sellers push beneath the 2435 SAT, the first level of support lies at 2400 SAT. This is followed by support at 2333 SAT (.5 Fib Retracement & 200-days EMA), 2230 SAT (.618 Fib Retracement), and 2100 SAT.
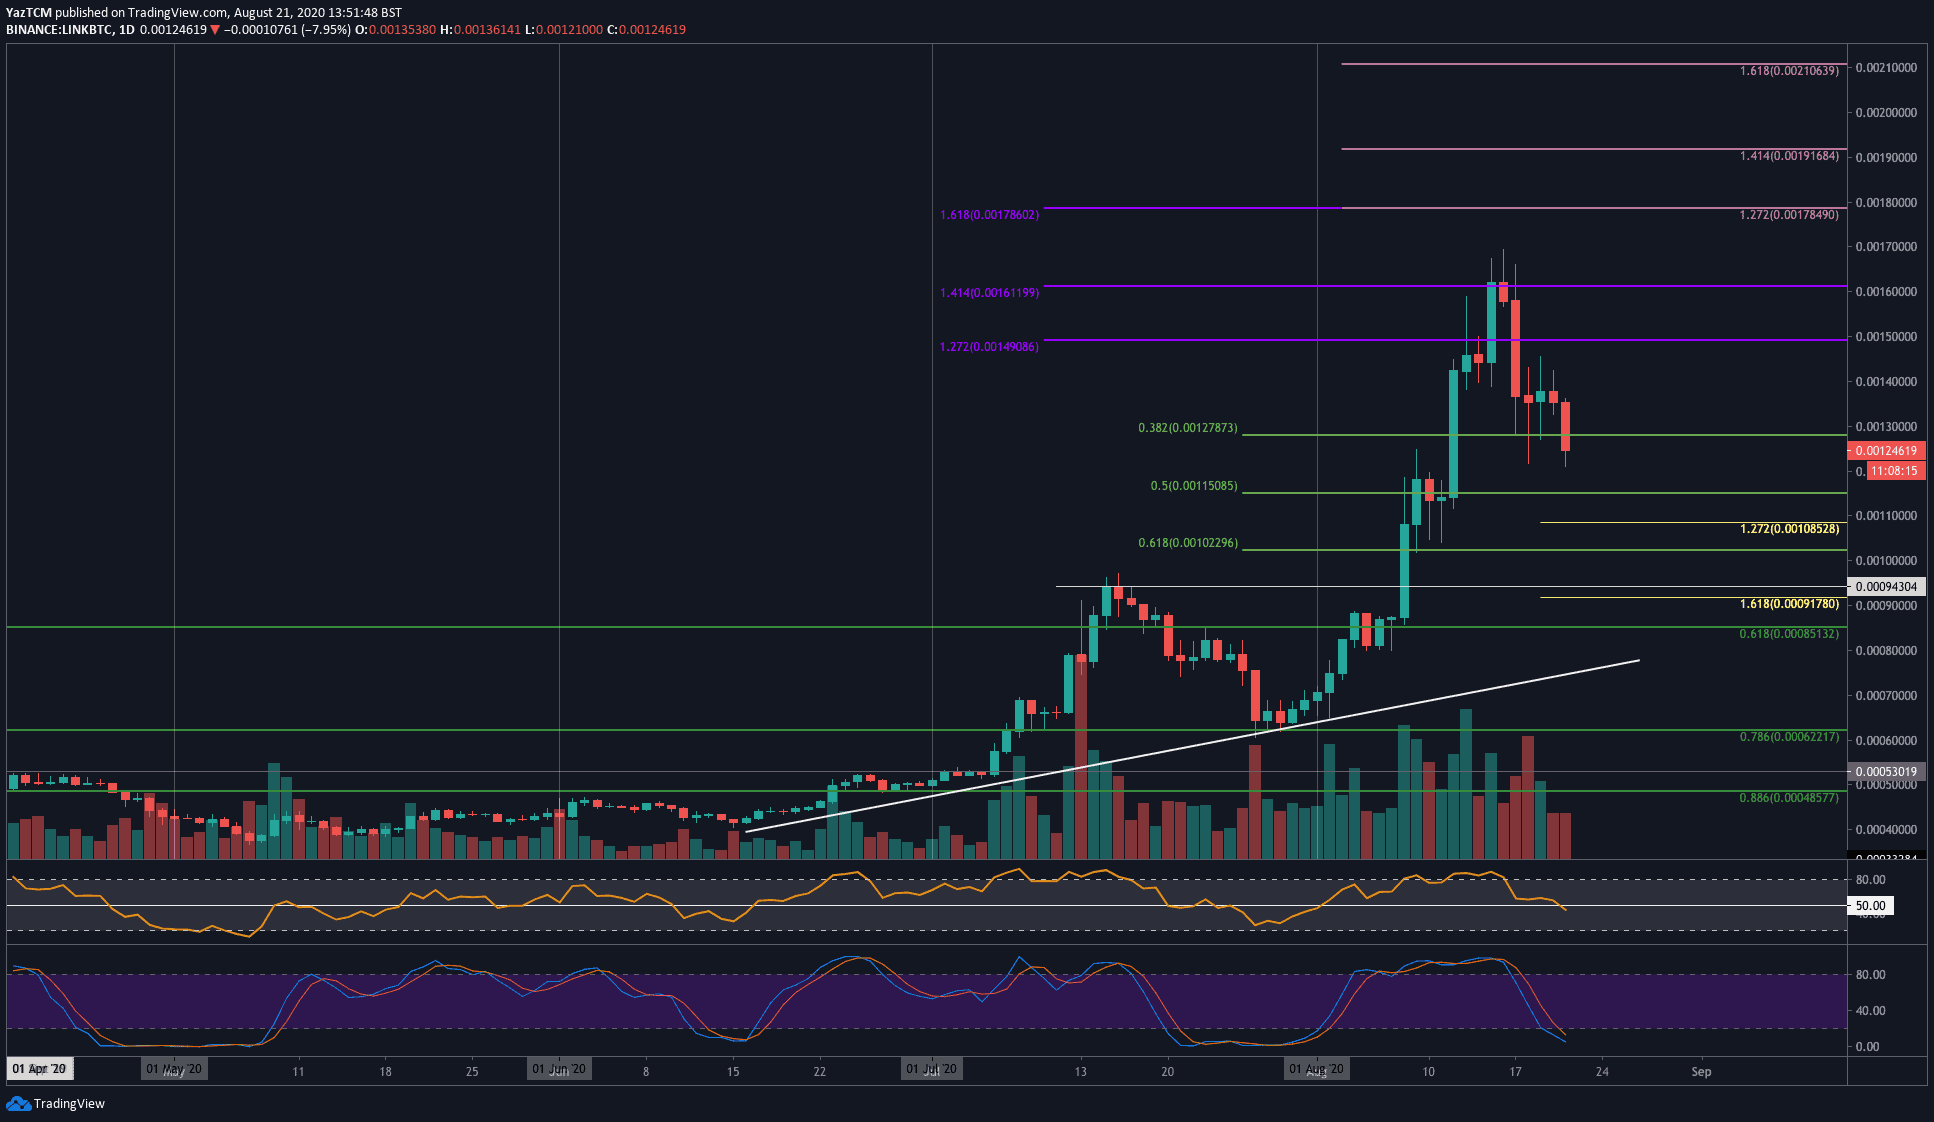
Chainlink
Chainlink suffered a steep 14% price drop this week as it reached the $14.60 level. LINK had started the week on a bullish note as it pushed into the $19.50 resistance (1.618 Fib Extension). The coin attempted to push higher as it spiked toward the $21 level, but the sellers quickly stepped in and dropped LINK.
During the week, the bulls attempted to defend the $16 level, which broke today as LINK penetrates beneath support at $15 (.382 Fib Retracement) to reach $14.62. The price drop today caused the RSI to break beneath the mid-line, which indicates that the sellers are now in charge of the market momentum.
If the sellers continue to drive LINK lower, the first level of support lies at $14. This is followed by support at $13.35 (.5 Fib Retracement), $12.60 (downside 1.272 Fib Extension), $11.62 (.618 Fib Retracement), and $11.
On the other side, resistance lies at $15, $16, $17.20, and $19.50.

The situation is similar for LINK against Bitcoin. The coin reached as high as 0.0017 BTC during the week but failed to close a daily candle above 0.0161 BTC. LINK rolled over from here and initially found support at 0.00127 BTC (.382 Fib Retracement). This support broke today as LINK dropped further to reach 0.00124 BTC.
If the selling continues, support is expected at 0.0015 BTC (.5 Fib Retracement). This is followed by support at 0.00108 BTC (downside 1.272 Fib Extension), 0.0010 BTC (.618 Fib Retracement), and 0.000943 BTC.
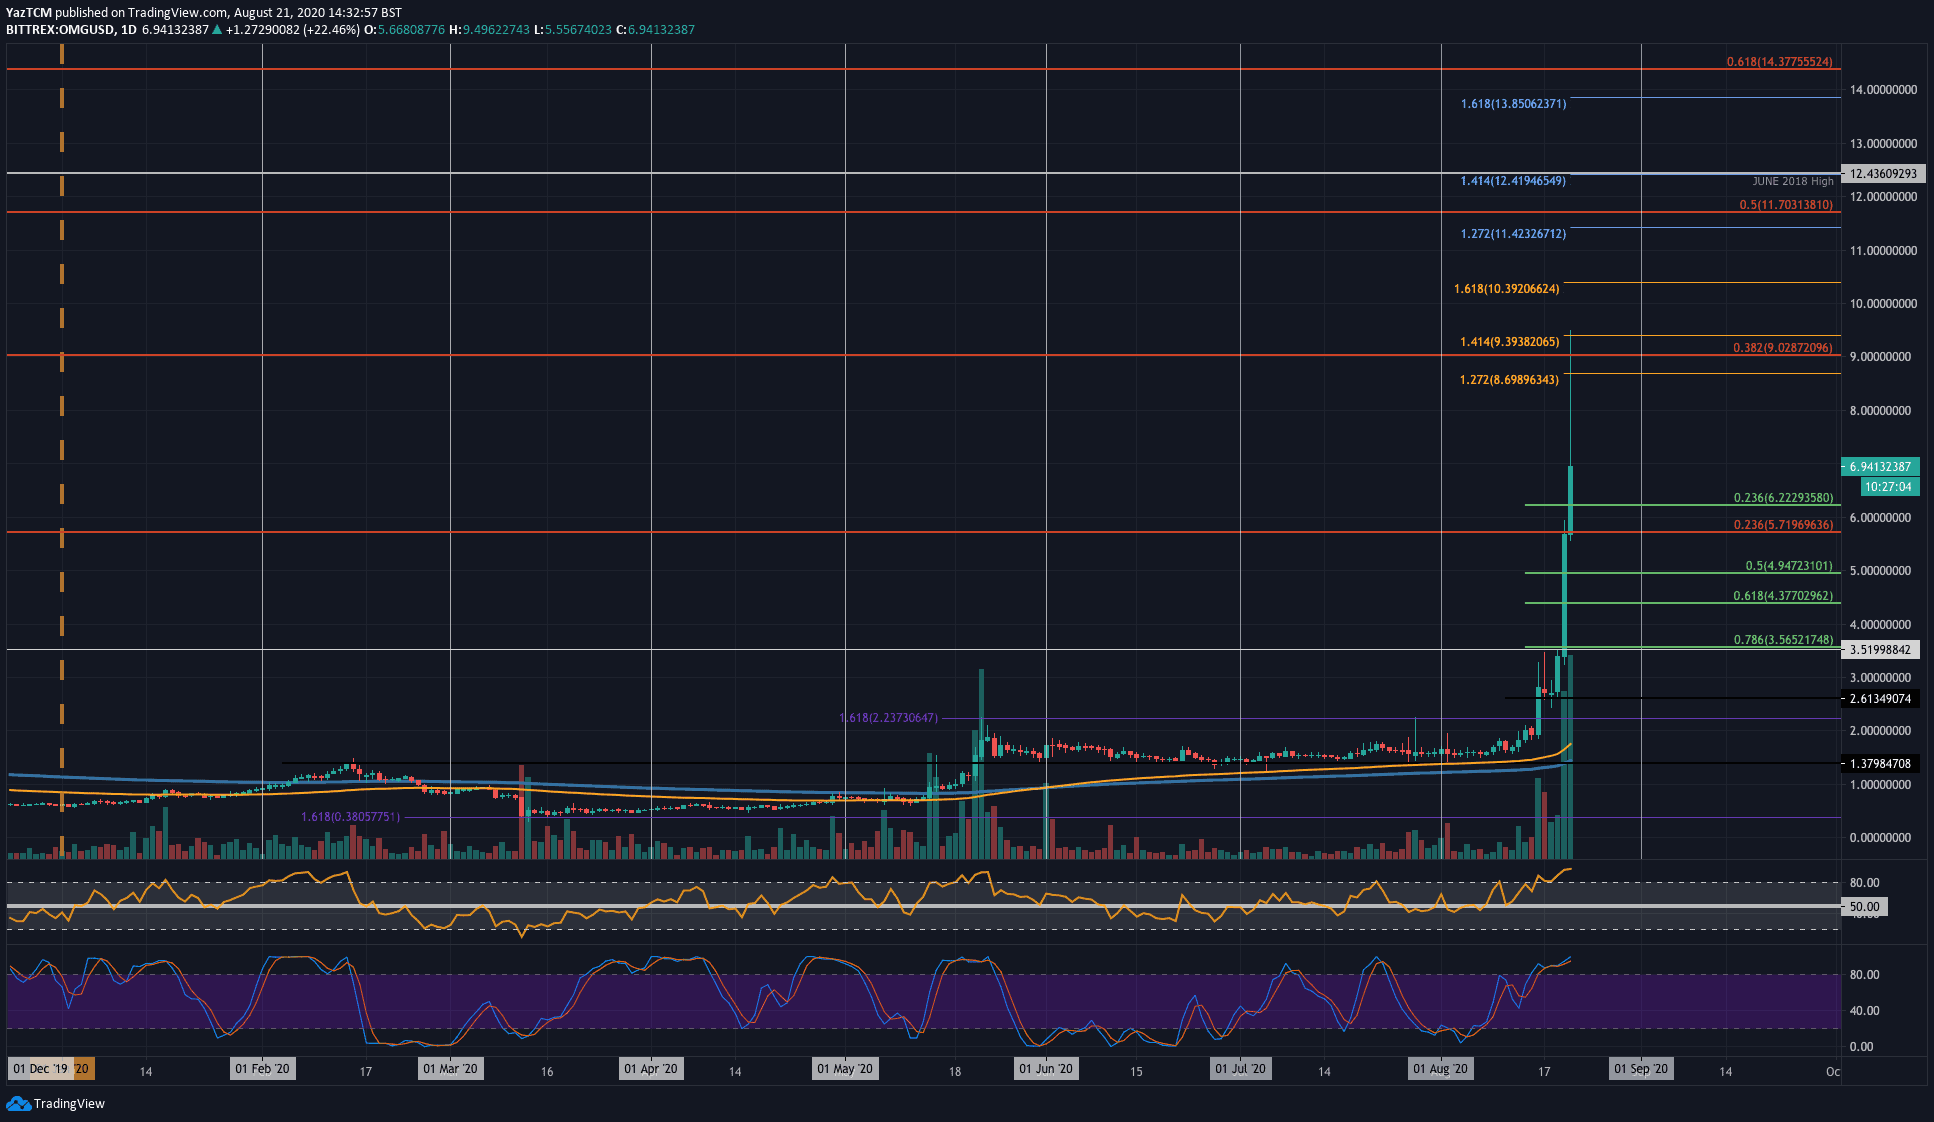
OMG Network
OMG saw an extraordinary 250% price increase this week as the coin reached the $7.00 level. This type of growth is truly unprecedented and took the entire market by surprise. The coin started the week by trading beneath the $2.00 level. From there, it began to climb higher until reaching $3.50.
Yesterday, OMG surged higher above $3.50 to reach the $5.71 resistance level, provided by a bearish .236 Fib Retracement. This bearish Fibonacci Retracement is measured from April 2018 high to the 2020 price low.
Today, OMG exploded above the $5.71 level as it climbed higher to reach as high as $9.40 (1.414 Fib Extension). The coin has since dropped quite substantially to reach the current $7.00 level.
If the buyers begin to climb again, the first level of resistance lies at $8. This is followed by resistance at $8.70 (1.272 Fib Extension), $9 (bearish .382 Fib Retracement), $9.40 (1.414 Fib Extension), and $10. Beyond $10, added resistance is expected at $10.40 (1.618 Fib Extension), $11.42, and $11.70 (bearish .5 Fib Retracement).
On the other side, support lies at $6.22 (.236 Fib REtracement), $5.70, $5.00 (.5 Fib Retracement), and $4.37 (.618 Fib Retracement).
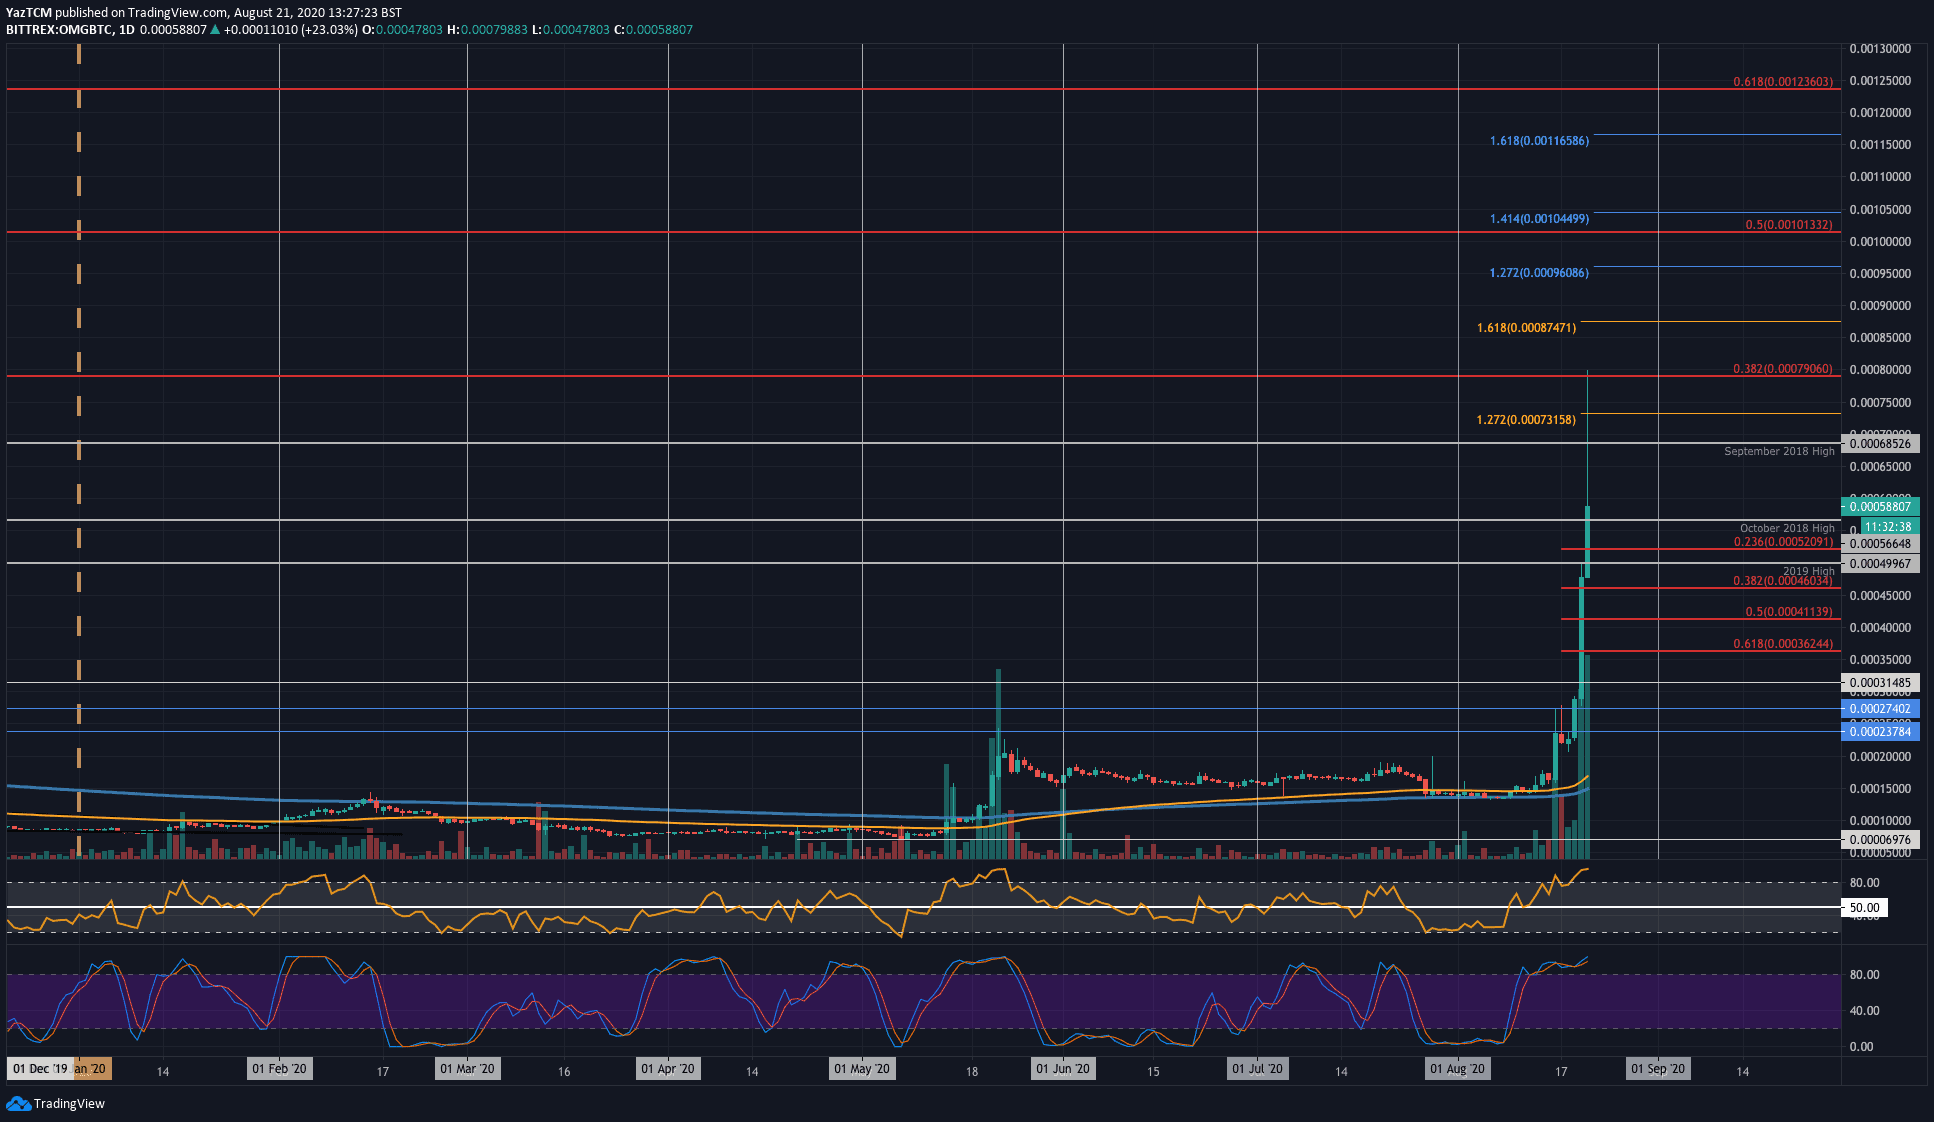
The situation is similar in OMG against Bitcoin. OMG started the week at around the 15,000 SAT level as it began to push higher. It stalled briefly at around 23,800 SAT during the week until a large candle penetrated above here yesterday to reach 50,000 SAT (2019 highs).
OMG continued to surge higher today as it pushed into the 80,000 SAT level (bearish .382 Fib Retracement). The sellers have since pushed OMG lower as it trades around 58,800 SAT.
If the buyers push higher again, resistance lies at 68,500 SAT (September 2018 High), 73,100 SAT (1.272 Fib Extension), and 80,000 SAT (bearish .382 Fib Retracement). This is followed by added resistance at 87,400 SAT and 96,000 SAT.
Disclaimer: Information found on CryptoPotato is those of writers quoted. It does not represent the opinions of CryptoPotato on whether to buy, sell, or hold any investments. You are advised to conduct your own research before making any investment decisions. Use provided information at your own risk. See Disclaimer for more information.
Cryptocurrency charts by TradingView.


